Altcoin market on crossroads — Bitcoin Dominance chart analysisHi watcher, on this chart i see Expanding wedge pattern near resistance of 62% of dominance.
Depends on power of Swap/DeFi hype around we will face different action on the market.
Deadalts looks quite realistic, but I am prepared for alternative — if dominance fall on the 60-53% zone we will see another fast wave of pumps in tokens and coins.
Artemcrypto

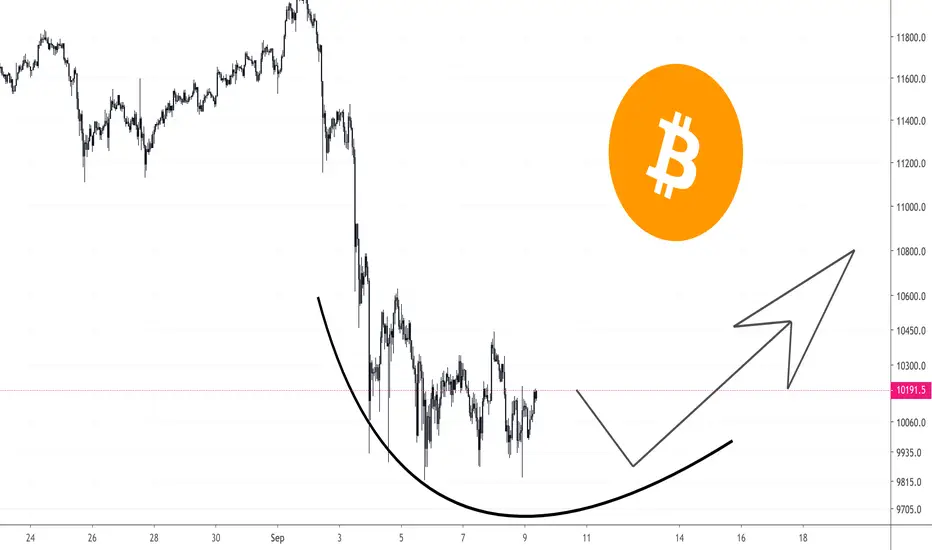
BTC / USD — 4h chart prediction: EW count Hey! It is possible last dip before great lift off. I always recommend to follow risk management, do not let yourself to lose more than you can.
We still didn't see any major drawdown since March, so keep in mind any possible scenario.
Now it is now cheap to buy, but highly possible to see FOMO run after consistent printing of higher highs.

BTC / USD — 4h chart analysisPrice action of btc often offers traps and fakeouts. Make sure you running safe risk management. I will expect attempt to make new higher highs in next period before any major retracements. Stay safe. Have a nice profits.

XAU / USD — 4h chart updatePrice of gold in bull trend, which caused by scarcity and low supply. Never forget about risk management. Level of protection below 1900.

GBP / USD — 4h chart analysisSeems like British Pound finished zig-zag correction in 4th wave, so I expect beginning of strong uptrend move during next period to see higher high of 5th wave. Do not forget about RM.

EUR / USD — 4h chart visionNext swing move can possibly start from 1.2100 down to 1.1522 before continuation to higher levels. Seems like price broke important resistance on higher timeframe.

Bitcoin Price Prediction 2020/21Bitcoin should be good investment for 2021. Make your choice. Do not forget about risk.
Have a nice profits!

Bitcoin Possible Next MoveHey! Recent move of btc to 12k wasn't supported by bulls, looks like we are looking for cheaper prices in next period. Setting up my next targets for upcoming days.
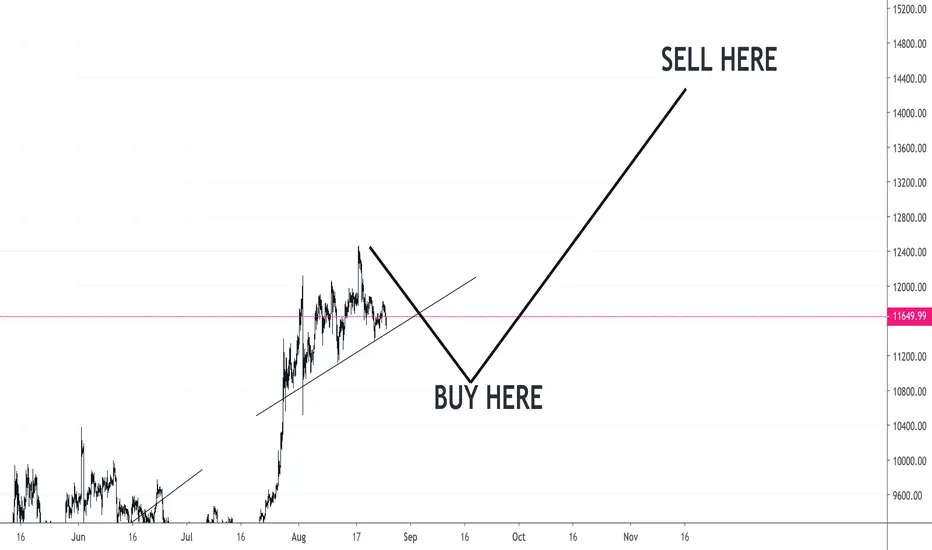
Bitcoin Investigation of SidewaysSo far bitcoin following same price action like in May, my prediction is based on the possible market run near 11000-12000 zone for next month and will continue to pump up to 14000 level or higher.
Take a look at patterns which occurred in Inverse Triangles during up-moves, they look quite similar. Triangles developed with 4 inside patterns:
💥 Pennant (green)
💥 Triangle (flat gray)
💥 Cypher (magenta)
💥 Rising Triangle (gray)
After breakout from inverse triangle price followed with Sideways action, notice the sequence of Lows and Highs in June-August. Next pump followed with same Inverse Triangle and same patterns.

ETHEREUM BUY AND SELL POINTSHere is good opportunity to take entry in ETHUSD in 360-385 zone. Mid term zone for breakout towards 520-640 levels, where we can start fixing profits from long-term holding.

Bitcoin Next MoveHey! I consider next move to be inside the range of 11200, before launch to 13000+ zones. Good luck in your trades.
Watch other Bitcoin mid-term ideas below:

SPX going to crash for 400 points. Next Bull RunHere on daily chart of S&P500 we can see see possible point of reversal from wave (1) in a correction (2) wave. This is the opportunity for fixing profits from April long. Price might fall down to 3000-ish levels where we can add to long- and mid-term portfolio. This is pretty good buying opportunity for new market participants as well as with experienced traders and investors.

Bitcoin AdventuresFor next 2 weeks we will face price action near 11000 and above 12800. Looking for 14000+ in late September.

Bitcoin Ultimate Buy and Sell GuideBuy lower — Sell higher!
Buy the rumors — Sell the news!
Buy when there's blood in the streets, even if the blood is your own.
I’ll tell you how to become rich. Close the doors. Be fearful when others are greedy. Be greedy when others are fearful.
👉 Find out who said this quotes and send in comments your favourites :)
Watch latests researches about bitcoin price action below:
BITCOIN EMOTIONS STRUCTURE — $100 000 per btc +644% Potential!!!Hey! Reading market emotions could be pain in ass ¯\_( 👁️ ͜ 👁️)_/¯ But what you can do about it?
M arkets always flow in ups and downs, every minute emotions change so the market following well known sequence of emotions: ... Optimism — Believe — Excitement — Thrill — Euphoria — Complacency — Denial — Fear — Desperation — Panic — Capitulation — Anger — Depression — Hope — Relief ...
This emotions sequence happen on all timeframes, you can find it every day and on every market/assets. Moreover this emotions people feel over and over during day and regular business and activities.
I find 3 tips how to see market emotion stage:
1. Be Cold Mind — Check Twice
2. Take a Guess, but Control Risks
3. Watch Your Mood — Ask Opinions
These steps can improve overall market feeling, but you have to train intuition and spend time on markets to find it's patterns. This require experience, so spend time to learn and try different things. Do not rush "all-in" if you are newbie, small is big in the trading.
Peace and have good profits. Stay tuned to Artem Crypto.
P.S. Bitcoin next stop could be near 100K, not joking.
remember this chart?
Good luck :)

LITECOIN GETTING READY FOR MASSIVE BREAKOUT BEFORE 2021Yeah, really, i hope you are ready for this move.
Looks like end of 2020 will be massive in crypto-gains.
Do not forget to buy low and sell high.
My personal levels for sell are on the chart.
chart patterns looks very attractive, you may notice how price forming triangle shapes on the way and creating one giant triangle for last year.
Current prices are quite good for buy and hold.
Using stop loss is recommended. DO NOT RUN IN BIG RISK. Trade wisely.

NEW VIDEO: HOW TO TRADE BITCOIN IN JULY?!Hi dear Tradingview!
Here is the idea of how to trade bitcoin in July.
Generally all described in video.
Briefly about the strategy and what to do:
-Stay patient
-Wait for breakout
-Be flexible
-Adjust your position accordingly to the move
Appreciate your likes and comments.
Chart as a pic:
Share what you think about Bitcoin and altcoins in the nearest perspective.
Stay tuned,
this is Artem Crypto

COMP: COMPOUND WEDGE BREAKOUTPrice of the COMP is on the possible breakout from Wedge pattern.
Price can increase for the several levels inside range of 220 and 180.
Pls, do not forget price of the COMP is quite high, and recently it increased from 60$ up to 380$
So i greatly advice to decrease risk in the trades which increased that much recently. Always use Stop loss to avoid unnecessary loss.
According to my view I think price can make some rebound around 199-200 zone and back to 180.
Thanks for attention, stay safe
This is Artem Crypto.

BITCOIN BREAKOUT AT THE CORNERHey guys! Here is update for Daily Price action on Bitcoin. What to expect from the breakout of Triangle.
In my opinion we should expect some fakeout breakout before the move.
So I determined 2 key levels for the Bitcoin in 10 000 — 8600 range.
Here is the clear view on the chart as pic:
In video you can find why i think so, basically because i am not a intraday trader, so i am looking for mid term points to confirm the movement.
Please consider using stop loss in your personal trading.
Stay safe and profitable
This is Artem Crypto

☆ XLM / BTC — Stellar Lumen Forecast ☆So the price of the XLM in the possible bottom formation and I called it «Base» on the chart, after base Breakout we notice huge increase in prices.
I’ve noticed few cycles on the price action and showed them on chart, here is the big cycle and 2 minor cycles. I believe price XLM soon will increase after the breakout from Base.
Historically price moving to 1600 and 3800 levels. If this time price will increase to this prices this will be insane profits (up to +350%). But of course do not forget about huge risk behind this potential trade.

BITCOIN 2019 / 2020 ULTIMATE PRICE CORRELATIONHere is the price of Bitcoin compare with 2019 bottom zone (below 4200).
Let't use Invert Scale on 2019 chart, here is the pic:
Look how similar the look now. I marked 7 phases in between Feb-Apr 2019.
Phase 1 (red box)
Price in 2 days making small dump and sideways, then suddenly pumps. Then moving in sideways without volatility. In 2020 we see similar action from start of the June, in 2 days price just pumped, then paused at top, then dumped into low volatility zone before phase 2. Phase 2
Phase 2 (blue box)
Price in 8 days moving in the big pump, sideways, pump and then dumping below the sideways zone. In 2020 we see similar price action, price dumps, then sideways another dump, then pumping to the sideways zone. Before phase 3 we see sideways and low volatility.
Phase 3 (green box)
In the 2019 price went down a little, then pumped this took 5 days, before entering sideways (up and down arrows) zone between 3 and 4.
Phase 4 (gray box) and 5 (red box)
After small pump, price stuck in the sideways and then suddenly made small dump for about 6 days. In 2020, we see similar price action, right now we are in point 5, and just last 4 days we were in the sideways.
Phase 6 (purple box)
Price after sudden dump in 2019 making sideways for 3 days before entering phase 7.
Phase 7 (cyan box)
In 2019 we see how price starting to sloping upside with small candles before huge pump in April.
Normal pic of 2019 here:
So here is my thoughts about the possible move, no matter which side of the bull or bear you are on. Realistically, both outcomes should be expected.
It’s important for me to use adequate stop loss for mid term positions. Now I am in long and expect a stop loss below 8600. In the opposite case, I will expect a price increase as long-term chart we are still bullish.
Peace and have nice profits!
This is Artem Crypto

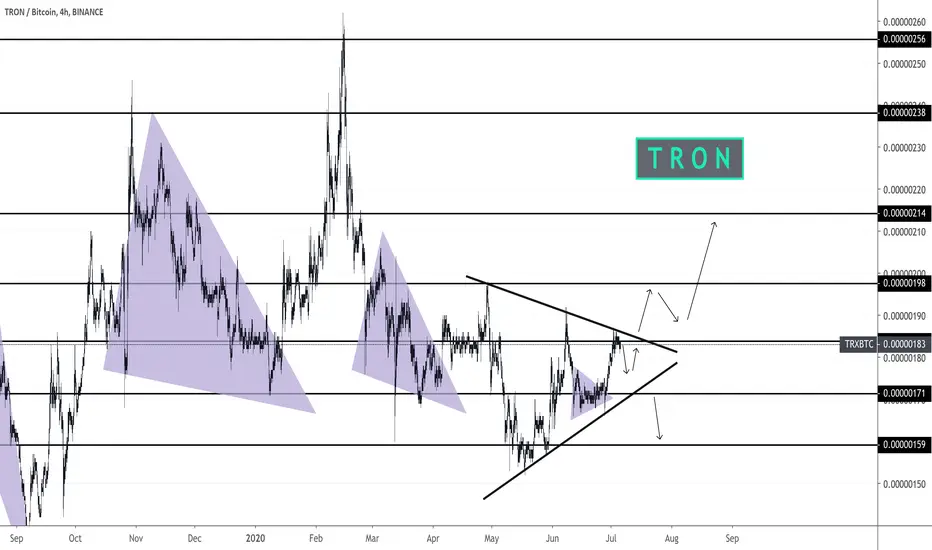
TRX / BTC — Possible reversal zone for TRONTron is in the range from 250 down to 150 for past year, looks like it can have massive breakout in Q3-Q4 2020. Let's hope for best. On chart mid-term idea. Keep it safe.
QLC / BTC — Possible Retracement Zone for Buy BackHello! here is the QLCBTC 4h chart, with possible levels for the rebuy on FIb levels. I suggest to see how it will go after breakout from the Red lines on the chart and keep and eye on the 170-150-130 zones.
