DeFi Index (COMP, KNC, LEND, MKR, KAVA, LRC, REN, REP, BNT, SNX)DeFi coins is hyping around crypto and here is TA for them.
On FTX we can see the DeFi Index based on charts of COMP, KNC, LEND, MKR, KAVA, LRC, REN, REP, BNT, SNX and ZRX (each coin is weighted equally). It can be traded at FTX with up to 100x leverage.
So on the price i marked all triangle shapes and found Giant Wedge
It already breaking out from it and possible will make sideways inside the triangle. Best way to avoid trading here and try to fix position in the Sell Zone. Or wait for the buy opportunity in the Support zone.
Thanks for your attention,
stay tuned
This is Artem Crypto
Artemcrypto

😱 BITCOIN PRICE PREDICTION 2020/2021 😱Here is the modern history of Bitcoin. I find 7 Phases of the bitcoin from the top of 2013.
1. Descending Triangle Phase
Price in form of triangle, in 2013 this pattern last for about 398 days.
In the 2018, we can see similar triangle shape and price last here for about same period in 341 days. Next phase
2. Ascending Triangle Phase
After breakdown of the phase 1, market in 2014 moved down and in start of 2015 formed Ascending triangle shape within 186 days. Now look at 2018/2019 zone of Ascending triangle, similar shape, similar period of 155 days. Next price moved upside to next phase.
3. Flat Zone Phase
After moving upside price stuck in Flat zone for the 149 days in end 2015 and beginning of 2016. In middle of 2019 price stucked in similar Flat zone for about 162 days. Then we moving to next phase
4. Inverse Triangle Rise Phase
In this zone we see about 105 days of rise in between middle of 2016. Here is highly debatable, but looks similar in end of 2019, you can see similar rise within 107 days. What happened next is phase of sudden crash.
5. Sudden Crash Phase
So you see the 4th phase with 107 days rise, then within just few days price suddenly crashes in end of summer 2016. Same Sudden Crash happened in fears of COVID-19 in March 2020, right after Inverse Triangle Phase (4). Now move to phase 6.
6. Lack of Certainty Top
In the end of 2016 we see the small volatility movement below resistance line and before this Top zone, we see steady rise for 153 days, before the market breakout from resistance line. In the 2020 we see steady rise after Sudden Crash (5) for about 156 days. Now price approaching resistance line without big volatility. Here is the prediction starts, in 2017 after breakout we faced 7th phase.
7. Parabolic Rush Phase
So after the breaking out from resistance line in early 2017, Bitcoin price started to grow, and after crossing previous highs market flooded with new traders and fresh money, which caused insane growth of the price for abut 357 days. Will this phase repeats after we cross 20k again? This is topic for discuss :)
👉 What price do you think we will face during 2020 and 2021
Stay tuned, have a good profits
Appreciate your likes and subscriptions
This is Artem Crypto

☆ BTC / USD — Bitcoin Simple Trade Setup ☆Hello dear Tradingviewians!
In this June 30 Update we can see the price breakout from FLAG pattern.
🏁 The Flag:
This pattern was spotted by me earlier, I have used 2 entries for this Flag, one on the support of FLAG other on the breakout from resistance.
So entries was at 9020 and 9120:
🏋️ Speaking about targets:
Depending on the way of your trading, and the trading style — you may choose different targets. For swing traders this possible good zone for entry in middle-term for one or two weeks.
Scalpers can take profits at Flag Target Zone near 9300.
🛑 Best place for Stop loss
Well it sometimes hard to get good stop loss price. You know market sometimes make fast moves to wash your stops?
So in this setup I am using SL at 8960.
It located below lower entry and protect from sudden dump.
💚 Thanks for your attention, white your questions and reviews
This is
Artem Crypto

☆ BTC / USD — Bitcoin Weekly Engulfing ☆Hello, making update from my phone 😅
🤔 Where we are:
Here is the weekly timeframe for Bitcoin. It shows possible bearish engulfing, but don't make early conclusions, we should update (press play) chart on the Monday.
👉 How to read the chart of Bitcoin:
If the price will open below the closing and show bearish patterns on the lower timeframes (1h-4h) then I will correct the strategy to avoid losses from my BTC LONG.
😵 Confusing Trades:
I am trading swing trades for Bitcoin and for leverage and for spot. That's why I keep holding the position of Long. Of course, if you are scalpers and day traders you might find another entries for longs or shorts.
🤨 How to win on the crypto market:
First of all, we are trading not against whales, FED or governments. We are trading against ourselves, this is psychology game and you have to know yourself to control the game. Keep your risk management simple and always make sure your trading criterias are met before executing the trade. Sometime staying out of trade is best decision to make money.
Stay profitable
This is
Artem Crypto

☆ BTC / USD — Bitcoin Buy Entry for 26 June ☆Hello, price on the bitcoin looks bearish to most of the players today.
Trying to think clearly and see how the price look now from Elliott Wave and possible Stop Loss if I am wrong.
Consider to share your ❤ Likes and comments!
Have a nice day!
This is Artem Crypto

☆ BTC / USD — Bitcoin Trading June 24 ☆Hello!
Here is what I expect from the price action on BTC USD
April Fracal explained and possible target, stop loss, entry for the long.
Share your Likes and comments for this video
Thanks for watching, this is
Artem Crypto

☆ ZIL / USD — Zilliqa In Danger, Here is WHY ☆Hey guys! here is the Zilliqa price prediction and analysis for upcoming moves.
I hope you will be safe and you control your risks in your trading.
This is explanation how to use Livermore's Cylinder in trading and market analysis.
Previous winning Livermore analysis by me:
BTC:
CAD:
CAD:
Stay tuned to
Artem Crypto

☆ BTC / USD — Bitcoin Trading 17 June ☆Hi guys! In this 2min video I explained what to expect from the Bitcoin Price Action in the next day.
Showed buy zone and possible target for the price.
After watching this video, suggest to send Like 💛, I appreciate it!
Recommended to watch previous update for the BTC here:
Stay profitable and tuned to
Artem Crypto

☆ XLM / USD — Stellar Forecast ☆Hello friends!
Price of the XLM / USD is near critical resistance level at $0.090
Pay attention to the MA100-200 positions and notice they are close to $0.066 which can be considered as next buy entry.
Price shape looking like (i)(ii)(iii)(iv)(v) wave shape and this could mean the retracement of the price to the MA100-200 zone.
I am expecting continuation of the growth after these levels and possible big move upwards this year.
Stoch RSI in overbought zone, confirming same conclusions.
Waves 12345 placed as possible bull market phase on the XLM after confirmation of shape inside 1-2
global pic:
DISCLAIMER: If you following somebody with good Risk/Reward and Win Ratio.
Without risk management and allowing yourself to lose some trades, you won’t be good trader/investor.
Please don’t follow any analyst blindly on this website.
Always use stop loss to prevent yourself from losses.
Make sure you understand and afford the risk. Please.
ATTENTION: Dear followers please consider to appreciate my ideas on tradingview with your likes, this will help bring more quality content in next trading ideas. And if new to my work, and you like it, you can Follow my page to receive ideas in your Ideas Stream. Thanks 🤝😊
Stay tuned to Artem Crypto

☆ BTC / USD — Bitcoin KEY FACTORS 15 June ☆Hello!
In this little video I am explaining KEY FACTORS and what to do with long and short positions!
Today I want to explain the move and tell you what I am going to do with my position, and my plan for Bitcoin
Have a nice trade!
This is Artem Crypto

☆ BTC / USD — Bitcoin Price Prediction ☆Hello!
In this short video, I want to explain what to expect from the price of Bitcoin!
NEXT MOVE OF BTC!
WHEN 8K?
LONG OR SHORT?
Inside video:
— Support and Resistance
— Elliott Waves
— Bitcoin Price Prediction
Trade safely, use proper risk management!
This is Artem Crypto

☆ BTC / USD — Bitcoin Trading June 14 ☆Price about to breakout from the triangle. I believe we will continue upwards. But i will consider to scalp short if price break downwards.

☆ ETH / USD — Ethereum Trading June 14 ☆Price of Ethereum following the range and yesterday I've entered the trade based on this chart, and i seems like all going on good.
I expect reaching the target in between 247 and 242

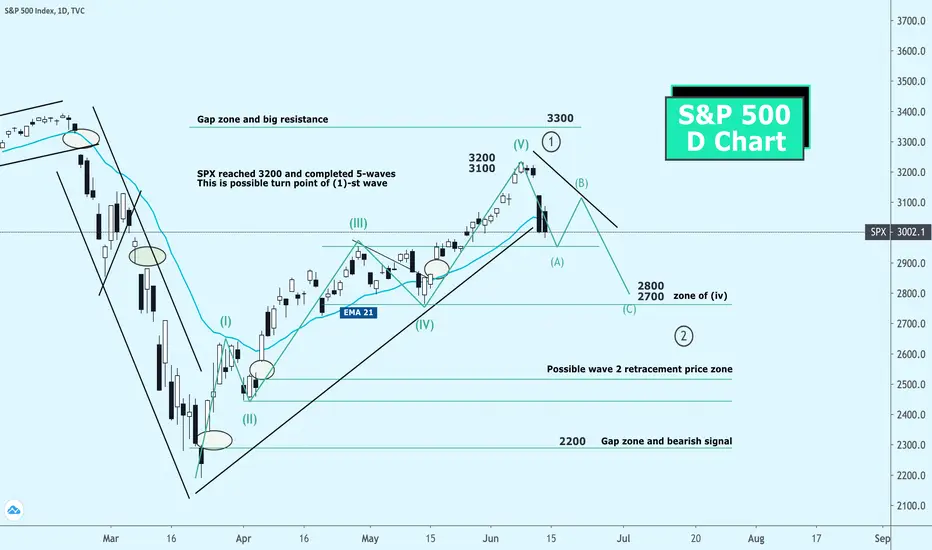
☆ SPX / USD SP500 — US Stocks Reversal ☆Price of SPX is turning down after completing 5-wave cycle, this can lead us to corrective phase inside (1)-(2).
Possible retracing to the 2800-2700 as previous (IV) wave bottom.
For next week I can expect some rebound to upside to complete (B) wave
☆ 🇺🇸 USD / 🇨🇦 CAD — Canadian Dollar Livermore ☆Target for Livermore Cylinder is done!! It took about 3 month to complete the move. Trend is your friend.
Previous idea posted 31 March
April
As next step for USD CAD I will expect growth from current range to 1.38 resistance/support flip.

☆ ETH / USD — Ethereum Trading Range ☆👉 In general range is a price corridor. When the traders is said the price has entered the range - this means it is moving in the corridor. From the resistance level at which the trading instrument is sold, to the support level where it is bought, then vice versa.
⏳ The price can move for a rather long time until the range ends and the price goes beyond the trading corridor.
In range trader clearly sees where he needs to sell and where to buy.
🛑 It is also very clearly visible where you can put a stop loss. And this is very important for me. The main thing is that the width of the corridor itself should be larger. Then there is the opportunity to make good money. And when the price goes out of the corridor I will make stop loss, but I won’t lose much.
🔀 In current range Ethereum have inside range, Top range in 225-254 and Middle range in 235-247.
🦸♂️ For me personally I like to trade swings and trendy moves. So I will wait for next opportunity of swing long or short.
👩🚀 I think if you consider yourself a scalper, then trading ranges will suit you.
Thanks for your support for this idea, stay safe, this is
Artem Crypto

☆ BTC / USD — Bitcoin About to Move ☆Hello!
Here is the 1h chart update for you. Last couple of days was wacky shaky sideways action on the price, tonight i expect some movement towards breakout from resistance and within a week expect rise of the price to 10k+++ zone.
More strategy explained on the chart with arrows and tips.
Stay tuned to Artem Crypto

☆ SPX / USD SP500 — US Stocks Trading ☆Hello!
Welcome on regular Daily chart update for S&P 500 and US Stocks market.
Price is above 3000 resistance zone for 4 days already, and this Monday probably will be above it too, or at least close to it.
I am still looking at 12345 Elliott Wave structure, and looking for the continuation inside sub (v).
IMHO, After reaching resistance at 3200-3100 we are going to face first correction inside 12345 cycle.
Yesterday's SpaceX's 1st astronaut launch was successful and this is one of sentiments of the market. This shows possible strength on the Stock Market.
Back to technicals, Price still above EMA 21 on daily, this is good sign.
So must say, stocks are running locally in bull trend, so i will trade them as a bull :)
Stay tuned, this is
Artem crypto

☆ BTC / USD — Bitcoin Trading ☆Hello,
Current bitcoin move is not very attractive to trade, especially intraday setups, look like market is deciding to change direction or accumulating more force.
As I see next bitcoin trade we can find below 9500,
I will use split buy orders below current level and down to support line.
Targets and stop loss I shared in my trading group.

☆ ETH / USD — Ethereum Trading ☆Hello! price of ETH just looks like a january 2020 move. Interesting will it go up or this time situation will be different?
SL below the previous S/R flip

☆ XRP / USD — Ripple Forecast ☆Hello friends!
This update for XRP / USD. this is what i see on the price action and please, support with like and your idea below.
Price in the middle of Symmetrical Triangle and have big chances for breakout soon.
Here above price I notice MA200 resistance, which was rejected 2 times and probably will be broken to upside, at least i hope so.
On support of Triangle there is a MA100 which can be good marker for next move, signaling for rebound or for the breakdown for triangle.
DISCLAIMER: If you following somebody with good Risk/Reward and Win Ratio.
Without risk management and allowing yourself to lose some trades, you won’t be good trader/investor.
Please don’t follow any analyst blindly on this website.
Always use stop loss to prevent yourself from losses.
Make sure you understand and afford the risk. Please.
ATTENTION: Dear followers please consider to appreciate my ideas on tradingview with your likes, this will help bring more quality content in next trading ideas. And if new to my work, and you like it, you can Follow my page to receive ideas in your Ideas Stream. Thanks 🤝😊
Stay tuned to Artem Crypto

☆ 🇬🇧 GBP / 🇺🇸 USD — British Pound Trading ☆Hello dear community!
Price of British Pound rise to my target, and now seems like confirming the impulse structure and possible can go higher, suggest to open position in dips, and looking for rising up to 1.250.
Please consider using stop loss and risk management wisely.
DISCLAIMER: If you following somebody with good Risk/Reward and Win Ratio.
Without risk management and allowing yourself to lose some trades, you won’t be good trader/investor.
Please don’t follow any analyst blindly on this website.
Always use stop loss to prevent yourself from losses.
Make sure you understand and afford the risk. Please.
ATTENTION: Dear followers please consider to appreciate my ideas on tradingview with your likes, this will help bring more quality content in next trading ideas. And if new to my work, and you like it, you can Follow my page to receive ideas in your Ideas Stream. Thanks 🤝😊
Stay tuned to Artem Crypto

🇺🇸| 🇨🇦 Livermore & Target for Drop CANADIAN DOLLARHello friends. Want to share with you my observation on USD/CAD mid term view.
Found on the google images Livermore Accumulation Cylinder.
Actually many times before I've noticed this pattern on other hype-fib moving assets, such as crypto.
Will see how it will goes.
I see target at 1.35
This is only for speculative purposes.
Stay tuned to Artem Crypto.
