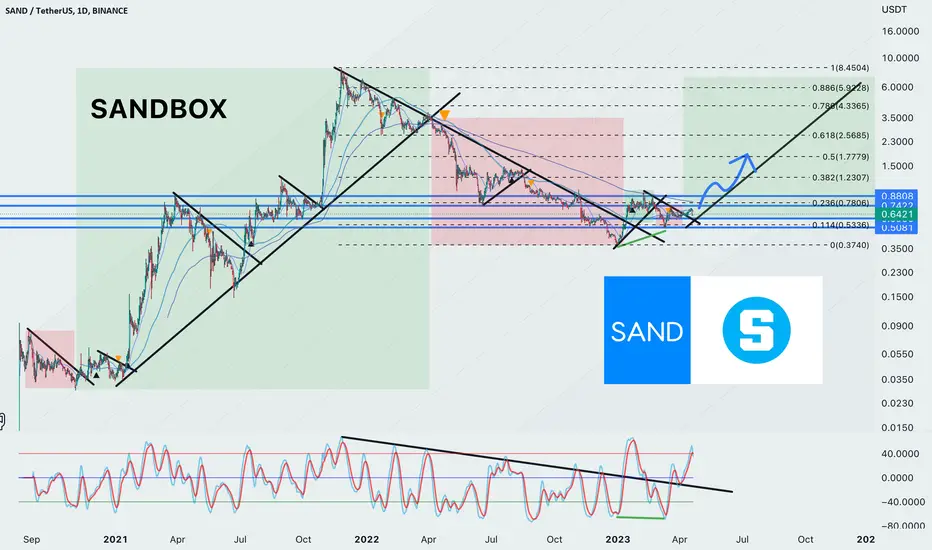
Analyzing the Price Trends of SAND Cryptocurrency SANDBOXThe growth of SAND cryptocurrency in the 2021 year has been nothing short of remarkable. In just 13 months (from 2020), the price of SAND rose from a humble 0.02$ to an impressive 8.00$. This meteoric rise has caught the attention of many investors, who are now scrambling to get in on the action. What is even more impressive is that this growth occurred after a time of great uncertainty in the world, as the COVID-19 pandemic was wreaking havoc on the global economy. Despite these challenges, SAND was able to grow exponentially, proving that its unique blend of gaming and blockchain technology is resonating with a wide range of people. As we look to the future, it's clear that SAND has the potential to continue its growth trajectory.
The SAND cryptocurrency experienced a significant price drop in 2022, with the token falling from its previous high of 8.00$ to just 0.37$. This decline took many investors by surprise, and many were left wondering what the future held for SAND. However, it's important to note that this price drop was not unique to SAND, as the entire cryptocurrency market experienced a bearish trend during this time. Despite this setback, the team behind SAND remained committed to the project, and continued to work on improving the platform and expanding its partnerships. In 2023, the price of SAND finally established a bottom, with the token hovering around the 0.37$ mark. While this is a significant drop from its previous highs, it's important to keep in mind that cryptocurrency markets follow same cycles over and over again.
Based on technical analysis of SAND's chart and its Fractal structure, it's possible that the token may experience a price increase in the coming months. The chart indicates that SAND has been consolidating in a range between 0.3$ and 0.8$ for several months, which could indicate a period of accumulation by investors. Additionally, there has been a recent uptick in trading volume, which may signal increased interest in the token. Based on these factors, it's possible that SAND could see a price increase in the spring or summer of 2023, with the token potentially reaching levels of 2.0$ to 2.56$.
Artemcrypto
ArShevelev /// Ethereum Diamond & Triangle. Still Heading North.Hey there! Ethereum price has fantastic opportunity to make further move to the north. However no one says the road will be easy.
Currently price action is locked in diamond pattern, indicating for local swing reversal.
Thus far, it is viable to purchase for the mid-long term along a support line in the $1340-1450 range.
Patterns Cheat Sheet :

Ripple's Mid-2023 Move: A Bold Step Forward or a Risky Gamble?I strongly believe that XRP may experience a temporary downward trend before making another significant surge.
Upon conducting a thorough analysis of XRPUSDT and XRPBTC, I have developed opinion that XRP may experience a temporary downturn before experiencing another substantial surge.
Repeating history cycles in trading is a well-known phenomenon. Market cycles, which refer to the periodic recurrence of trends, are a characteristic feature of financial markets. These cycles are driven by a range of factors, including economic indicators, political events, and technological advances, among others. While the duration and intensity of market cycles may vary, patterns tend to repeat themselves over time.
Based on my analysis of the Relative Strength Index (RSI) and the price range (channel), I believe that XRP may experience a temporary dip before potentially rallying from 0.5. It is important to note that this rally may occur without significant retracements down to 0.23, as I previously indicated in my earlier update.
It is essential to exercise extra caution in light of the current market conditions, where traders and investors are not as prone to FOMO (fear of missing out) as they were in 2017. As a result, any temporary dip could potentially be smaller than anticipated, just as the rally could be relatively moderate.

Bitcoin's Incredible Rise: Say Goodbye to $18,000 ForeverHey traders its @ArShevelev , It is possible that the recent banking crisis will demonstrate the true value of Bitcoin
Despite banks' shares sliding down by 70%, Bitcoin passes the bank stress test as it has been performing nicely, gaining 75% from its bottom.
This resilience of Bitcoin during times of economic uncertainty has been attributed to its decentralized nature, which means it is not controlled by any government or financial institution.
Additionally, Bitcoin's limited supply and the fact that it is not subject to inflationary pressures have also contributed to its appeal as a safe-haven asset.
As more investors seek alternative investments outside of traditional financial systems, cryptocurrencies like Bitcoin are becoming increasingly popular as a means of diversifying portfolios and mitigating risk.
In my opinion, it would be prudent to carefully evaluate the current price structure by crossing and retesting the 29,000 level, which serves as a critical support/resistance level. It is reasonable to anticipate potential price movements above the 29,000 level within the range of 41 to 30 over the coming months or even a year.
I have included my price prediction drawings on the chart below for your reference.
STOP EVERYTHING and check out the mind-blowing Accumulation PATTERN you've NEVER seen before:
Best regards,
Artem Shevelev

ArShevelev /// BAL Next Leves to Get ProfitHey traders!
BALUSDT in pretty flat triangle in range of 5-7. This zone could be potential accumulation phase, so I want to take early trade and enter below 7-ish with targets 8-9-10-11
Good luck!

ArShevelev /// GMT What's Next?Hi traders!
GMTUSD price made a +50% move after retesting important support level. I believe it will rebound near 0.38 and start moving up 0.6 - 0.68
Good luck!

Uncovering Wyckoff Accumulation Secret PatternWyckoff Accumulation & Distribution is a trading strategy that was developed by Richard Wyckoff in the early 1900s. It is based on the premise that markets move in cycles and that traders may recognize and use these cycles.
In accumulation phase Wyckoff strategy involves identifying a Trading Range where buyers are accumulating shares of a stock before it moves higher. This allows traders to enter into positions at lower prices and benefit from the eventual price increase. Wyckoff Accumulation is an effective way for traders and investors to gain on market movements and make profits from their trades.
The Wyckoff Trading Ranges feature a chart pattern called Descending Wedge. This pattern involves two trendlines, one falling and one rising, which converge to form a wedge shape.
This pattern indicates that the price of an asset is likely to break out in the direction of the falling trendline.
In my understanding, "Continuous Weakness" means a shift away from selling towards buying. Sellers fail to hold the pressure, so buyers take the lead leading in D,E: MARKUP phases.
Kind regards
Artem Shevelev
Please check out my older Education Ideas
Consider put like and follow my page for more updates)

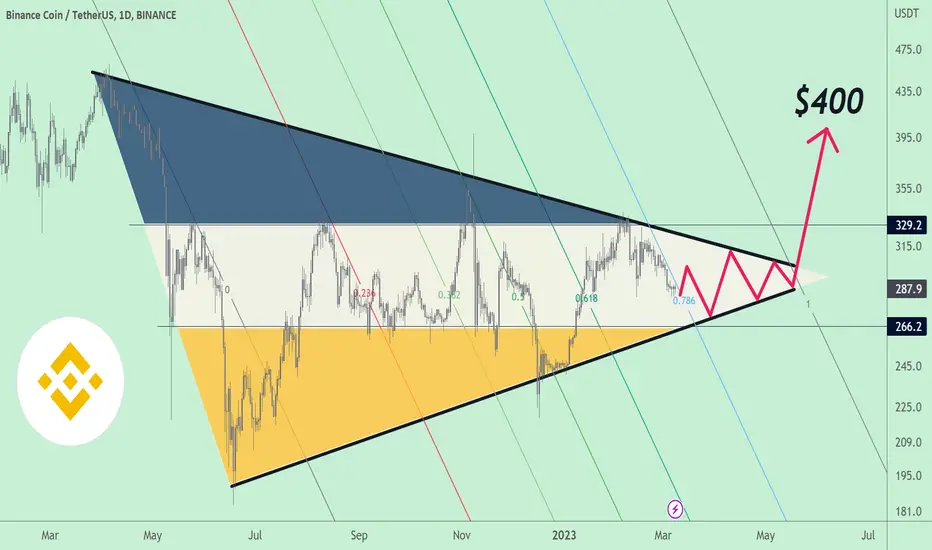
ArShevelev /// BNB Crazy Big Triangle to Breakout!Binance holding nicely during whole bear market phase, and it seems like it will make another good profits for those who entering next bull phase!
$400 is a "musthave" expectations, realisticly prices could be much, much higher in 2025.
Kind Regards
Artem Crypto
ArShevelev /// Bitcoin's Decline is InevitableThe fact is that a lot of people just don't care about Bitcoin anymore. If you do a Google search for "Bitcoin," it will lead to 623 million results. But if you do a similar search for "bitcoin price," there are only 157 million results, and the vast majority of them are not important news articles or price analysis.
And the reason why Bitcoin prices remain stuck in sideways channels or breakdowns is because most people don't care about it anymore. Price action is boring.
They're waiting to see how much they can make by buying low and selling high, and they're not so concerned about the reality that such a purchase demands endurance and perseverance.
Most people are used to trading in 2022 on futures in a continuous downtrend, but now the time has come for a trend shift, and we see the movements altering each other up and down, causing the market to go sideways.
If there is a long-term buyer on bitcoin, I am confident that it will purchase quietly and change the public attention away from purchasing but towards selling. Remember that.
Things might change if the price goes below the 20600 level, which I believe is critical for momentum. Yet, if 20600 is broken, we will almost certainly witness a double bottom attempt.
Kind regards
Artem Crypto

The Simpliest Math Behind Every Succesful TraderWhat exactly is risk management?
The ability to control your losses so that you do not lose all of your equity is referred to as risk management. This is a system that may be applied to everything that involves probabilities: trading, poker, blackjack, sports betting, and so on.
Many inexperienced traders underestimate the significance of risk management or don't understand the basics when it comes to risk management.
Would you risk $5,000 on every trade if you had a $10,000 trading account? Probably not. Because it only takes two consecutive losses in order to lose everything.
🧠 Now, let's imagine a thought experiment, in wich 🤩Alex and 🤨Peter are both traders with $10,000 in their accounts. Alex is a high-risk trader who puts $2500 risk on every trade. Peter is a cautious trader who puts $100 risk on every trade. Both apply a trading strategy that has a 50% success rate with an average risk-to-reward ratio of 1:2.
For good example, let's imagine the next 8 trades had the following results:
4 losing trades in a row
4 winning trades in a row
Here is the result for Alex: -$2,500, -$2,500, -$2,500, -$2,500 = -$10,000 Loss of the total account 😭😭😭😭
Here is the result for Peter: -$100, -$100, -$100, -$100, +$200, +$200, +$200, +$200 = +$800 Profits. 🏆 🏆 🏆 🏆
Can you tell the difference? See how risk management show the difference between being a profitable or losing trader. Peter managed to recover losing trades, and get into good profits after 8 trades. Alex didn't survive 4 trades...
🚨 You might have the finest trading strategy in the world, but if you don't manage how much you lose, you'll lose it all. It's only a matter of probability and time.
However, following this basic example will assist you to make your trading more profitable. Simply give it a shot.
Kind regards
Artem Crypto
Follow, Like and Share are appreciated!
Take a look at my other Educational ideas below:

ArShevelev /// Ripple XRPUSD Triangles in the trendRIpple price fluctuations made an Triangular shapes following the trend line since Mid-2021.
Currently price still forming another triangle and will take time to breakdown it to the target at $0.23.

ArShevelev /// Promising price action of the DASH during SummerThe Dash cryptocurrency has been steadily gaining in value since its launch in 2014.
Summer 2023 is set to be an exciting time for the DASH cryptocurrency. With the launch of the DashPay social payment app, I am are expecting a promising price action of the DASHUSDT. This will be a great opportunity for those looking to invest in cryptocurrency as DashPay app is expected to be a game-changer in the crypto space.
The DashPay promises to provide users with an easy and secure way to transact using all advantages of social networks. It also aims to make it easier for users to store, send, and receive dash. As more people become aware of this new app, it's likely that we'll see an increase in demand for DASHUSDT, leading to a promising price action during Summer 2023.

ArShevelev /// Bitcoin Key ZoneI like how bitcoin appears, and the current zone will reveal who is the most powerful in the game. The 20k level already has the interest. If this level fails, we will most likely see a drop to the 17-18k zone.
Given that the price may remain over 20k, it is highly possible that it will continue to rise, potentially exceeding 25k in the near future.

Ethereum Classic ETC/USDT TA & LongHey there, here is ETC/USDT TA
In my opinion this chart looks great. It looks like it respect TA and patterns.
I think it has good chances to rise up to 60%

AVAX down 90%, perfect opportunity for huge gains!AVAX crashed by 90% which can lead to the rise with huge gains. Price still in downtrend channel, but recently it showed bullish engulfing and moving to resistance of the channel where I am expecting rebound to support zone.

ETC Long play incoming gainsEthereum Classic always makes nice rebounds in support zone. This means now it is good opportunity to take risk, because price in support zone from long term.
Consider to protect yourselfs and use stop loss if you trading it.
Expecting 3 major targets (on the chart) within next month.

BITCOIN 1h Update 10 December 2022Good day! Artem here with analysis update on Bitcoin at 1 hour TF. Here are my predictions for the price movement in the following week:
Today, BTCUSD is most likely going to move in a sideways motion about $17000-17140. Expecting an upward breakout on Monday, December 11 with a conservative target near $17400–17500.
Notice my stop loss on the chart. I consider this as a bearish takeover point.

BITCOIN 1h Update 08 December 2022Hey is is Artem update on BTCUSD price action on 1h TF. Looking for movement in range 16660 up to 17200 during weekend.
Price consolidating at rising support lines before fake breakdown and rise. According to this behaviour I am thinking price will rise afterwards and break Green Resitance line to move up 17200.

Bitcoin approaching 17000Hi everyone! Here is 1h chart analysis for Bitcoin for next 2 days movement. Looking on the movement during 5-th and 6-th December upward 17400-800 if BTC keeps its momentum gained from 21 November with 2 impulse waves.
Keep yourself protected and I will use 16600 as invalidation point of this analysis.

ADA / USDT Follow up Hi everyone, its Artem! Here is my idea on 4h Cardano chart. Seems like ADA might take a jump upside if Bitcoin remain climbing above 17,000.
My ADA targets at 0.34-36-37

TESLA market structure, prior Earnings breakoutTSLA stock price consolidating and looks like there are some reasonable slowdown of price action prior Earnings report in mid October.
Check out chart to see rising support and resistance at 313. This zone will determine further price action.
I think if Earnings come back negative - price will chop down to lowish levels. Visa versa for positive Earnings - breakout of 313 resistance will bring prices up to upper range.
Best regards
Artem Shevelev

Bitcoin Trade Plan: Strongly suggest move to $30,000 in mid termHey guys, here is the Daily timefr ame update on Bitcoin chart. If you like this chart, please use Like button 💙💛
I really like to see bullish outcome for Bitcoin, and to get it as higher as possible this year. But take a look at positions of the Moving averages on the chart: I am using combo of Daily moving averages 500 and 620, this is rarely used MAs, but they works nice on Bitcoin, and shows crucial support bound near $36,000. If we going to see breakout from $36,000 *DMA620 — price will likely to move down to $30,000.
In case breakout from $30,000 it will cause domino effect and price will fall at least down to $22,000 to Weekly Moving Average 200 (WMA200). This is strong support line for Bitcoin all-time history.
In case Bulls can fight for $46,000 + region, we going to see move upwards to Supply zone of $50,000-56,000 where another (3rd) large sell-off can occur. But anyway, this is Plan B for Bitcoin durin Q2 of 2022.
Thanks for your attention.
🙏Pray for Ukraine 💙💛

🔥 BTC / USD — Bitcoin Trading Mid-May 2022🔥Hey there, its Artem and here is update for upcoming week for Bitcoin.
After Bitcoin breaking below $37,000 it making impulsive moves down. Now taking $34,000 zone and might take a short recovery week during mid-May.
Expectations near $37,000ish and possible continuation down to $29,000 and $24,000 support regions in next 6 months.
Currently waiting in cash and taking small risk trades counter-trend (long) to $37.000 to see whats happening next.
Stay safe
Pray for Ukraine
Best regards
Artem Shevelev
