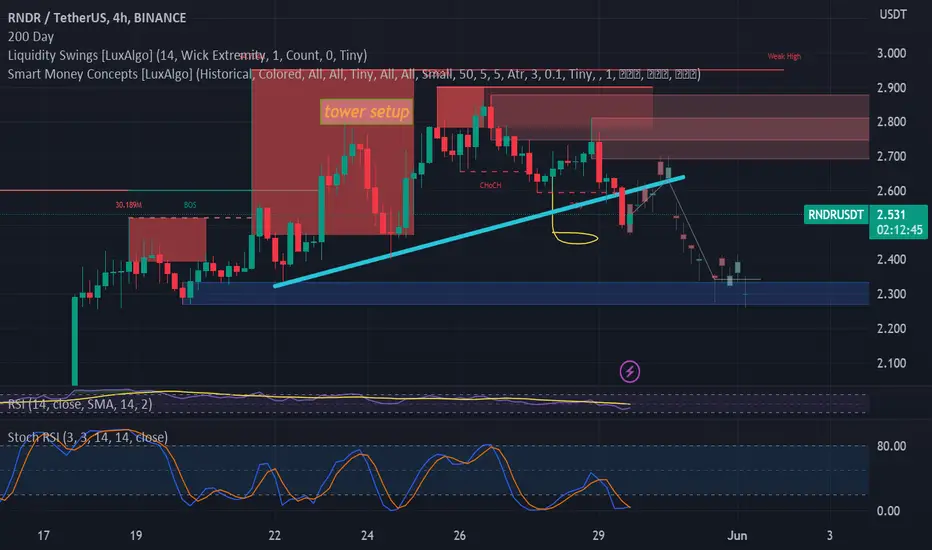
Render multi timeframe analysison the 4hr tf we have a head and shoulders that i believe we will retest the neckline and go short on the tf we have a tower pattern also sending us short
Artificial_intelligence
$VRA Technical Chart - Matter of TimeVerasity - whether you believe in the artificial intelligence narrative or not, you may be sleeping on a giant. My question to you would be - did you predict the NFT narrative and invest in solana at $1 ? The obvious answer is likely not early enough. Whether we believe in AI or not, it is coming. With every crypto cycle, investors and traders love a new and exciting narrative. Do I believe in Verasity 10 years from now, maybe not. But if I've learned one thing in my 7 years of crypto, is that you should be able to identify strong assets with the new and shiny buzz prior to a bull market. In my opinion, that is $VRA.
As for the current chart -
We, in my opinion, are seeing a form or re-accumulation that mat look like a dying out coin that is lackluster and un-volatile. This can be said about many, sound asset, technical charts as of today's date. We have seen this before.
The excitement of the run from 0.002 to 0.01 was pre-mature, in other words the market was not ready for the bull market. A classic bull trap the retraced almost fully. This sets the stage for re-accumulation, where the second set of 'smart money' gets involved before it's too late.
VRA has lost a critical S/R level at just over 0.006 - this level I've zoned out in the green box is also denoted on the volume profile as the Point of Control (POC). Meaning, the market perceives this price point as an important level to trade at, for whatever reason. Losing this is bearish, but reclaiming it is very strong.
My current thoughts is yellow is our zone or re-accumulation - with flexibility. I think deviations to the downside are to be expected, and the likely scenario. If a swift reclaim of yellow zone is the case, thenmost certainly I see this as a form a re-accumulation - this follows the criteria for RA precisely.
If we lost yellow for an extended period of time, it leads me to believe this bear market is no where close to being finished, which is certainly possible. I think we are in the 'depression' phase which is still a form of accumulation, so it is not to be ignored.
Volume declining until it isn't, it will pop and when it does it means the market is getting involved again on a macro level. Something we need to watch, absolutely.
Reclaim green, hold, consolidate, push higher, bull market is back on in my opinion. Until then, I will be accumulating this digital asset.
Do your own research, manage your own risk.
Cheers,
Vatsik

Oraichain Token
Oraichain Token is looking very good :) steadily rising and with AI popularity it's a coin you may want to add to your collection

AMD -> Uptrend Will ContinueHello Traders,
welcome to this free and educational multi-timeframe technical analysis .
On the weekly timeframe you can see that AMD is actually approaching a quite nice previous weekly support/resistance area which is now turned resistance again.
You can also see that weekly market structure is beautifully bullish, AMD is always creating new higher highs and higher lows, so I am now just waiting for a short term rejection away from the resistance before I then do expect more upside potential.
On the daily timeframe you can see that AMD is showing some rejection at the $110 level which was also previous daily resistance, so I am now just waiting for a retest of the $98 level before I then do expect a new fresh rally towards the upside from there.
Thank you for watching and I will see you tomorrow!
You can also check out my previous analysis of this asset:

SOUNDHOUND SOUNHi Folks,
SOUNDHOUND SOUN presents a quite interesting chart pattern.
• A big move in the past 1-3 months anywhere from 30%-100% the rally last for a few days to weeks.
• Stock is above ema 200
• Orderly consolidation with higher lows & tightening range:
• RDM, VCP
• Stocks surfs the rising EMA 10 or the EMA 20, and sometimes the EMA 50
• Volumes are significative compared to previous phase
• Volumes dry up at the end of the consolidation
• Volumes are strong during the breakout
• ADR is high
Does it also "Sounds" good to you ?

BOTZ - The Age of AiHello Team,
Here we have a high-quality diverse ETF focused on Robotics and Ai.
In current market trends, Ai & Robotics are at the forefront of discussion and growth prospects.
Technicals: We can see that the monthly MACD gas recently flipped bullishly and we are getting strong buying pressure off of the accumulation zone.
Enjoy!

The language learning app Duolingo continues to outperform As tech related stocks break out higher, DUOL is another one not followed by many that needs to be watched.
While the company is yet to put in a profitable year, its revenue has grown from 71mn in 2019 to 369mn in 2022. GP margins remain very strong but NI is yet to turn positive.
Its total cash position has grown from 60mn in 2018 to 608mn in 2022, giving the company ample cash for expansion.
Current ratio is around 3.64 as of Dec 2022.
Very limited long term debt.
Cash per share is $15.63
Technically, the stock remains in a well established stage 2 uptrend where good pull backs on low volume could be considered as buying opportunities.
With the company expected to grow its revenue by another 37% this year and its losses to shrink further and put the company closer towards profitability, DOUL continues to be a solid growth stock.

AIDoge : Make Money from MEME's 🤖Hi Traders, Investors and Speculators of Charts📈📉
MEXC:AIDOGEUSDT BITGET:AIDOGEUSDT OKX:AIDOGEUSDT.P
Ev here. Been trading crypto since 2017 and later got into stocks. I have 3 board exams on financial markets and studied economics from a top tier university for a year 🏫
AiDoge is a new crypto project that strives to solve the need for exciting memes that drive engagement. As a result, it offers an AI platform that allows users to buy credits with the native crypto, NYSE:AI , and use them to generate memes. By typing prompts into the system, the AI behind it interprets your request and generates an appropriate meme. With this unique utility fully described in the official whitepaper, AiDoge has effectively combined two popular trends in the crypto world — memes and AI. No other coin has managed to do the same, not even ArbDoge AI, a similarly designed crypto that lacks the utility aspect of AiDoge.
AiDoge wants to create an entire community behind the project, and it aims to achieve this by rewarding both those who stake and vote. Once you buy NYSE:AI tokens, you can stake them to gain daily rewards in the form of the same token. Moreover, you can vote on memes other users have created. In turn, this yields you more tokens and rewards the best meme creators. Other similar projects have also gained popularity and increased in value, including Pepe Coin and Wojak. If you’ve missed these pumps, AiDoge might be the next big thing for you. It certainly has more promise than many other cryptos from the past.
As more people realize its potential, artificial intelligence is expanding . Now, with AiDoge, it has entered the crypto market. AiDoge was built on the Ethereum blockchain as a memecoin. The AI-driven meme creator is set to be widely adopted in advertising and marketing sectors due to its ability to create high-quality memes that are also unique. The thing that could potentially give this coin value is the fact that anyone can use their creativity to create memes and be recognized in the community for their efforts. This means that creating memes will be done in moments and will be displayed publicly. The creators who make the best memes will be rewarded for it. Furthermore, the platform is user-friendly and easy to use, which will be extremely helpful for beginners searching for a meme coin to begin their investing/speculation journey.
_______________________
📢Follow us here on TradingView for daily updates and trade ideas on crypto , stocks and commodities 💎Hit like & Follow 👍
We thank you for your support !
CryptoCheck

Growth of at least ➕35% ChainGPT(CGPT)by Falling Wedge pattern🚀The ChainGPT was able to complete the falling wedge pattern near the support zone.
ChainGPT broke the upper line of the falling wedge pattern.
Also, we can see Regular Divergence(RD+) between two consecutive valleys.
I expect that CGPT will grow by at least ➕ 35% .🚀
ChainGPT Analyze ( CGPTUSDT ), 4-hour time frame ⏰.
Do not forget to put Stop loss for your positions (For every position you want to open).
Please follow your strategy, this is just my Idea, and I will be glad to see your ideas in this post.
Please do not forget the ✅' like '✅ button 🙏😊 & Share it with your friends; thanks, and Trade safe.

Pearson down 11% on AI worriesIf AI is eating your lunch, your company better have a good strategic plan to adjust and create new revenue streams.
This is classic Marketing myopia, e.g. US railways, in mid 20th century, saw market share eroded by the airlines. That's because railroads never saw themselves in the transportation business, and limited themselves themselves by thinking they were in Railroads alone.
Pearson has had to deal with all sorts of changes, especially technology, and I'm sure they will have a strategic plan.
Technicals: Bearish reversal now under 50 weekly EMA, but volume isn't high so early days. Below 756 would confirm a new downtrend.

Chainlink Long Play - 400% Gain Potential - FUTURE OF AI AND IOT
Entry Price: $7.30
Resistance 1: $9.37
Resistance 2: $19.00
Resistance 3: $34.00
As a financial analyst with a focus on cryptocurrency markets, I have conducted a number of analyses on Chainlink and offer an updated perspective on the asset's recent price action.
Chainlink has demonstrated a struggle to breach the same 77% range horizontal channel, delineated by a shaded orange band, throughout the past year. Should the asset surpass the pink diagonal line, we may witness sufficient strength to advance toward the next resistance level of $9.37, thereby representing a 33% increase. I estimate that this move may occur within 31 days, culminating at the end of May 2023.
Major resistances may not arise until the 19 and 34 dollar range, indicating an approximate price increase of 175% and 400% from present levels, respectively. In my assessment, these projections are not beyond the realm of possibility. In fact, considering past price action and current adoption rates, I posit that these estimates are exceptionally conservative.
Over the past three years, Chainlink has remained among my preferred assets and I perceive its potential to burgeon as undeniable. Therefore, I advise investors to consider incorporating Chainlink into their portfolios at this time.
Chainlink (LINK) is a cryptocurrency that provides a decentralized oracle network that enables different blockchains to communicate with each other through cross-chain interoperability. The technology provides secure cross-chain applications that allow data and tokens to move across cross-chain smart contracts. The cryptocurrency has shown a strong bullish trend, and the technical analysis indicates potential price targets of $9.37, $19.00, and $34.00. Moreover, the blockchain-agnostic oracle network has the most widely adopted oracle network in DeFi, providing the highest quality data that is resistant to manipulation. As blockchain oracles continue to reduce switching costs and meet security requirements for enterprise use cases, Chainlink is in a strategic position to benefit from the blockchain technology's adoption by global enterprises and governments.

INTC starting new upward trendIntel stock is retesting multi-year support, showing a local triple-bottom. It just broke out of resistance, is retesting it as support. If the red resistance lines holds up as support, INTC could quickly reclaim 50-60. Value in this business is being helped along by technology advances and domestic stimulus. Explosion of AI softwares incentivizes chip development as does domestic stimulus in chip manufacturing. AI tailwind meets "Buy American".

IMGNAI to the moon?RISK/DISCLAIMER
As you are aware, many tokens have rug pulled in the past. This token may even rug pull, but I don't think it will. The developers have not been doxed and remain anonymous. Additionally, I have not been paid in any way to promote this token. Remember to always do your own due diligence.
Consumer Level AI NSFW Content is Here!
The new trend in cryptocurrency is AI, and we are just at the beginning. IMGNAI has already developed a functioning product that has produced phenomenal results. I encourage you, the reader, to try it out on their Discord server (link available on their website). Currently, it is relatively illiquid due to limited listings. However, there is a Huobi listing in the works according to on-chain activity, and it is likely that other high-tier exchanges will follow, given the quality of the product. It can generate many things including NSFW content, your imagination is the limit literally speaking.
Currently, there are eight models available that can be prompted to generate content (as listed on their Gitbook)
/nai - Our base model, /nai, is trained on the most popular anime art styles. This model is optimized for fun and flexibility so you can input detailed or basic prompts and generate a near-infinite range of beautiful, anime-inspired art.
/real - Our /real model lets you create photo-quality realism with incredible prompt responsiveness. From photo-realistic portraits to believable animal hybrids, make your imagination a reality with our /real model.
/hyper - /hyper was built to bridge the gap between digital renders and photo-realism. From detailed 3D renders to lifelike realism, hyper has all the rizz.
/cin - Our cinematic model is trained on rich textures and cinematic lighting. This model is among the first in the world to produce perfect dark, and is capable of stark lighting contrasts. We recommend selecting “wide” image dimensions with /cin for best results.
/art - Our /art model is designed to produce detailed images with a high degree of artistic flair. Include your favorite artist or art style in the prompt for best results.
/ani - A community favorite, /ani is trained on classic anime and produces lush, detailed anime images. Create anime art or bring the waifu of your dreams to life with our /ani model.
/cgi - Derived from our realism training set, /cgi produces highly detailed digital renders with a high degree of prompt responsiveness.
/fur - Fur is trained on classic anime art styles with a furry twist. It can produce anthropomorphic animals, beautiful fursonas, and a range of fictional characters. Be aware, this model can be quite nsfw.
At the time of this post, only /nai, /ani, and /fur have NSFW content generation. /real is coming soon to beta access. It's going to disrupt the adult content industry, imo. Image Generation AI (IMGNAI) is potentially in process of repeating the same type of pattern that happened earlier. Kaspa actually just did something similar as well, infact it overshot. I believe IMGNAI has similar potential.
Should be noted that all altcoins follow a form of the BTC pattern depending on their respective supply ratios.
For example BTC 1M chart next to 1D chart of KASPA
or BTC 1M chart next to 1D chart of IMGNAI
or BTC 1M chart next 2W chart of LTC (LTC had already caught up, soo BTC had to get ahead for it to catch up again, soon that will happen for the CBDC bullrun)
It's all programmed, and the longer BTC exists the harder newer coins with little price history pump; because they have more distance to catch up.
Some background (from their website):
ImgnAI is a crypto-native team with one goal: to build a new leader in consumer AI. We aim to push the boundaries of what’s possible and create products that allow users to have fun while exploring the full range of their imagination.
Our flagship product, Nai, is an AI-powered text-to-image bot that’s currently compatible with Telegram and Discord. We offer seamless UI and 8+ custom image models with ever-increasing quality. Nai allows users to bring their imagination to life regardless of artistic ability.
While we’re initially focused on image generation, ImgnAI is built to be so much more.
In the coming months and years, we’ll drastically expand our image generation tooling and launch new, innovative product verticals in the realm of consumer AI. Our roadmap includes products and key partnerships for crypto-natives and no-coiners alike.
But what does the $IMGNAI token do (from their website):
$IMGNAI TOKEN
$imgnAI is our primary utility token and plays a key role in our growing ecosystem. Soon, the token will be used to unlock premium features (HD/4K resolution, upscaling, NSFW models, etc) and mint user generations directly as NFTs.
Spent tokens across Premium and NFT tooling will be burned, thus deflating the total supply of $imgnAI.
The token will also be given a range of important utilities as we build out our ecosystem and launch new product verticals in the field of consumer AI.
In addition to ecosystem utility, we aim to decentralize governance of imgnAI via the $imgnAI token. Decentralization can be accomplished by providing governance and voting power to $imgnAI stakers as part of the imgnAI DAO operating policies.
We look forward to rolling this out and moving imgnAI toward true decentralization in the future.
At this time, we also offer access to unreleased beta models to those holding at least 100k $imgnAI.
In this way, our stakeholders contribute significantly to the development of new image models and future products.
Summary:
I think it's undervalued at it's present marketcap, and with liquidity from the future listing, and all the updates; and due to it being a solid product; it should be valued at least at 500M - 1.2B+; the pattern says something similar. Price "can" 50x-100x+ or so from here. :O I think it's justifiable to grab a suicide stack of 100,000 IMGNAI.
Website: imgnai.com
Market Cap: $15,471,757
Fully Diluted Valuation: 19,916,443
Circulating Supply: 776,833,333
Total Supply: 1,000,000,000
Max Supply: 1,000,000,000


How can AI help to improve algorithmic trading strategies?AI is transforming the field of algorithmic trading, which involves using computer programs to execute trades based on predefined rules and strategies. AI can help to improve algorithmic trading performance and efficiency by providing advanced data analysis, predictive modeling, and optimization techniques. In this article, we will explore some of the ways that AI can enhance algorithmic trading and some of the challenges and opportunities that lie ahead.
One of the main advantages of AI in algorithmic trading is its ability to process and interpret large and complex data sets in real-time. AI algorithms can leverage various sources of data, such as market prices, volumes, news, social media, sentiment, and historical trends, to identify patterns, correlations, and anomalies that may indicate trading opportunities. AI can also use natural language processing (NLP) and computer vision to extract relevant information from unstructured data, such as text, images, and videos.
Another benefit of AI in algorithmic trading is its ability to learn from data and adapt to changing market conditions. AI algorithms can use machine learning (ML) and deep learning (DL) techniques to train on historical and live data and generate predictive models that can forecast future market movements and outcomes. AI can also use reinforcement learning (RL) techniques to learn from its own actions and feedback and optimize its trading strategies over time.
A further aspect of AI in algorithmic trading is its ability to optimize trading performance and reduce costs. AI algorithms can use mathematical optimization methods to find the optimal combination of parameters, such as entry and exit points, order size, timing, and risk management, that can maximize profits and minimize losses. AI can also use high-frequency trading (HFT) techniques to execute trades at high speeds and volumes, taking advantage of small price fluctuations and arbitrage opportunities. AI can also help to reduce transaction costs, such as commissions, fees, slippage, and market impact, by using smart order routing and execution algorithms that can find the best available prices and liquidity across multiple venues.
However, AI in algorithmic trading also faces some challenges and limitations that need to be addressed. One of the main challenges is the quality and reliability of data. AI algorithms depend on accurate and timely data to perform well, but data sources may be incomplete, inconsistent, noisy, or outdated. Data may also be subject to manipulation or hacking by malicious actors who may try to influence or deceive the algorithms. Therefore, AI algorithms need to have robust data validation, verification, and security mechanisms to ensure data integrity and trustworthiness.
Another challenge is the complexity and interpretability of AI algorithms. AI algorithms may use sophisticated and nonlinear models that are difficult to understand and explain. This may pose a problem for traders who need to monitor and control their algorithms and regulators who need to oversee and audit their activities. Moreover, AI algorithms may exhibit unexpected or undesirable behaviors or outcomes that may harm the traders or the market stability. Therefore, AI algorithms need to have transparent and explainable methods that can provide clear and meaningful insights into their logic and decisions.
However, there are also ethical and social implications of AI in algorithmic trading. AI algorithms may have an impact on the market efficiency, fairness, and inclusiveness. For example, AI algorithms may create or amplify market inefficiencies or distortions by exploiting information asymmetries or creating feedback loops or cascades. AI algorithms may also create or exacerbate market inequalities or exclusions by favoring certain groups or individuals over others or by creating barriers to entry or access for new or small players. Therefore, AI algorithms need to have ethical and social principles that can ensure their alignment with human values and interests.
In conclusion, AI is a powerful tool that can help to improve algorithmic trading strategies and performance by providing advanced data analysis, predictive modeling, and optimization techniques. However, AI also poses some challenges and risks that need to be addressed by ensuring data quality and reliability, algorithm complexity and interpretability, and ethical and social implications. By doing so, AI can create a more efficient, effective, and equitable algorithmic trading environment for all stakeholders.

AI and Algorithmic Trading #1AI and Algorithmic Trading #1 - Introduction to AI and Algorithmic Trading
In recent years, algorithmic trading has become increasingly popular in the world of finance. Algorithmic trading refers to the use of computer programs to automate the trading process, including the analysis of market data, the identification of trading opportunities, and the execution of trades. As algorithmic trading has become more prevalent, artificial intelligence (AI) has emerged as a key tool for traders looking to gain a competitive advantage in the market. In this article, we'll provide an overview of AI and its role in algorithmic trading.
What is Algorithmic Trading?
Before we dive into AI, let's first define algorithmic trading. Algorithmic trading, also known as automated trading or algo trading, is a method of executing trades using computer programs. These programs can analyze market data, identify trading opportunities, and execute trades at a speed and efficiency that is impossible for human traders. Algorithmic trading can be used for a variety of trading strategies, including high-frequency trading, statistical arbitrage, and trend following.
What is AI?
Artificial intelligence refers to the ability of machines to perform tasks that would typically require human intelligence. AI can be divided into several categories, including machine learning, natural language processing, and pattern recognition. Machine learning is a type of AI that involves training algorithms to learn from data, enabling them to make predictions or decisions without being explicitly programmed. Natural language processing involves teaching machines to understand and interpret human language, while pattern recognition involves identifying patterns in data.
Benefits of AI in Algorithmic Trading
One of the key benefits of using AI in algorithmic trading is the ability to make faster and more accurate trading decisions. AI algorithms can analyze vast amounts of market data in real-time, identifying trading opportunities and executing trades with a speed and efficiency that is impossible for human traders. Additionally, AI algorithms can learn from their mistakes and adjust their strategies accordingly, leading to more consistent and profitable trading outcomes.
Challenges of AI in Algorithmic Trading
While the benefits of AI in algorithmic trading are significant, there are also potential challenges associated with this technology. One of the main challenges is the need for high-quality data. AI algorithms rely on large datasets to learn from, and if the data is incomplete or inaccurate, the algorithms may produce flawed results. Additionally, AI algorithms may be subject to biases, both in the data they are trained on and in their decision-making processes. Finally, there are ethical considerations around the use of AI in trading, particularly around the potential for AI to exacerbate market volatility or contribute to systemic risk.
The Future of AI in Algorithmic Trading
Despite these challenges, it is clear that AI will continue to play an important role in algorithmic trading in the years to come. As the technology continues to develop, we can expect to see even more sophisticated AI algorithms being used to analyze market data, identify trading opportunities, and execute trades. Additionally, we may see new applications of AI in areas such as risk management and portfolio optimization.
Conclusion
In conclusion, AI is an increasingly important tool for traders looking to gain a competitive advantage in the world of algorithmic trading. By using AI algorithms to analyze market data and make trading decisions, traders can operate with a speed and efficiency that is impossible for human traders. However, there are also potential challenges associated with using AI in trading, including the need for high-quality data and ethical considerations. As the technology continues to develop, we can expect to see even more sophisticated applications of AI in the world of algorithmic trading.

Trade talk with A.IQ1. Your Advise to the experienced traders.
As an AI language model, I cannot provide personalized advice to specific individuals. However, here are some general tips that experienced traders may find useful:
1.1 Stick to your trading plan: Experienced traders know the importance of having a solid trading plan and sticking to it. Your trading plan should include your risk management strategy, entry and exit points, and profit targets. Avoid deviating from your plan based on emotions or market noise.
1.2 Continue learning: The markets are constantly evolving, so it's important for experienced traders to continue learning and adapting to changes. Stay updated with market news and events, learn new trading strategies, and be open to new ideas and perspectives.
1.3 Practice good risk management: Experienced traders understand the importance of managing risk. Make sure you understand risk management principles and use tools like stop-loss orders and position sizing to limit your risk.
1.4 Stay disciplined: Trading can be a stressful and emotional experience, but experienced traders know the importance of staying disciplined and keeping their emotions in check. Stick to your trading plan, avoid impulsive decisions, and don't let fear or greed drive your trading decisions.
1.5 Review and analyze your trades: Successful traders are always looking for ways to improve their performance. Take the time to review and analyze your trades, identify areas for improvement, and make adjustments to your trading plan as necessary.
Q2. How to trade Head and shoulder patterns?
2.1 The head and shoulders pattern is a technical analysis pattern that is commonly used by traders to identify potential trend reversals. Here are the basic steps for trading a head and shoulders pattern:
2.2 Identify the pattern: The head and shoulders pattern consists of three peaks, with the middle peak (the "head") being higher than the other two (the "shoulders"). The neckline is a line that connects the lows between the shoulders.
2.3 Wait for confirmation: Once you have identified the pattern, wait for a confirmed breakout below the neckline. This confirms that the pattern is valid and increases the probability of a trend reversal.
2.4 Set a stop-loss: Place a stop-loss order above the right shoulder of the pattern to limit your risk if the market moves against you.
2.5 Set a profit target: Calculate the distance between the head and the neckline, and use this to set a profit target for your trade.
2.6 Monitor the trade: Monitor the trade closely and adjust your stop-loss and profit target as necessary.
Q3. Do people get rich day trading?
While it is true that some traders have become wealthy from trading, it is important to understand that trading is not a guaranteed path to riches. Trading involves risk, and losses are a natural part of the process. In fact, the majority of traders lose money, and only a small percentage are consistently profitable over the long term.
Furthermore, becoming a successful trader requires a significant amount of time, effort, and dedication. It's not something that can be achieved overnight, and there are no shortcuts or easy solutions.
In addition, it's important to have realistic expectations about trading. While it is possible to make money from trading, it is not a get-rich-quick scheme. Successful traders typically have a long-term perspective, and they focus on building consistent profits over time.
In summary, while trading can potentially lead to wealth, it is not a guaranteed path to riches. Trading involves risk, requires a significant amount of time and effort, and success is not guaranteed. As with any other profession, success in trading requires hard work, dedication, and a commitment to ongoing learning and improvement.
Q.4 Can you help someone to become a profitable trader?
As an AI language model, I can provide educational information and guidance to help someone become a profitable trader. However, becoming a profitable trader requires more than just information and guidance - it requires a combination of knowledge, experience, discipline, and a commitment to ongoing learning and improvement.
Some of the ways in which I can help someone become a profitable trader include:
4.1 Providing educational resources on trading fundamentals, technical analysis, risk management, and other key trading concepts.
4.2Assisting with the development of a personalized trading plan based on an individual's unique goals, risk tolerance, and trading style.
4.3 Offering insights into market conditions and potential trading opportunities across a range of asset classes.
4.4 Providing support and guidance on managing emotions and maintaining discipline in the face of market volatility and uncertainty.
4.5 Offering feedback and analysis on trading strategies and performance, with a focus on identifying areas for improvement and optimization.
4.6 It's important to note that becoming a profitable trader is a long-term process that requires patience, discipline, and a willingness to learn from both successes and failures. With the right guidance and approach, however, it is possible to achieve consistent profitability and success in the markets.
Q5. Do prayers help in trading?
As an AI language model, I do not have a religious belief, but I can provide a general response to your question.
Prayer is a personal spiritual practice that may bring comfort and guidance to an individual. However, it is not a guaranteed method for achieving success in trading or any other activity. Trading success depends on a combination of factors, including knowledge, experience, discipline, and a sound trading strategy.
It's important to approach trading with a rational and analytical mindset, rather than relying on external factors such as prayer or luck. While prayer may provide emotional support and help manage stress, it is not a substitute for a well-developed trading plan and disciplined approach to the markets.
In summary, while prayer may have personal and emotional benefits, it is not a reliable or effective means for achieving success in trading. A disciplined and rational approach to trading, based on sound principles and a well-developed trading plan, is key to long-term success.
Q6. How to trade triangle pattern?
The triangle pattern is a common chart pattern that occurs when the price of an asset consolidates between two converging trendlines. Trading the triangle pattern involves identifying the breakout direction and taking a position in that direction. Here are some general steps to trade the triangle pattern:
6.1 Identify the triangle pattern: Look for a period of consolidation where the price moves between two converging trendlines, forming a triangle shape on the chart.
6.2 Determine the direction of the breakout: As the price nears the apex of the triangle, it will typically break out in one direction or the other. Look for a breakout that is accompanied by high volume and follow-through price action.
6.3 Enter a position: Once you have determined the direction of the breakout, enter a position in that direction. This can be done through buying or selling, depending on whether the breakout is to the upside or downside.
6.4 Set stop-loss and take-profit levels: It's important to manage your risk by setting stop-loss levels to limit potential losses and take-profit levels to lock in profits. These levels should be based on your risk tolerance and trading strategy.
6.5 Monitor the trade: Keep an eye on the price action after the breakout to ensure that it continues to move in your favor. If the price fails to continue in the breakout direction, it may be wise to exit the trade with a small loss.
6.6 Consider other factors: It's important to consider other factors, such as market conditions and economic events, that may affect the price of the asset. This can help you make more informed trading decisions.
In summary, trading the triangle pattern involves identifying the breakout direction and taking a position in that direction while managing risk through stop-loss and take-profit levels. However, it's important to consider other factors that may affect the price of the asset and to monitor the trade closely to ensure that it continues to move in your favor.

INTUSDT technical Analysis From technical analysis wise, a clear breakout from a falling wedge on W & 3D frames, it is retesting, I think it will make 10x from here.
According to INTchain twitter account: “The INT Chain Foundation officially announced that it will conduct in-depth research and expansion on AIGC and ChatGPT related technologies, with an ever-changing pace, profoundly, quickly, and thoroughly changing the existing IoT chain model.”
That’s BULLISH but you need to keep in mind the following.
1- It’s a small cap project with huge potential but with a low liquidity “ manage your risks”
2- Take profit along the way and enjoy.
Good luck

ANSS AnSys The Software Simulation Engine For Everything AI Ansys, Inc. is an American company based in Canonsburg, Pennsylvania. It develops and markets CAE/multiphysics engineering simulation software for product design, testing and operation and offers its products and services to customers worldwide.
Opening positions under $220 and attempting to hold for $300


Agix - Uptrend channelAgix is in a bullish channel showing signs of the start of a new bullish leg, we have a good technical stop at the bottom of 0.446.
Overall we have bitcoin recovering quickly from yesterday's low and bitcoin dominance losing steam.
Price: 0.499
Initial target: 0.64603 (29%)
Stop: 0.44615 (10.5%)
Volume: 6.66%

Intraday ES 22nd March - Gamma + Options + Darkpool analysisGEX: Positive
Price above Gamma Flip Point - decreased Volatility
Structure of Gamma: Mostly negative, spread across multiple strikes
Expected Range: 3991 - 4077
Most probable end-of-day outcome: Price close above most negative gamma spikes (3990, 3940, 3840). Therefore Key Support is at 3940.
Gamma Spikes chart from my AI Data Analysis software
Yesterday's session was skyrocketing and honestly despite observing incoming Supply to the market near Resistance, price reacted weak to this area and after couple of hours continued to increase. As the result, we fulfilled most probable end-of-day outcome, but plan wasn't met accordingly to my expectations. Well, this is market magic 🙂
For today's session, we have similar expected end-of-day outcome where Support at 3940 is below bottom level of expected trading range at 3991. In general, on 3990 we see gamma spike, so this level works as significant support too. After climbing up, any supports are much lower than level of current price so seems the market can start shifting into Bullish sentiment. It's too early to confirm that, but something is happening. Let's keep observing.
From Resistance perspective, we have spike at 4040. Plan for today's trades I marked on second chart attached to analysis. Good luck!

The End of an Era: Is Google's Reign Over?I believe that right now is an incredible time to short googles stock, The challenges facing it over the next few years could topple its position as an industry leader.
Current price: 105.35
Target 1: 90.55 (-14%)
Target 2: 74.50 (-29%)
The regulatory scrutiny that Google is facing is a significant threat to the company's future. If the company is found guilty of antitrust violations, it could face substantial fines and restrictions on its business practices, which could lead to a loss of market share and revenue. Moreover, the negative publicity generated by these investigations could harm Google's brand image and reputation.
In addition to regulatory scrutiny, Google is also facing increased competition from Microsoft's backed venture OpenAI. OpenAI is a major player in the artificial intelligence (AI) space, and is rapidly expanding its capabilities in natural language processing, computer vision, and other areas. As Google relies heavily on AI for many of its products and services, such as search and Google Assistant, increased competition in this area could pose a significant threat to the company's market position.
These challenges have already had an impact on Google's stock price, which has fallen from its all-time high of $150.70 in November 2021 to its current level of $105.30. This decline is likely due in part to concerns about regulatory scrutiny and competition from OpenAI.
Looking ahead, it is difficult to predict with certainty what the future holds for Google. However, it is clear that the company will need to address the regulatory concerns and navigate the increasingly competitive landscape if it hopes to maintain its market position and continue to grow. If it can successfully address these challenges and continue to innovate and adapt, Google could emerge from this period of uncertainty even stronger than before. However, if it fails to do so, its stock price could continue to decline, and its market position could be threatened.
