Intelligent Moving Average (AI)Introduction
This indicator uses machine learning (Artificial Intelligence) to solve a real human problem.
The Moving Average is the most used indicator on the planet, yet no one really knows what pair of moving average lengths works best in combination with each other.
A reason for this is because no two moving averages are always going to be the best on every instrument, time-frame, and at any given point in time.
The " Intelligent Moving Average " solves the moving average problem by adapting the period length to match the most profitable combination of moving averages in real time.
How does the Intelligent Moving Average work?
The artificial intelligence that operates these moving average lengths was created by an algorithm that tests every single combination across the entire chart history of an instrument for maximum profitability in real-time.
No matter what happens, the combination of these moving averages will be the most profitable.
Can we learn from the Intelligent Moving Average?
There are many lessons to be learned from the Intelligent Moving Average. Most will come with time as it is still a new concept.
Adopting the usefulness of this AI will change how we perceive moving averages to work.
Limitations
Ultimately, there are no limiting factors within the range of combinations that has been programmed. The moving averages will operate normally, but may change lengths in unexpected ways - maybe it knows something we don't?
Thresholds
The range of moving average lengths is between 5 to 40.
Additional coverage resulted in TradingView server errors.
Future Updates!
You can find this indicator in the Indicator Library above your chart, forever!
Soon, I will be publishing tools to test the AI and visualise what moving average combination the AI is currently using.
View the videos that preceded this post here:
Artificial_neural_networks

Wild A.I. Forecast & TA Say_________?Bitcoin/USD Daily Bars, LOG Scale, 06/12/18, 11:10 PM EST, by Mike Mansfield
(REDONE SO CYCLES FIT)
Hi trader friends, this is one of our most detailed and important Bitcoin updates. Our first post with screenshots of our deep learning A.I. project’s 12 month forecast. I will post those screenshots after this clears the 15 minute publishing hold. So let’s get to it.
SUMMARY:
BTCUSD is likely to drop another 30-60% over the next 4-12 months, possibly 18 months.
Short-term cycle lows are expected in July and October 2018.
The mid-July 2018 cycle low should be followed by a 3-8 week trading bounce. Then, another big down wave into early to mid October 2018.
October could be “the low,” but we are thinking next year, based on our data.
The final cycle low, or momentum lows are expected to be in February 2019 (A.I. low date), or June 9th, 2019 (pink cycle low), or possibly January 2020 (blue cycle low).
Initial price targets lower are $4935, then $2967-2380 (or lower).
A.I. project forecasts 12 month low @ $2774, due in February 2019.
The deep learning A.I. project’s forecast is confirmed by Elliott Waves, Andrews Lines, Wolfe Waves, and a few other techniques shown here, most suggesting much lower prices ahead.
Bitcoin has broken its “low to low” support trend-line.
Will likely close below the Andrews Median Line (orange pitchfork's mid line), which, would put Bitcoin below the black dotted trend-line drawn off the lowest closing prices of 2018. Once broken, the first three price targets to the downside become quite likely.
Time Cycle Caveat:
We are working on pattern matching comparison called an analog. This suggests an October 2018 low. That fits the secondary A.I model's forecast, but not the top performing algorithm's forecast (February 2019 low). Remember, two of the longer-term cycles are pointing to either a June 2019 low (pink cycle), or January 2020 low (blue cycle). Therefore, the October low this year seems less likely thus far, but not out of the question.
Truth Seekers & The Crypto Land Bear:
Are you a “truth seeker?" Really a truth seeker? If you want to be a more objective trader, be a truth seeker. Try to be a truth seeker in all things. Accept that there are many possibilities in life, as in trading. Seek to find the ultimate “truth," but while doing it, at least for trading, go with the highest probabilities. Else, you'll live in La La Land of wannabe moonshots for every crypto market. Of course, some tokens moonshot, even in a bear market. But, as the top 10-25 go, so goes most of the market.
PRICE TARGETS:
Target 1: $4935, likely minimum target. It's the prior Wave (3) high on Sept 1st, 2017.
The “forever trend-line” (black upward sloping) is currently around $3700. Yet, by the time the market could logically get there, that trend-line would likely be around $4450-$4950.
Target 2: $2972, the June 2017 high of the prior Wave V of Wave (3). This is close to our
A.I. derived target. Outcome, likely.
Target 3: $2774, A.I. deep learning 12 month projected low, due February 2019.
Since target 2 and 3 are so close, just a blip in Crypto Land, I would be targeting a low between those two figures, unless more data changes the A.I. forecasts. Target, likely.
Target 4: $2380, September 15th, 2017, Wave ii low.
Target 5: $1138, where the Wolfe Wave support (purple line) and the prior Wave ( III) high of large degree meet. This is a potential attractor point (less likely now). There is a far lower target, but I'll let you find it on the chart.
----------
The good news for bulls is that the Alternative Wave Count (lighter blue) could very well be correct. That would mean one more all-time high to complete Bitcoin’s Wave (V) advance.
BOTTOM LINE:
Down 30-60%, Feb. or June low, around $2774.
DISCLOSURE:
This analysis is meant for educational purposes only. You trade at your own risk!
Cheers and best wishes,
Michael Mans

BTC/USD (Bitcoin) Wild A.I. Forecast & TA Say_________?Bitcoin/USD Daily Bars, LOG Scale, 06/12/18, 9:00 PM EST, by Mike Mansfield
Hi trader friends, this is one of our most detailed and important Bitcoin updates. Our first post with screenshots of our deep learning A.I. project’s 12 month forecast. I will post those screenshots immediately after this clears the 15 minute publishing hold. So let’s get to it.
BOTTOM LINE:
BTCUSD is likely to drop another 30-60% over the next 4-12 months, possibly 18 months.
Short-term cycle lows are expected in July and October 2018.
The mid-July 2018 cycle low should be followed by a 3-8 week trading bounce. Then, another big down wave into early to mid October 2018.
October could be “the low,” but we are thinking next year, based on our data.
The final cycle low, or momentum lows are expected to be in February 2019 (A.I. low date), or June 9th, 2019 (pink cycle low), or possibly January 2020 (blue cycle low).
Initial price targets lower are $4935, then $2967-2380 (or lower).
A.I. project’s 12 month low price forecast's is $2774, due in February 2019.
The deep learning A.I. project’s forecast is also confirmed by Elliott Waves, Andrews Lines, Wolfe Waves, and a few other techniques shown here, most suggesting much lower prices ahead.
Bitcoin has broken its “low to low” support trend-line. It also appears to on its way to closing below the Andrews Median Line (orange pitchfork's mid line), which, would put Bitcoin below the black dotted trend-line drawn off the lowest closing prices of 2018. Once broken, the first three price targets to the downside become quite likely.
Time Cycle Caveat:
We are working on pattern matching comparison called an analog. This also suggests an October 2018 low. That fits the secondary A.I model's forecast, but not the top performing algorithm forecast that calls for a February 2019 low. And remember, two of the longer-term cycles are pointing to either a June 2019 low (pink cycle), or January 2020 low (blue cycle). Thus, the October low this year seems less likely thus far, but not out of the question.
Truth Seekers & The Crypto Land Bear:
Are you a “truth seeker?" Really a truth seeker? If you want to be a more objective trader, be a truth seeker. Try to be a truth seeker in all things. Accept that there are many possibilities in life and in trading. Seek to find the ultimate “truth," but while doing it, at least for trading, go with the highest probabilities. Else, you'll live in La La Land of wannabe moonshots for every crypto market. Of course, some tokens will moonshot, even in a bear market, but as the top 10-25 go, so goes most of the market.
PRICE TARGETS:
Target 1: $4935, likely minimum target. It's the prior Wave (3) high on Sept 1st, 2017.
The “forever trend-line” (black upward sloping) is currently around $3700, but by the time the market could logically get there, that trend-line would likely be around $4450-$4950.
Target 2: $2972, the June 2017 high of the prior Wave V of Wave (3). This is close to our A.I. derived target. Likely.
Target 3: $2774, A.I. deep learning 12 month projected low for February 2019. Since target 2 and 3 are so close, just a blip in Crypto Land, I would be targeting a low between those two figures, unless more data changes the A.I. forecasts. Target, likely.
Target 4: $2380, September 15th, 2017, Wave ii low.
Target 5: $1138, where the Wolfe Wave support (purple line) and the prior Wave (III) high of large degree meet. This is a potential attractor point (less likely now). There is a far lower target, but I'll let you find it on the chart.
----------
The good news for bulls is that the Alternative Wave Count could very well be correct. That would mean one more all-time high to complete Bitcoin’s Wave (V) advance.
Summary:
Down 30-60%, Feb. or June low around $2774.
DISCLOSURE:
This analysis is meant for educational purposes only. You trade at your own risk!
Cheers and best wishes,
Michael Mansfield CIO

Machine Learning / AI for investing in Cryptocurrencies?Consensus 2018 was supposed to be a week that generated price support for cryptocurrencies, yet the market has been declining since hitting a peak on May 5th. The total market cap for cryptocurrencies reached ~USD$470bn on May 5th and has declined by 30% to ~USD329bn. Bitcoin traded as high as ~USD$9,930 on May 5th and currently trades at ~USD$7,520. News sentiment has been quite positive with many notable developments including: Bitcoin’s lightning network obtaining 2,000 nodes, eToro expanding to the US, and the ability for users to monetize their data using blockchain technology.
Perhaps it may be best for investors to diversify their Crytpo exposure by minimizing tail risk and optimizing for low volatility in this type of environment. For traders, it may be better to have signals based on machine learning & AI rather than technical analysis to make Buy or Sell decisions for short term trading opportunities.

V 10-Day-Ahead Prediction - 04/11-04/24 PeriodArtificial Intelligence/Deep Learning Enabled 5 Day Ahead Predicted values for Visa Inc. ( V ) have been plotted on the chart.
The method used in this prediction is Deep Learning based, and using complex mathematical models/methodologies to extract hidden time series features in vast amounts of V related data.
The expected 5 Day Change is 0.817 %
The expected 10 Day Change is 1.310 %
Predictability Indicator is calculated as : 0.806
Predicted 10-Day Ahead Prices are as follows:
Wed Apr 11 Thu Apr 12 Fri Apr 13 Mon Apr 16 Tue Apr 17
122.15 122.37 122.06 121.78 121.70
Wed Apr 18 Thu Apr 19 Fri Apr 20 Mon Apr 23 Tue Apr 24
121.80 121.94 122.08 122.20 122.30
Please note that outliers/non-linearities might occur, however our Artificial Intelligence/Deep Learning Enabled predictions indicate the softened/smoothed moving direction of the stocks/commodities/World indices/ETFs/Foreign Currencies/Cryptocurrencies.
Feel free to contact us for your questions.

ETH-USD 10-Day-Ahead Prediction - 03/30-04/08 PeriodAI/Deep Learning Enabled 10 Day Ahead Predicted values have been plotted in CYAN on the chart.
You can also see our previous prediction which has been posted 3 days ago on the same chart in YELLOW.
The expected 5 Day Change is 1.095 %
The expected 10 Day Change is 0.747 %
Predictability Indicator is calculated as : 0.687
Predicted 10-Day Ahead Prices are as follows:
400.223466218682,397.35307414183,396.759068590247,398.713502900275,401.780966089707,404.405670103772,406.095951706524,407.245850036739,408.341186771097,409.415134372872

BTC Estimates Based On My Latest AI ForecastsThis chart is a rough drawing of what my latest neural network model predictions are showing for Bitcoin.

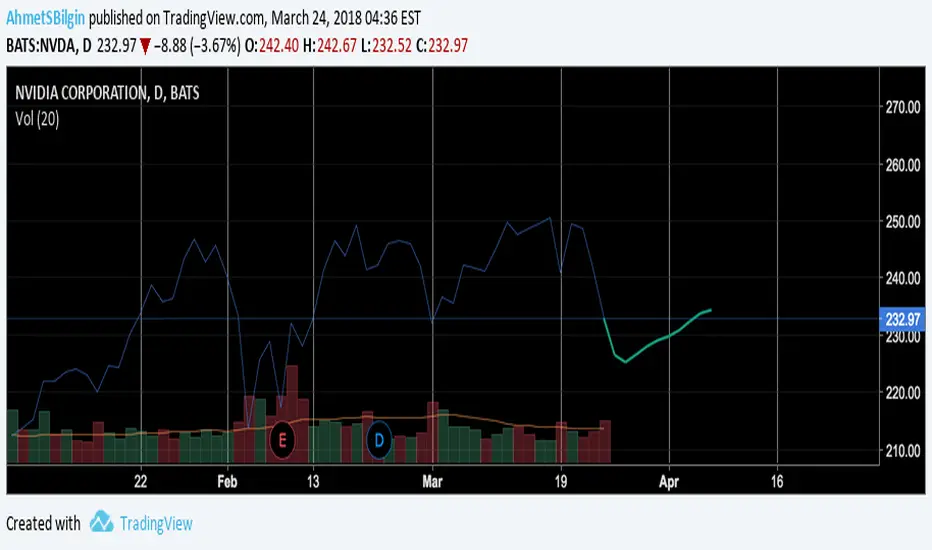
NVDA 10-Day-Ahead Prediction - 26.03-06.04 Period10 Day Ahead Predicted values have been plotted on the chart.
The expected 5 Day Change is -1.661%
The expected 10 Day Change is 0.6211%
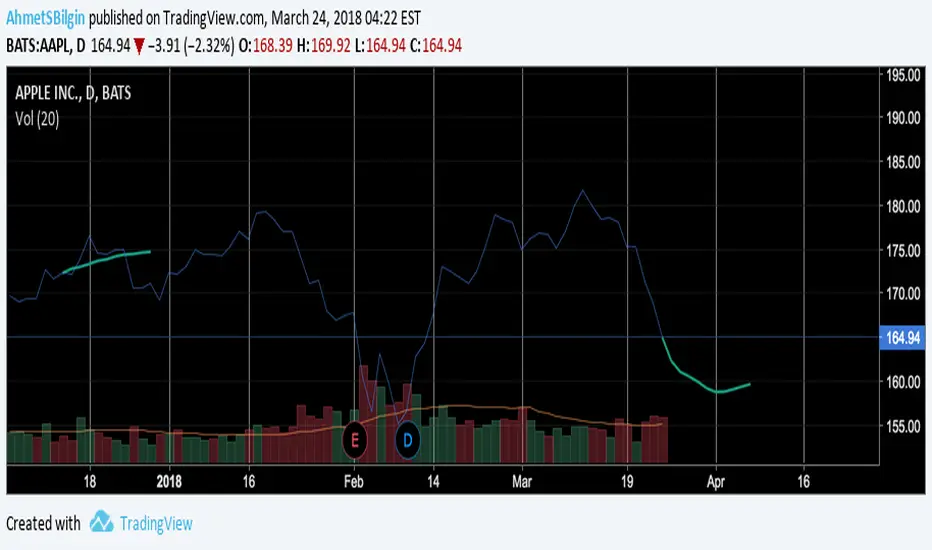
Apple Inc. 10-Day-Ahead Prediction - 26.03-06.04 Period10 Day Ahead Predicted values have been plotted on the chart.
The expected 5 Day Change is -3.488%
The expected 10 Day Change is -3.214%
You can see our previous prediction on the same plot as well ;)
General Electric 10-Day Ahead Prediction - 26.03-06.04 Period10 Day Ahead Predicted values have been plotted on the chart.
The expected 5 Day Change is -2.638%
The expected 10 Day Change is -5.663%

EURUSD , D --- SHORT --- range 1.2520 to 1.2600 -- AI ModelsLooks good to me for a SHORT , Let's go hunting . Don't bring a Gun in tank battle !!!
Go Short: Range 1.2520 to 1.2600
TakeProfit 1: 1.2300
TakeProfit 2: 1.2200
TakeProfit 3: 1.2080
StopLoss : 1.2900
Then expect a rally after the pullback . The Angle of momentum at the moment is too extreme to be sustained and a strong EURO would kill the Euro Economies which are fragile at the moment. Look at the chart it speaks for itself.
All major US , European and Asian banks have forcast for EURUSD to be around 1.2500 to 1.2700 at the end of 2018 not within 1 month of 2018. I suspect a carnage in the EURUSD market is about to happen before we see a sustained rise of the EURUSD.

DXY -- Dollar Index -- LONG -- Anywhere below 88.00 What is going on between this love relationship between the US Dollar index and the EURUSD. As you know US Dollar Index consists of upto or about 57% of EURO currency in weighting depending on which formula you are using. So any disease that USD catches will affect the EURUSD a great deal. Right now Mr. US has " syphilis " and Lady EURO does not want anything to do with him. She is running as fast as she can but for how long ? Anyway this relationship is complicated ? Mr. US needs a Doctor really fast.
Below 87.00 then the rest of the world starts feeling the heat on their currencies being to strong against the US and that's bad for Trade. They need weaker currencies against the USD to sell within US Economy and make profits.
We are all drunk with this cheap USD being offered but for how long ? somebody has to pay the price finally . Anyone ?
Go LONG: --- Anywhere below 88.00 but remember he is suffering from "Syphilis" , be careful .
TP: --- I will leave this to you , but it will be a long run once it starts. Get yourself a Bugatti Chiron and put your seat belts on , its going to be bumpy ride since somebody or one of the major Players ( Banks or Hedge Funds with Fat Clients ) is juicing the pump or protecting a loaded options bet for EURUSD at around 1.2000 and also above 1.2700 . Once those expire , then its decision time.

Time to Buy Altcoins with Crypto Regulation News Overseas?Investors seems to fearful of Regulators limiting Cryptocurrency access in China, Japan, & South Korea
Stellar has experienced quite a run up with a top coming around the $.90 level and support found at the $.57 level.
News from overseas may test the support with the 200-Day MA already broken & price action closing in on the 100-Day
What if traders could receive Machine Learning Buy/Sell signals that on a daily & weekly schedule to help with their Crypto decisions?
We think its a great time to move into that direction!

EURUSD Deep Mind Prediction 1/3/2018This Prediction is a result of a Deep Neural Network prediction.
Follow me for updates.
