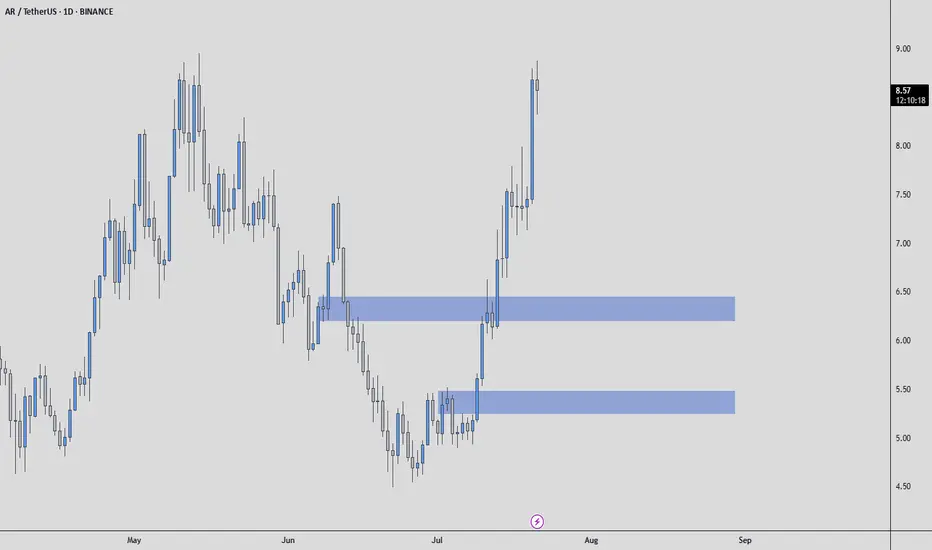
ARUSDT Mid-Term AnalysisIt made a nice rise, but I’m waiting for price in the blue boxes I’ve marked.
I won’t chase it at high prices.
If price comes to my levels, I’ll watch for:
✅ Footprint absorption
✅ CDV support
✅ Structure reclaim
If these align, I’ll consider a trade with clear risk. If not, I’m fine staying out.
Patience over chasing. The right price, or no trade.
ARUSDT
ARUSDT Forming Descending ChannelARUSDT is showing a promising setup as it begins to break out of a clear descending channel pattern on the daily timeframe. The current chart indicates strong potential for a bullish reversal, with price action approaching key breakout levels supported by healthy trading volume. This technical formation suggests that buyers are starting to regain control after an extended correction, making ARUSDT one to watch closely for the next big move.
With a projected gain of around 90% to 100%+, the risk-to-reward ratio for ARUSDT looks highly favorable. This setup aligns well with broader market sentiment, where investors are rotating back into altcoins that show strong recovery potential. As ARUSDT pushes against the upper trendline of its channel, confirmation of a breakout could lead to a powerful rally that targets previous highs, giving traders a clear upside objective.
In addition to the technical pattern, the volume profile for ARUSDT remains supportive, indicating growing investor interest and participation. This surge in trading activity often precedes sustained moves, as more market participants add to positions once key resistance levels flip to support. The combination of strong volume and a bullish channel breakout is a classic setup for momentum traders.
Overall, ARUSDT stands out as a well-positioned crypto pair for traders looking to capture a mid-term trend reversal. Keeping an eye on breakout confirmation and subsequent retests will be key for maximizing profit potential. With momentum building, this pair could deliver significant returns in the coming weeks if market conditions stay supportive.
✅ Show your support by hitting the like button and
✅ Leaving a comment below! (What is You opinion about this Coin)
Your feedback and engagement keep me inspired to share more insightful market analysis with you!

AR Looks Bullish (1D)The AR symbol appears to be completing a double corrective pattern | the first part being a plapyonic diametric and the second part a flat. The green zone represents a demand area that could potentially push the price upward. Note that this type of setup is generally safer for spot trading, while futures trading would require more precise entry levels.
Targets are marked on the chart.
A daily candle closing below the invalidation level will invalidate this analysis.
For risk management, please don't forget stop loss and capital management
Comment if you have any questions
Thank You

Arweave—Bullish Bias Confirmed (Altcoins Bull Market As Promise)Three weeks ago I told you a very strong bullish wave was approaching the altcoins market. It is here, confirmed. The rest is just too easy...
Tell me... Can you see this?
Tell me you can see this. I know you can.
Tell me you can see the end of a correction, the bearish wave.
On the 5th of June the market was supposed to move up. It started up and went up for five days. 11-June produced a major crash rather than a bullish continuation... Surprise! but the market never moves straight down, this was the final leg down; the bottom is in, we can change trend now.
Technically speaking, the 7-April bottom-low holds. We have a double-bottom situation.
The low in April led to growth. This time around we have a slightly lower low with a bullish signal coming from the last candle that closed, a reversal candle. We also have a bullish chart pattern and marketwide action; it is very early of course. I am always early because I look 24-7 at the charts.
We have first a bottom and then a double-bottom after a little more than two months. This is it. Bear volume continues to drop and has been dropping since late 2024. This means that the bearish force has been exhausted, fully exhausted. Even the latest low yesterday has lower volume than the previous lows.
This is it. The bullish bias is now fully confirmed.
We won't have to wait long. It will be clear based on price action.
Thanks a lot for your continued support.
Namaste.

ARUSDT 5D AnalysisAR ~ 5D Analysis
#AR This is the lowest support for now. Buy back from here with a short term target of at least 15%++ from this support.

ARUSDT 1D AnalysisAR ~ 1D Analysis
#AR Buy on retest of this support block with short term target of at least 10%+ from here.

#AR/USDT#AR
The price is moving within a descending channel on the 1-hour frame and is expected to break and continue upward.
We have a trend to stabilize above the 100 moving average once again.
We have a downtrend on the RSI indicator that supports the upward move with a breakout.
We have a support area at the lower boundary of the channel at 7.00, which acts as strong support from which the price can rebound.
Entry price: 7.14
First target: 7.30
Second target: 7.60
Third target: 8.00

AR/USDT : FREE SIGNALHello friends✌
You see that after the price growth we had, we entered a correction, which provided us with a good opportunity to buy📈
We have identified the buying levels and targets for you to buy...
Don't forget capital management, friends.
*Trade safely with us*

AR Trade Setup – Watching for Market Structure ShiftAR is showing early signs of strength after defending the $5 key level a crucial support that bulls needed to hold. Now, the focus is on a potential shift in market structure around $6, which could lead to a strong upside move.
📍 Entry Zone:
Enter around $6 after confirmation (e.g., reclaim with strong volume or bullish candle close)
🎯 Take Profit Targets:
🥇 $12
🥈 $16
🥉 $22
🛑 Stop Loss:
Below $5

TradeCityPro | AR: Key Triggers in Web3 Storage Coin’s Downtrend👋 Welcome to TradeCity Pro!
In this analysis, I want to review the AR coin for you. This project is one of the Storage and Web3 platforms, and the coin of this project, with a market cap of $352 million, is ranked 124th on CoinMarketCap.
⏳ 4-Hour Time Frame
In the 4-hour time frame, as you can see, this coin is in a downtrend, and in its latest leg, after being rejected from the 7.70 top, it started to drop, and this decline continued down to the 4.78 zone.
✔️ Currently, the price has retraced to the 0.382 Fibonacci level and has created a range box between 4.78 and 5.65. A break of this box can determine the trend of this coin for the coming days or even weeks.
✨ The SMA99 indicator has so far acted well as a dynamic resistance, and within the current box, the price has already reacted to it once and is now again pulling back to this moving average.
💥 If the price is rejected from this indicator and forms a lower high than 5.65, the probability of breaking the 4.78 bottom increases significantly, and the price could move toward lower lows.
⚡️ The 4.78 support is actually a support range between 4.78 and 4.92, and to confirm a bearish move, the risky trigger is 4.92, and the main trigger is 4.78.
🔼 For a long position or spot buy, we should first wait for the SMA99 to break and for the 5.65 zone to activate. The break of this zone would be the first confirmation of a trend reversal, and the main confirmation would come after the price makes a higher low and higher high above the 5.65 zone.
🎲 The main resistance levels above this area are the 0.5, 0.618, and 0.786 Fibonacci levels. Another key resistance is the 7.70 zone.
📝 Final Thoughts
This analysis reflects our opinions and is not financial advice.
Share your thoughts in the comments, and don’t forget to share this analysis with your friends! ❤️

ARUSDT 5DAR ~ 5D Analysis
#AR Buy back while visiting this support with a short -term target of at least 15%+.

Trading opportunity for ARUSDTBased on technical factors there is a Buy position in :
📊 ARUSDT
🔵 Buy Now
🪫Stop loss 5.950
🔋Target 7.250
📏 R/R 1,5
💸RISK : 1%
We hope it is profitable for you ❤️
Please support our activity with your likes👍 and comments📝

Rebuy Setup for AR (3D)From the point where we placed the red arrow on the chart, the AR correction seems to have begun.
It now appears to be in wave C of the corrective pattern. The green zone is where the bearish wave C could potentially end.
A daily candle close below the invalidation level will invalidate this analysis.
For risk management, please don't forget stop loss and capital management
Comment if you have any questions
Thank You

ARUSDT 5DAR ~ 5D Analysis
#AR If you still have a Conviction on this Coin, Maybe this support block you can consider to start buying again from here.

AR DAY TRADE!! (TALK ON BUSINESS OUTSIDE)BYBIT:ARUSDT.P
Yo I'm back with a mini-investment I'm going to go with this support zone the charts are at.. I've let it leak down at little to grab a bigger return. Otherwise, nothing else to report on.. ACTUALLY (yea I'm going to type on here like I'm talking because that's what I do) My wife and I have just purchased a commercial unit and are moving our detailing business into it this week! something exciting to look forward to and new adventures ahead!
Its not all about charts, We got business outside too.

ARUSDT: Major Move Incoming? Don’t Get TrappedYello, Paradisers! Is ARUSDT setting up for a big reversal, or are we about to see another wave of panic selling? Let’s break it down.
💎ARUSDT has been in a healthy retracement, forming a falling wedge pattern—a classic bullish reversal structure. Right now, the price is approaching a key support zone and the lower trendline of the wedge. This increases the probability of a bounce, but we need confirmation before taking any action.
💎Bullish I-CHoCH, W pattern, or an inverse head & shoulders on lower timeframes—these signals will strengthen the bullish case.
💎If price drops further due to panic selling, the next strong support zone will be critical. Again, we’ll wait for the same bullish reversal signs before making any moves.
💎However, if ARUSDT breaks down and closes candle below the strong support zone, it invalidates the bullish idea. In that case, we step back and wait for better price action before considering any entries.
🎖 Patience is key, Paradisers. Trading is not about guessing—it's about waiting for high-probability setups and executing with discipline. The market will reward those who wait for confirmation, while those who rush in will pay the price. Be the trader who plays it smart!
MyCryptoParadise
iFeel the success🌴

ARUSDT 5DAR ~ 5D Analysis
#AR If you still have a Conviction on this coin,. Buy from here with a minimum target of 20%++

$AR - Last Chance or Is It Over?I’ve been stopped out twice due to previous failed breakouts. This time, I’m buying at a key macro level.
The plan is to stay above $12 through January and potentially target above $50.
Good level for me to position for now.
BINANCE:ARUSDT

ARUSDTThis is a long-term analysis.
To buy spot and medium term..
We may experience strong negative fluctuations, but it is worth the risk.
The numbers 11.5 to 12.5 dollars and 8.5 to 10 dollars are attractive prices to buy..
It is better to look at this purchase as a short-term investment.
Important trading times and nodes for the end of wave B and the beginning of wave C were determined..

Arweave ($AR) Reversal in Play: Eyeing $60!BINANCE:ARUSDT (Arweave) is showing signs of a potential reversal after the week of November 4th. While I’m a bit late to the entry, I’m watching for an optimal entry point to capitalize on potential upside.
Strategy:
Entry Point: Looking to enter below $22
Confirmation: I plan to buy on a weekly close above $23.4. This would confirm the reversal and suggest stronger upward momentum.
Target Price: Aiming for $60 in the medium-to-long term, should the bullish momentum continue.

ARUSDT 1WAR ~ 1W
#AR If you still have Conviction on this coin,. Buy gradually within this support block,. with a short term target of at least 20%++

ARUSDT: Potential Support at the Blue BoxesIn this analysis, the blue boxes are highlighted as critical support areas to monitor. These zones are noteworthy because:
They serve as demand areas, where buying pressure could emerge.
They act as the first line of defense, potentially preventing further downward movement.
Trading Strategy
Lower Time Frame Reactions: Pay close attention to how the price behaves within the green lines and blue box zones. Look for signs of bullish momentum, such as candlestick reversals or increased buying volume.
Long Trade Opportunities: If favorable reactions are observed, traders can structure long trades with clear risk management, using the lower time frame signals for precise entry points.
Summary
The blue boxes in ARUSDT present an attractive opportunity to catch potential reversals from key support zones. By combining insights from the green lines and monitoring lower time frames, traders can position for upside while minimizing risk.
I keep my charts clean and simple because I believe clarity leads to better decisions.
My approach is built on years of experience and a solid track record. I don’t claim to know it all, but I’m confident in my ability to spot high-probability setups.
My Previous Analysis
🐶 DOGEUSDT.P: Next Move
🎨 RENDERUSDT.P: Opportunity of the Month
💎 ETHUSDT.P: Where to Retrace
🟢 BNBUSDT.P: Potential Surge
📊 BTC Dominance: Reaction Zone
🌊 WAVESUSDT.P: Demand Zone Potential
🟣 UNIUSDT.P: Long-Term Trade
🔵 XRPUSDT.P: Entry Zones
🔗 LINKUSDT.P: Follow The River
📈 BTCUSDT.P: Two Key Demand Zones
🟩 POLUSDT: Bullish Momentum
🌟 PENDLEUSDT.P: Where Opportunity Meets Precision
🔥 BTCUSDT.P: Liquidation of Highly Leveraged Longs
🌊 SOLUSDT.P: SOL's Dip - Your Opportunity
🐸 1000PEPEUSDT.P: Prime Bounce Zone Unlocked
🚀 ETHUSDT.P: Set to Explode - Don't Miss This Game Changer
🤖 IQUSDT: Smart Plan
⚡️ PONDUSDT: A Trade Not Taken Is Better Than a Losing One
💼 STMXUSDT: 2 Buying Areas
🐢 TURBOUSDT: Buy Zones and Buyer Presence
🌍 ICPUSDT.P: Massive Upside Potential | Check the Trade Update For Seeing Results
🟠 IDEXUSDT: Spot Buy Area | %26 Profit if You Trade with MSB
📌 USUALUSDT: Buyers Are Active + %70 Profit in Total

ARUSDT 2DAR Update ~ 2D
#AR If you still have Conviction on this coin,. Buy gradually within this support block,. With a minimum target of 20%++
