AR Follow the drawing Hello ppl
hope you like the market
just Follow the drawing if you want
the SL is under the white box
Trade wisely
ARUSDT


AR/USD - Arweave on the Move! 🚀🚀🚀Arweae seems keen to test the resistance. Bias is quite bullish on lower timeframes like daily.
This chart is a weekly one, but still looks bullish in the near term.
A test of the $36 level is likely before any possible fall.
Bias is bullish right now.
Like and follow if you liked my idea!

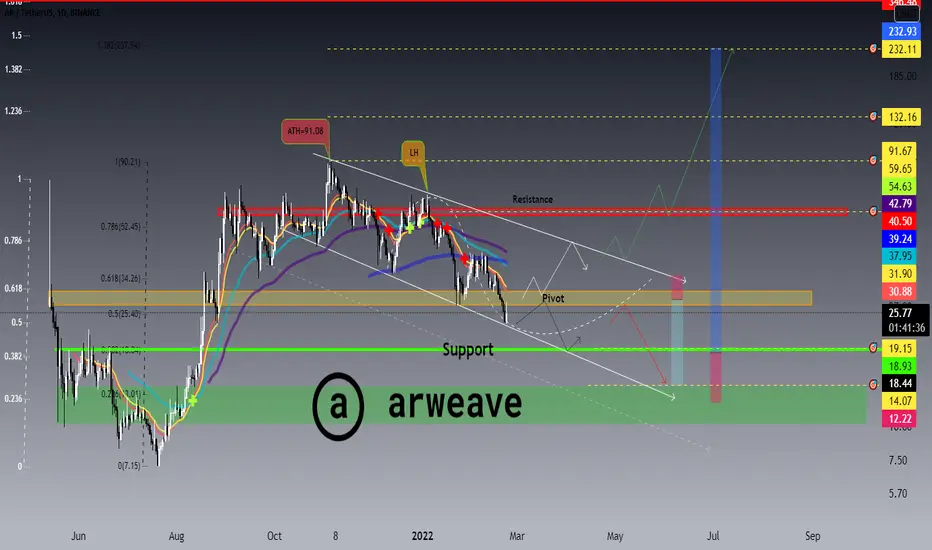
Update For AR/USDT Analysis 📈📉What's up Guys , in this analysis I gonna talk about arweave!
As you can see in the daily time frame for pair of AR/USDT ,since 5 NOV it has been declining after recording a new ATH about 91 $ ,
and now we can see that ar has been fluctuating between 2 decending trendlines,
also bcs of crossing under of emas , it went down under pivot zone and now there is a possibility of further fall to lower support line .
meanwhile it has reached the lower trendline again and it can have a jump , and if be able to reach above pivot area again it can rise to upper trendline ,
by breakout of descending trend line , there is a high possibility to reach the targets respectively and seeing new ATH in the long-term .
so in this case it can continue its rally by closing above trendline or resistance range and have a pulback and continue .
🛑resistances: $58-$62///descending trendline
🆚pivot zone: $27.63-30.62$
❇️supports: $18.93///$10.33-$14 ////ascending trendline
--------------------------------------------------------------------------------------------------------------------
👉This analysis is my personal opinion ,not a financial advice ,so do your own research.
💜 if you're a fan of my analyses PLZ follow me and give a big thumbs 👍 OR drop comment 🗯💭
AR/USD - Descending Channel. Price at Support! 🤔Arweave dropped to a key support level at $25 dollars. Normally we should expect a bounce from this level at least until the top of our downtrend or resistance level.
However, the market remains quite bearish and a bounce may be weak. If this key support is lost then Arweave will go under $20.
I am totally interested to buy at around $10, particularly if the market remains bearish and we get a nice discount.
High timeframes like weekly are bearish but in the short term, we could get a nice relief rally. :)
Let's see, bias is neutral as long as this support holds. If it breaks, bias turns BEARISH.
Like and follow if you liked this idea!

Short ARUSDTShort ARUSDT
Im looking to short ARUSDT after around 33.20
1st Target - 28.21 zone
2nd Target - 23.46 zone
invalidation daily close above 36

ARUSDT trade analysisARUSDT trade will boost up from the point of supply zone (23% fib area to 161% fib level)


ARusdt buy TradeHello traders!
The overall market is strongly bullish and this is the final bull run we will see this month after that we will only look for the sell.
Buy Entry @ 36.60.
Stoploss @ 35.30(-2.65%).
Target @40.1(+10%).
Don't forget to hit the like button and follow to stay connected.


AR Arweave: 1D Chart ReviewHello friends, today you can review the technical analysis idea on a 1D linear scale chart for Arweave (ARUSDT).
The chart is self-explanatory. The current price is in a bearish pennant with the RSI in the oversold region. The price may have the ability to go up with a potential for a fake out. The measured move of the bearish pennant is almost at the Danger Zone (multi-month) support line. If price moves up, keep an eye on the resistance areas as well as the Ichimoku Cloud resistance.
Included in the chart: Trend line, Support and Resistance Lines, RSI , Bearish Pennant, Ichimoku Cloud, Volume.
If you enjoy my ideas, feel free to like it and drop in a comment. I love reading your comments below.
I have a bunch of additional recent charts below on cryptocurrencies to review. Check them out!
Disclosure: This is just my opinion and not any type of financial advice. I enjoy charting and discussing technical analysis. Don't trade based on my advice. Do your own research! #cryptopickk

AR has a good range to buy On 4F TF
BINANCE:ARUSDT is in the zigzag wave. This correction wave is nearly done with target around 28.
Wave C is still happening, wait for 5th wave.
Range 30 - 25 is a good buying zone.
DOYR be4 you trade

Entering a Long Inverse Head and ShouldersLooking to enter at the current price, to go long target close to $40+ depending on how the neck breaks out and what the Fed says this afternoon.
Stop loss.. Um IDK maybe like 30 or something lol

Trade with cautionHead and shoulders spotted. This would crush arweave to 8 dollars.
This is entirely possible as btc is showing increasingly stronger signs of bear market along with many major alts.
Don't expect another link for this bear market and especially not AR.

ARUSD IN BEARISH CHANNELAR/USDT
Move to the retest area for now, test the breakdown area
Or maybe can break the channel
We just need the confirmation, dont rush
Please be patience
#tipsfortradingplanning


ARUSDT will go around 56.89usdt !!!ARUSDT can go around 56.89usdt. If you go higher will hit 59.85 or 61.00usdt and support resistance it will be orange lane (56.89ust)!! If AR hit 59.85usdt and he go down (after hitting 59.85usdt) other support resistance is black/red lane (51.56usdt) and if AR can't stay on red-black support resistance (51.56usdt) he will go down to 45 or 48usdt!!!!

AR-USDT Bullish Movements in the ChartAR-USDT Bullish Movements in the Chart
Entery Level and Take Profit is described in Chart.


AR / USDT LONG IDEAAR is forming an inverse head and shoulders. I entered AR with 5X leverage right now.

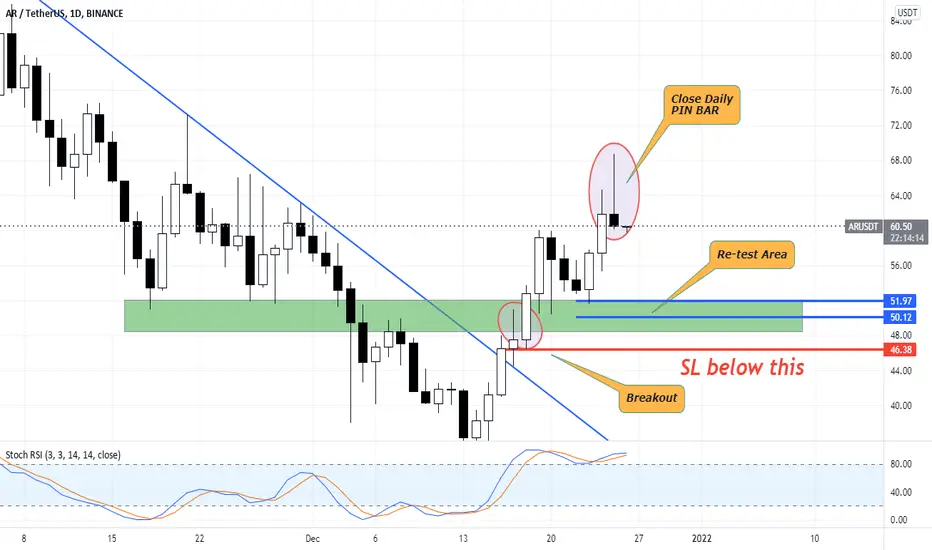
ARUSDT WITH BREAKOUT AND RETEST STRATEGYAR USDT
With trendline , AR clear breakout, wait the Retrace after the breakout
Key trading is patience
Good luck guys!
#indonesia #tipsfortradingplanning
ARUSDT Trend Broken & CwP Pattern | Expecting +65% MoveARUSDT Trend Broken & CwP Pattern | Expecting +65% Move
AR/USDT successfully broke the trend line that existed since November 5, 2021, and completed a strong bullish pattern called Cup and Handle.
Note:
1. Do your own analysis
2. Spot trading only
3. Do proper risk and money management
4. Respect your stop loss
5. I will not be responsible for any of your loss
6. Trade on your own Risk
7. Take the low risk that you can hold
Buying Zone: 59 - 61 - 62 - 63
TP1: 66.21
TP2: 73.46
TP3: 81.89
TP4: 91.05
New ATH: 101.55
SL: 51.42
Trade Risk: 14%
ROI: 64% - 67% - 70%

