EURNZD: Steep Channel continuation setupEURNZD continues to rise within a steep ascending channel, maintaining a well-structured sequence. No signs of exhaustion are evident yet, as bullish momentum remains strong and price action continues to respect both the midline and lower boundary of the channel.
This ongoing strength suggests that buyers remain in control, and unless we see a clear shift in structure, such as a break below channel support or loss of momentum, the trend remains intact.
🟢 Trend Bias: I remain bullish on EURNZD while price stays within this channel. Any pullbacks toward the lower channel boundary or previous breakout zones may offer continuation opportunities.
🎯 Target: My upside target is 1.983 , which aligns with the projected upper boundary of the ascending channel and makes a good technical target if the structure continues to hold.
🟥 Invalidation: A confirmed breakdown below the channel with follow-through would challenge this bias and signal the possibility of a deeper corrective move.
For now, the structure favors trend continuation over reversal.
Just sharing my thoughts on support and resistance, this isn’t financial advice. Always confirm your setups and manage your risk properly.
Disclosure: I am part of Trade Nation's Influencer program and receive a monthly fee for using their TradingView charts in my analysis.
Ascending

Celestia (TIA) – Ascending Triangle Setup (4H)BINANCE:TIAUSDT is printing a clean ascending triangle on the 4H chart, signalling a potential reversal.
Key Levels
• Support: Ascending trendline
• Resistance: $2.30 – a key level that acted as support since early April
• Measured Target: $2.50–$2.55 – aligns with prior support area
• Watch out for the longer-term descending trendline, which could act as resistance on breakout around ~$2.40
Breakout Trigger
A solid 4H close above $2.30 with convincing volume could confirm the move
Invalidation
A sustained break below the ascending support would fully invalidate the setup and potentially lead to a drop to $1.70

Cardano (ADA) Rectangle + Internal Uptrend (1D)BINANCE:ADAUSDT has spent months ranging between ~$0.51 and ~$1.15, and the structure now clearly qualifies as a rectangle pattern.
After a 3rd touch on support in April, Cardano is showing strength with steady higher lows and a reclaim of a key High Volume Node (HVN).
Key Levels to Watch
• Main Demand: ~$0.51-$0.58
• Rectangle Support: ~$0.51
• Rectangle Resistance: ~$1.15
• Internal Uptrend Support: Rising diagonal from April
• HVN Zone: ~$0.75 — key volume cluster
• Rectangle Midline: ~$0.83 — also a previous S/R
• Main Supply: $1.10–$1.32
Measured Target
If price breaks above $1.15 with volume, the rectangle measured move points to ~$1.80.
Context
ADA has respected this range for nearly half a year. A breakout could mark the start of a macro bullish leg.
Triggers
• Bullish: Clean daily close above $1.15 with volume → $1.80 target activated. For a safer entry, it could be worth waiting a full breakout from the main supply above $1.32.
• Bearish: Breakdown of the ascending trendline and HVN → Potential return to ~$0.51. Failure to hold that level could lead to further downside to the previous ~$0.30 demand zone.

MASA Ascending Triangle (1D) + Key LevelsBITGET:MASAUSDT is currently forming an ascending triangle on the daily chart, with horizontal resistance around $0.040 and rising support.
This structure typically leans bullish and suggests accumulation under resistance.
Structure & Zones
• Resistance: ~$0.040 (triangle top, within flipped demand → supply zone)
• Support: Rising diagonal since early May
• Demand: ~$0.013
• Main Supply: $0.06-$0.09 (High Volume Node, with $0.075 as a key S/R)
Breakout Target
A breakout with strong volume could trigger a measured move toward ~$0.060, aligning with the lower boundary of the High Volume Node (HVN) and the previous price cluster.
Context
The grey $0.06-$0.09 HVN has acted as a pivotal area — both as support and resistance — and could become the next key level if price breaks out.
Triggers
• A clean daily close above $0.040 with volume would be a strong bullish signal
• A breakdown below the ascending support would invalidate the pattern and likely lead to a retest of ~$0.013

RIZO Symmetrical Triangle (1D - Log)RAYDIUM:RIZOSOL_6NMICC.USD formed a symmetrical triangle, and a minor ascending triangle within it.
Log scale is needed despite the short timeframe considering the volatility.
Clear support and invalidation, with multiple TP targets.
Key Levels to Watch
• $0.000007: Local low. A break below the blue support trendline would invalidate the setup, with this horizontal level offering a more reliable invalidation point.
• $0.000010-$0.000012: Current resistance and minor ascending triangle upper boundary. Also an S/R dating back to August 2024. A break above it could be a good long trigger, aligning with the broader symmetrical triangle breakout scenario.
• $0.000025: High volume node, roughly aligned with the minor ascending triangle target.
• $0.000060: Local high from January 2025.
• $0.000150: ATH area, most likely strong resistance.
Until a confirmed breakout above $0.000012, RIZO remains in a compression phase and a no-trade zone for me.

Bitcoin Ascending Triangle (4H)BINANCE:BTCUSDT might be forming an ascending triangle on the 4H chart, with a horizontal resistance at $105k and support being the resistance of the broadening wedge we identified last week: Bitcoin Ascending Broadening Wedge (4H)
A sustained break above $105k would set the target at $109k, very close to ATH.

Bitcoin Ascending Broadening Wedge (4H)After a clean breakout above the macro downtrend, BINANCE:BTCUSDT rallied into its supply zone — but price action has since become increasingly volatile, forming a rising broadening wedge (also known as a megaphone pattern).
Pattern Insights
• The structure is defined by diverging trendlines, with each swing becoming larger and more erratic.
• This pattern often signals instability or exhaustion, especially near key resistance.
• While it can break either way, broadening wedges in an uptrend frequently resolve to the downside, especially when supply is overhead.
Key Levels
• Resistance: ~$ 98K-$99.5k supply zone — the upper boundary of the pattern.
• Support: ~$93.5k area — prior S/R, potential flip zone.
• Reversal: A breakdown below ~$93k could confirm a short-term bearish resolution and open the door to ~$88.5k.
• Continuation: A breakout above the upper boundary with volume could trap shorts and ignite a squeeze toward new highs.
Until then, BTC remains in a high-volatility structure, best approached with caution or as a range-trading opportunity.

BNB Ascending Channel (1W)BINANCE:BNBUSDT remains within an ascending channel dating back to January 2024, with multiple strong reactions at both boundaries.
After testing the upper boundary and hitting a new ATH last December, it entered a clear downtrend (orange trendline) that led to multiple attempts at the channel's support.
Price action is now getting compressed, and we could see a breakout soon.
Key Levels
• To the upside, the main resistance remains ~$700 area.
• Above that, CRYPTOCAP:BNB could have a shot at a new ATH and potentially the channel's upper boundary in the ~$900 area.
• To the downside, in case of a channel breakdown, $400 seems the first logical support (important S/R for previous swings).
Still very uncertain and in a No-Trade Zone until a breakout is confirmed.

How Can You Use the Ascending Triangle in Trading?How Can You Use the Ascending Triangle in Trading?
An ascending triangle is a chart pattern traders rely on to identify potential breakouts and further price movements. Recognised for its versatility, this pattern can signal trend continuations across all types of markets, including stocks, forex, commodities, and cryptocurrencies*. In this article, we’ll break down how to spot and trade this formation.
What Is an Ascending Triangle?
An ascending or rising triangle is a bullish chart pattern that usually signals a trend continuation. It is framed by two trendlines. The upper line connects highs placed at almost the same level, while the lower line is angled and connects higher lows.
The triangle’s appearance is explained as follows: buyers try to push the price up, but they meet a strong resistance level, so the price rebounds. Still, buyers have strength, which is reflected in higher lows. Therefore, they continue pushing the price until it breaks above the resistance level. The period during which the price bounces back and forth between the two lines depends on the timeframe. On daily charts, the triangle can be in place for over a week.
Note: The ascending triangle is a continuation chart pattern but sometimes it can be used as a reversal signal. It happens when the ascending triangle occurs in a downtrend. It’s the biggest challenge of all the triangles.
The rising triangle is one of the setups in the triangle group. There are also descending and symmetrical formations.
Ascending, Descending, and Symmetrical Triangles: The Differences
The triangle group of patterns comprises ascending, descending, and symmetrical formations.
The ascending triangle is a bullish formation and the descending triangle is bearish. At the same time, the symmetrical triangle is a bilateral setup that signals a rise and a fall in the price.
To distinguish between them, traders draw trendlines. In a rising triangle pattern, an upper trendline is horizontal and connects equal or almost equal highs, while the lower trendline is rising as it connects higher lows. In a descending or falling triangle pattern, the lower trendline is horizontal and connects equal or almost equal lows, while the upper trendline declines, going through lower highs. A symmetrical triangle has a falling upper line that connects lower highs and a rising lower line that connects upper lows.
How Traders Spot the Ascending Triangle
It’s quite easy to identify the formation on a chart. Still, there are a few rules that may help a trader determine its strength.
- The trend strength. Although the setup may appear on any timeframe, traders look for strong long-term trends as risks of a fakeout on low charts are higher.
- Consolidation. Triangles appear when the market consolidates within an overall trend.
- Trendlines. Trendlines must be drawn through at least two points. Still, the larger the number of points, the higher the possibility the setup works.
- Breakout. Can the ascending triangle pattern be bearish? No. It is a bullish formation that appears in a bullish and a bearish trend but always signals a potential price rise.
How Can You Trade Ascending Triangles?
The rising triangle pattern is usually considered a continuation setup formed in an uptrend. Still, if the ascending triangle is in a downtrend, it may signal a trend reversal. The trading rules will be the same in both cases.
As with most chart patterns, triangles have specific rules that help traders place entry and exit points.
Entry
The theory suggests trades go long when the price breaks above the setup's upper boundary. In a conservative approach, traders wait for the price to form at least several candles before entering the market. In a risky strategy, traders open a position as soon as the breakout occurs, and the breakout candlestick closes.
It's worth considering trading volumes as breakouts often turn into fakeouts, meaning the market returns to its previous trend. The chance of a strong breakout is higher if the volumes are high.
However, increased volumes aren't the only tool used to confirm a breakout. Many traders consider trend indicators and oscillators to potentially limit the risks of bad trading decisions.
- If the triangle serves as a continuation setup, it may be helpful to look at the signals of trend-strength indicators, including the average directional index.
- If traders use the ascending triangle as a reversal setup, they usually implement indicators that may signal a trend reversal, including the moving average, the relative strength index, the moving average convergence divergence, and the stochastic oscillator.
Take Profit
A standard take-profit target equals the size of the largest part of the setup and is measured just from the breakout trendline.
Stop Loss
Traders consider several options when placing stop-loss levels. In a conservative approach, they implement the risk/reward ratio, which is usually 1:2 or 1:3 but depends on the trader's willingness to take risks. Also, traders utilise the upper trendline as a threshold and place the stop-loss order just under it.
Note: These are general rules. However, traders can develop their own trading strategies and adjust the pattern's parameters and rules according to their trading approach.
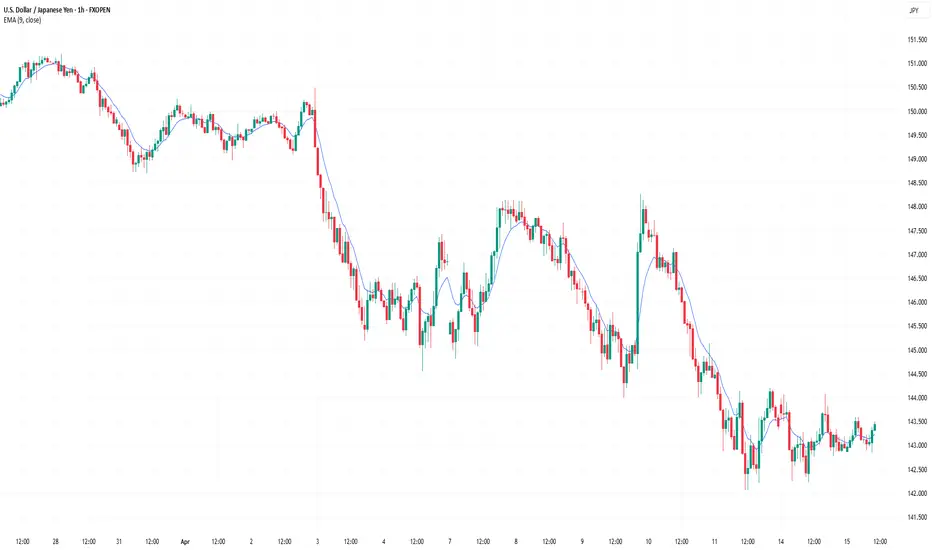
Ascending Triangle: Strategy
In this strategy, traders observe an existing bullish trend and the formation of an ascending triangle, which suggests the potential for a continuation pattern. Incorporating a short-term moving average, such as a 9-period EMA, provides dynamic support, aligning with the trendline to strengthen the setup.
Entries
- Traders typically wait for the price to break through the top trendline of the ascending triangle.
- A strong candle breaking the resistance level adds confidence, though any move above the top trendline can serve as an entry signal.
- The price should also trade above the moving average, offering additional confirmation.
- An order is often placed at the top trendline, anticipating a retracement to this level, which now acts as support.
Stop Loss
- Traders place a stop-loss below the most recent swing low within the triangle.
- For more conservative traders, the stop may be set at any prior swing low, depending on risk tolerance.
Take Profit
- Many traders aim for a risk-reward ratio of 1:2 or 1:3.
- Profits might also be taken at the next strong resistance level, aligning with the market structure.
Rising Triangle: Benefits and Drawbacks
This formation has advantages and pitfalls that traders consider when developing their strategies.
Benefits
- It can be used on any timeframe. Triangles are formed on charts of any period. Still, they might be more effective if the setup appears in a solid trend on a high timeframe.
- It can be used for any asset. Another advantage is that the ascending triangle pattern is used for stock, commodity, cryptocurrency*, and Forex trading.
- Easy to spot. A trader only needs to draw two trendlines to define this setup on the chart.
- Exact entry and exit points. Although traders can develop their entry and exit points, the setup assumes there are specific rules traders with any experience utilise.
Drawbacks
- It can confuse traders. As the rising triangle is used as a reversal and continuation formation, traders with less experience may be confused with its signals.
- False breakouts. The setup works when a price breakout occurs. However, there is a high risk the breakout will appear to be a fakeout, and the price will return.
- The pattern may fail. Aside from a fakeout, there is another risk when trading with triangles. The price may break another side of the formation, and the formation will fail.
- The trading rules may not work. Although specific rules indicate where a trader should place entry and exit points, buyers may be too weak to push the price to the take-profit target.
Final Thoughts
The ascending triangle is one of the more common chart patterns traders use when trading various assets. Still, there is no 100% guarantee that it will work every time you spot it on a price chart. It's vital to remember that every signal must be confirmed with other indicators, chart patterns, and candlesticks. Also, it's a well-known fact that any trade involves risks that should be considered every time a trader enters the market. Improve your skills by practising on different assets and timeframes.
FAQ
How Do You Form an Ascending Triangle?
An ascending triangle is formed when the price action creates a series of higher lows while facing a resistance level, resulting in a horizontal upper trendline and a rising lower trendline. The price consolidates between these two lines before potentially breaking out above the resistance, signalling a bullish continuation.
Is an Ascending Triangle Bullish or Bearish?
The ascending triangle is a bullish pattern. It suggests that buyers are gaining strength as higher lows form, increasing the likelihood of a breakout above the resistance level. There is a descending triangle pattern that usually appears in a downtrend, signalling a downward movement.
How to Enter an Ascending Triangle?
According to the theory, in triangle pattern trading, it’s common to enter the market when the price breaks above the upper trendline of the triangle. In a conservative approach, traders wait for confirmation through several closing candles after the breakout. The increased volume also adds confidence to the trade.
What Is the Ascending Triangle Pattern Retest?
A retest occurs when the price breaks out of the triangle but then briefly falls back to test the former resistance level. A successful retest confirms the breakout and can provide an additional entry point.
How Long Does an Ascending Triangle Pattern Take to Form?
The formation of a bullish triangle pattern can vary based on the timeframe. On daily charts, it can take several days to weeks, while on shorter timeframes, it might form within hours.
What Is the Difference Between an Ascending Triangle and a Rising Wedge?
In comparing the ascending triangle vs. the rising wedge, it’s key to recognise that the rising wedge has converging trendlines, signalling a possible weakening trend, often leading to a bearish reversal. In contrast, an ascending triangle trading pattern typically signals a continuation of the uptrend.
*At FXOpen UK, Cryptocurrency CFDs are only available for trading by those clients categorised as Professional clients under FCA Rules. They are not available for trading by Retail clients.
This article represents the opinion of the Companies operating under the FXOpen brand only. It is not to be construed as an offer, solicitation, or recommendation with respect to products and services provided by the Companies operating under the FXOpen brand, nor is it to be considered financial advice.
NAS100 Bull BiasCurrent Market Structure:
1. Trend Analysis:
• The price is still within a well-defined ascending channel.
• The recent price action shows a pullback toward the channel’s midline after hitting resistance near the upper channel boundary.
2. Key Levels:
• Resistance:
• 21,400–21,500: Price is near this key zone, which aligns with previous swing highs. A break above this could confirm further bullish momentum.
• 21,800: The next significant resistance, where a potential rejection could occur.
• Support:
• 21,200–21,300: Immediate support zone near the current price. A break below may lead to a retest of the channel’s lower boundary.
• 20,766 (blue line): Major support that aligns with previous lows and the base of the channel.
Possible Scenarios:
1. Bullish Case:
• If price holds above 21,300 and breaks through the 21,500 resistance zone, there’s a strong likelihood of a move toward the next resistance at 21,800 or even the upper boundary of the channel at 22,200.
• Buy confirmation: Look for bullish momentum candles or a retest of 21,400–21,500 as new support.
2. Bearish Case:
• If the price fails to break 21,500 and falls below 21,300, we may see further downside toward 20,766 (blue line).
• A break below 20,766 would invalidate the bullish structure and potentially lead to a deeper pullback toward 20,400–20,321.
Indicators to Watch:
• Trendline Interaction: The price is near the channel midline. A bounce or rejection here will determine the direction.
• Volume: A breakout above resistance zones requires strong volume for confirmation.
• Momentum Indicators (e.g., MACD/RSI): Watch for divergences or crossovers that might indicate a shift in momentum.
Trading Plan:
1. Long Setup:
• Entry: Above 21,500, after a breakout and retest.
• Target: 21,800, then 22,200.
• Stop Loss: Below 21,300 (midline).
2. Short Setup:
• Entry: Below 21,300, after rejection.
• Target: 20,766, then 20,400.
• Stop Loss: Above 21,500.
Conclusion:
The market remains in an ascending channel, favoring bullish bias unless 20,766 is broken. Monitor price action at 21,300–21,500 for confirmation of direction.

Bullish triangle closing in for KAVATurns out kava wasn't ready to break out of the ascending triangle I mentioned in my recent post just yet, price dropped and bounced from the bottom support. There are slight hidden bullish divergences on obv and rsi on the daily chart and price is lagging behind to that of some other alts and current price action is indicating it is ready to catch up. Expecting next test of the triangle top to result in a breakout and a strong move up.
DYOR and trade safe!

Big bullish move incoming for EOSBig ascending triangle forming with strong hidden bullish divergence. Enter as close to the bottom trendline of the triangle as possible. Targets are on the chart.
Still depends on BTC price moves but with dropping BTC dominance the effect of BTC on alts is diminishing. With BTC price action currently turning bullish I think this will play out quite nicely!
Trade safe!

Bullish Butterfly Ascends a Channel w/Underlying Fib LevelsHere I have BINANCE:XRPUSDT on the Weekly Chart!
Beginning of March 2020, BINANCE:XRPUSDT hits its Lowest Low @ .1013
Beginning of April 2021, BINANCE:XRPUSDT hits its Highest High @ 1.9669
For context ~1,800% Increase in 1 Year
Taking the Fibonacci Retracement Tool, we can see that Price made a drop after the Higher High (Point A) to the 78.6% level (Point B), created a Lower Low at the 32.8% (Point C), then was rejected after descending to the 88.6% (Point D) and with this Price Action, formed a Bullish Harmonic Butterfly Pattern!!
Parameters:
X - B .786
A - C .382 / .886
B - D 1.618 / 2.618
X - D 1.27 / 1.618
(B/D and X/D Fall Short)
-Price is continuing to trade Above the 200 EMA
With the short-coming completion of this pattern, sprouts an Ascending Channel that Price now currently is traversing up!
-If Price can continue this upward path, I believe it will battle with the Overlying Resistance Zones that line up with these Fibonacci Levels!
1) .8139 - .9240
(61.8% - 55.9%)
2) 1.2542 - 1.5266
(38.2% - 23.6%)
*Caution to those who see the Ascending Channel break Bearish, because then Price Action could be a signal of a Double Top!

Bullish Momentum Building in JUBLING!
Bullish breakout above ₹800.50
Next targets: ₹850, ₹900 on the upside
Strong ascending trend line with good volume
RSI below 70 indicating potential for further momentum

Tata Comm Breaks Out! Bull Ride Ahead?
Bullish breakout near ₹2,170 with ascending trend line support
Good volume building, signaling strong momentum
RSI below 70, leaving room for further upside

GOlD → stick to the long positionhello guys.
I believe gold is still bullish and only long positions are logical.
Channel Breakout: The price of gold has broken out of the main ascending channel, indicating a strong bullish move.
Fake Divergence: A fake divergence was spotted, but the price continued to rise, rejecting bearish signals.
Support Zone: The price is currently hovering above a significant support zone (highlighted in blue), which could serve as a springboard for further upward movement.
Target: The next potential target lies near the upper boundary of the newly formed channel, around the $2,550 mark.
Summary
Breakout: Price broke above the main ascending channel.
Support: Holding above a key support zone.
Target: Aiming for $2,550 as the next potential resistance level.
___________________________
✓✓✓ Always do your research.
❒❒❒ If you have any questions, you can write them in the comments below, and I will answer them.
❤︎ ❤︎ ❤︎And please don't forget to support this idea with your likes and comment

SMCI is about to "break out" of the ascending triangle.SMCI is about to "break out" of the ascending triangle.
We Should Buy SMCI Stock Now.

AUTO CHART PATTERNS BY TRENDSCOPE "very useful"The community indicator and editor favorite "auto chart patterns by trendscope," is like the most convenient and intrepid practical indicator to find lines on chart without drawing in excess only to need to remove the lines all over again. Wow, this by Trendscope indicator is top shelf.

USO - Oil Prices are Rising LONGUSO follows the futures prices of oil barrels. On this 30 minute chart, price falls have been
rejected by the POC line of the volume profile and the Lux Algo Donchian channel has
transitioned from downgoing to trending up. The dual TF RSI of Chris Moody now shows
RSI holding above 50 in both the 15 min and 60 min TFs. Net distribution has bottomed out
and accumulation now exceeds distribution. I see this as an excellent entry to buy calls
above the money at $70 or look into shares of USO / UCO/ GUSH ETFs or look at any of
the oil sector stocks including well services which are typically small caps with great upside
volatility with price action momentum. My favorite of those is BORR which currently is trending
up and may have much of its move ahead. The ascending parallel channel of USO is perhaps
a signal for the sector at large.

If $RUNE holds up this confluence...CRYPTOCAP:RUNE has just broke several resistences
If it can hold above the vertice of triangule, it will try again the local all-time-high on picture
Targets on pink arrows

DOGE can ascend further!Hi.
COINEX:DOGEUSDT
Today, I want to analyze DOGE for you in a weekly time frame so that we can have a mid-term view of DOGE regarding the technical analysis. (Please ✌️respectfully✌️share if you have a different opinion from me or other analysts).
We have a Bullish Structure here
DOGEUSDT crossed out of the symmetrical triangle on weekly timeframe💡
✌️Keep growing
✅ Due to the Ascending structure of the chart...
- High potential areas are clear in the chart.
- AB=CD
Stay awesome my friends.
_ _ _ _ _ _ _ _ _ _ _ _ _ _ _ _ _ _ _ _ _ _ _ _ _ _ _ _ _ _ _ _ _
✅Thank you, and for more ideas, hit ❤️Like❤️ and 🌟Follow🌟!
⚠️Things can change...
The markets are always changing and even with all these signals, the market changes tend to be strong and fast!!

Potential BTC LONG setup - Ascending ChannelBTC has been ranging within an ascending channel since mid-October of 2023 and is currently testing the lower trendline of the channel. If the trendline holds, we can expect a bullish move back towards 49k.
If the trendline fails, BTC will likely retest the 41k - 40k support area.
Keep in mind that recent ETF approvals have created additional uncertainty in the market, so price action may be more unexpected than usual. Use multiple confirmations before entering any trade positions.

I Cannot Short This !!! situation+next targets.LINKUSDT is in an ascending triangle which means the price is about to do a good bullish movement. The price can increase as much as the measured price movement ( AB=CD ) .The break out needed for increasing further has not happened but it should happen pretty soon.
🤑Stay awesome my friends.
_ _ _ _ _ _ _ _ _ _ _ _ _ _ _ _ _ _ _ _ _ _ _ _ _ _ _ _ _ _ _ _ _
✅Thank you, and for more ideas, hit ❤️Like❤️ and 🌟Follow🌟!
⤵️⤵️⤵️⤵️⤵️⤵️⤵️⤵️⤵️⤵️⤵️⤵️⤵️⤵️⤵️⤵️⤵️⤵️⤵️⤵️⤵️⤵️⤵️
