Bitcoin(BTC) crossroads 5yr bull meets 3 yr bearApologies for not being as active with TA posts, I have been more focused on automated trading and in fact we are in process of working a relationship that will integrate our order book and order flow data from vcdepth.io into a major automated trading platform.
BTC is in a unique place worth mentioning. First, BTC has had a 5 year bull run never once breaking its 5 year ascending trendline in any meaningful way, until the Covid crash. I had mentioned previously if this support breaks in any meaningful way, get out. After we broke this trend line, BTC lost 50% of its value in two days finding a bottom near $4k.
The covid crash on equity markets was followed on crypto markets, we dropped well below the previous 5 year bull ascending trendline. We came back up to the 5 year trend line and we tried to convert it back to support but we had the ominous shadow of a 3 year descending trendline of resistance kick us back down as we tried to break back above the previous ascending bull line to convert it back to support, currently we have failed to do so. Furthermore it appears we may have formed a fairly large descending channel over the last year as marked on the chart with 1-4 numbering.
Its not too late to break out of this 3 year bear cycle and head back up especially since minus these two trend lines the current ascending trend seems positive. We are at a fairly critical point where BTC has to decide if its going to honor this 3 year bear resistance or push through and reclaim the previous 5 year bull support again. We are literally just past the crossing of these paths and it looks like the path of the bear is prevailing at the moment.
If we head back down we can see a potential descending channel here where the bottom of channel would catch BTC around the $4k range but likely to see a surge down around $3500, a lower low than the low we already saw in March this year (2020).
On the up-side global liquidity seems fairly strong still and if we can break out above this 3 year descending channel and reclaim the 5 year ascending trendline and then see a break of the previous $10,500 high this year, things would look quite positive.
Recently we have seen some staggering coincidences that would appear as though BTC has some what correlated price action to global stock markets. Right now with all the stimulus, stock markets have been recovering at otherwise unexplainable rates. The likely prolonged presence of the Covid virus and the already multi-year recovery in front of us leads me to believe that stock markets will correct fairly significantly. The question to me is how correlated are these markets now, watching equities markets may be view into what to expect in crypto markets and whether or not we can break this downtrend resistance. Unfortunately the S&P appears to be establishing the previous 10 year ascending bull trend line into resistance at the moment, without a push we could see equity markets pull back soon.
I am not saying long or short but a straddle would likely be pretty useful as we are likely to make a fairly significant move soon. My overall feeling looking at this chart is that there is currently a greater probability of going down versus up but again, we are still at a point that leaves the door open to escape this fate. Would probably be a good idea to keep your eyes on these trendlines, keep a tight stop loss, hedge your long positions.
This is not investment advice, these are my own observations and should not be used as analyst advice or a single source of research regarding the topic. DYOR!
Ascending


That Blue Line!that blue line is the line that connects two important highs, the 20k and 14k. we had a rally from 3.8k to 10k then we are consolidating in an ascending channel it feels like 2019. when every correction in that time was a consolidation in an ascending manner actually volume is declining since we met 10k.
as i showed you on the chart above the yellow circle is the the end of an impulsive wave and now we are at a correction phase. we don't see volume and it's declining and market is lowering it's fluctuations.
my suggest is to long this market and here is a edge to start:
open a long position :
size : 50% of equity
EP = 9440 (now)
SL = 8800
TP = 10500

LONG - QKC - Trading OpportunityBINANCE:QKCBTC finally breaking the huge ascending triangle that has been forming for quite some time now, now retesting the resistance that became support.
Entry: 0.00000069
Target 1: 0.00000093
Target 2: 0.000000113
SL: 0.00000062
CryptoCue is not providing investment advice and is not taking subscribers’ personal circumstances into consideration when discussing investments. Investment involves a high degree of risk and should be considered only by persons who can afford to sustain a loss of their entire position.
CryptoCue is not registered, licensed or authorized to provide investment advice and is simply providing an opinion, which is given without any liability or reliance whatsoever. The information contained here is not an offer or solicitation or recommendation or advice to buy, hold, or sell any security. CryptoCue makes no representation as to the completeness, accuracy or timeliness of the material provided and all information and opinions provided by CryptoCue are subject to change without notice and provided on a non-reliance basis and without acceptance of any liability or responsibility whatsoever or howsoever arising. You hereby irrevocably and unconditionally waive, release and discharge: (a) any and all accrued rights and/or benefits you may have against CryptoCue in respect of any opinion expressed or information conveyed by CryptoCue at any time; (b) any and all Claims you may have against CryptoCue arising out of any opinion expressed or information conveyed by CryptoCue at any time; (c) CryptoCue from all and any claims (whether actual or contingent and whether as an employee, office holder or in any other capacity whatsoever) including, without limitation, Claims you may have against CryptoCue arising out of any opinion expressed or information conveyed by CryptoCue at any time. ("Claims" shall include any action, proceeding, claim, demand, judgment or judgment sum of whatsoever nature or howsoever arising.) You hereby agree to indemnify and hold harmless CryptoCue in respect of any and all Losses paid, discharged, sustained or incurred by CryptoCue in the event of bringing any Claim against CryptoCue. (“Losses” shall include any and all liabilities, costs, expenses, damages, fines, impositions or losses (including but not limited to any direct, indirect or consequential losses, loss of profit, loss of earnings , loss of reputation and all interest, penalties and legal costs (calculated on a full indemnity basis) and all other reasonable professional costs and expenses and any associated value-added tax) of whatsoever nature and/or judgment sums (including interest thereon).

Tesla to $1430? Tesla just completed a 16 week acending triangle pattern. Based on my charting princpals the price target should be $1430, lets watch.


XLM/USD on verge of potentially breaking year-long resistanceContext Introduction:
XLM/USD has been caught within a descending wedge (bullish) for a bit over a year now. With Black Thursday's crash, bears really overextended themselves and even managed to temporarily break this wedge's support. However, a quick rebound helped regain the validity of the support. Since bears overextended themselves and were rejected, XLM/USD has now managed to reach the resistance of the descending wedge, where it has been consolidating for approximately a month now. Consolidating so close to such a significant resistance without a significant rejection (relative to the range of the descending wedge) for such a long period of time is allowing XLM/USD to gather momentum to attempt a strong break of the resistance. Additionally, XLM has been trading within an ascending channel since Black Thursday's crash and is now near the support of the channel, allowing for room for growth relative to this channel. The support of this channel and the resistance of the wedge form a symmetrical triangle (bullish).
What do the technical indicators tell us? (Daily Chart):
The MACD has been below zero for approximately 20 days now. Given that MACD is a lagging indicator and with today's rise, it is likely to cross over 0 soon. Additionally, it already established a higher low (reduced probability of a re-dip). With the MACD signaling a potential crossover soon and its extended time below 0, this increases the probability of an upside break of the wedge's resistance.
The RSI had been stuck in a downtrend ever since the start of the wedge that seems to have ended after Black Thursday's crash. We are now seeing higher lows and higher highs on the RSI. Additionally, the RSI barely managed to go below 50 during this recent consolidation, and has now risen to near 60. This shows that the bears were unable to garner significant enough strength to pull XLM away from the resistance. The RSI also signals room for growth.
Potential Risks:
If XLM/USD is strongly rejected at this resistance, watch out for a loss of support near horizontal support at ~$0.062. If such occurs, the next significant support lies at the 200D SMA (currently at ~$0.057) followed by another horizontal support level at ~$0.053. If this level is lost, watch out for levels near ~$0.04. At this point, if a low was established an inverse head and shoulders pattern could come into play on the daily timeframe, allowing a breakout of the wedge after such.
Likely Outcome:
Given the primarily bullish indications above, I predict a break of the descending wedge's resistance soon. If this resistance is decisively broken, expect a potential test of support (which very conveniently lines up with the ascending channel's support) at previous resistance before continuation.
Potential entry:
Upon successful test for support of rising wedge (~$0.07).

Buy: AQI.AXOn watchlist
Price beginning to contract and forming an ascending triangle
Potential for a strong breakout
Watch for the break of 8.2
Might see some strong resistance at 10c

#bitcoin one more ascending triangle to keep an eye onfirst one was on smaller tf & it broke early, keeping an eye on this one for scalping opportunity

DXY 99.62 -0.19% SHORT IDEA GOOD DAY EVERYONE
HERE'S A SHORT IDEA ON THE DOLLAR INDEX, WE SAW A BREAKOUT OF THE ASCENDING CHANNEL CAME BACK UP FOR A RETEST OF THE STRUCTURE AND HOPEFULLY THIS SIGNALS A MOVE TO THE DOWNSIDE.
> WE ARE TRADING AT 38.2% FIBONACCI LEVEL IF IT HOLDS AS SUPPORT WE MAY SEE A RISE TO THE UPSIDE
> TARGET 1 - 99.07
> TARGET 2 - 98.82
SL - RISK MANAGEMENT AND YOUR RULES
PERIOD - DAY TRADE

$NQ_F Added to short here$SPY $QQQ $NQ_F $AAPL $SPX -- $NQ_F Added a few more Con short here for the ascending wedge breakdown on the 5 / 15 min chart. should be a decent trade imo

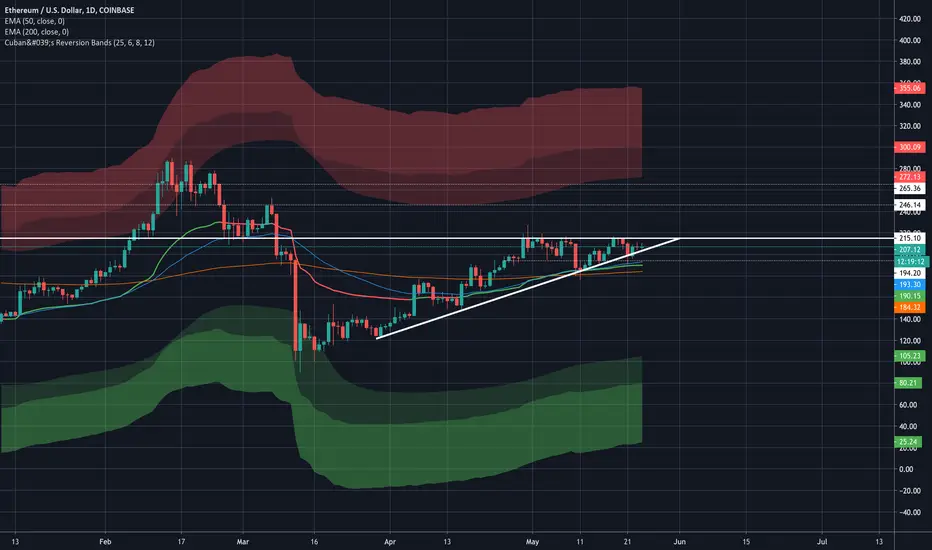
$ETHUSD ascending triangle formation, breakout soon.Before we get into this idea, please note that performance is not guaranteed. I recommend doing your own research before entering any trade. Your upvotes & comments are appreciated.
COINBASE:ETHUSD inside ascending triangle, apex on the first of June. Expect upwards breakout targeting +/- $245 and +/- $265.
If it breaks out to the downside, supports are at $198, $195, $190 & $185. Should hold up.
I'm already long. If you're not, wait for a high momentum/volume breakout or successful retest of the $215 R/S.
Best of luck, traders.
- Jelle
Buy: KAR.AXDecent sharp downtrend
Nice ascending triangle base forming
Enter on break of 60c
Keep it simple

Buy: ALG.AXAnother one for the watchlist
Pretty violent downtrend
Ascending triangle forming
Price on the right side of MA
Enter on the break of 47c


BTCUSD BEAR TRAP IN ASCENDING TRIANGLEWe have to take closer look on the momentum of price and look for confirmation after retracing back to test the trend line, if it will act as resistance or support. cheers.

SilverWe see a ascending wedge pattern on silver. Looking likely to break out. It held strong when gold fell, stocks opened red and silver rose through the daily steadily.

BTCUSD - Bull from 16th was confirmed and executed yesterdayI'd thought let me just continue this Bitcoin technical analyses and evaluate our steps from last saturday. One thing I already noticed is that our prognoses of the bull breakout after may 16th became valid. As you can see in this chart, yesterday BTC only suffered a few hours of decline, and then went up again.
You can see my previous idea here that I posted on saturday (the last posted picture contains the bull breakout theory) which was a shortterm and volume based analysis.
Let us reevaluate the next days of what we analysed before and see what happens to our BTC-babygirl.
____________________________________________________________________________
I'm purely a beginner in technical analysis. Please hit like, follow or place a comment.
Any of your feedback is my motivation to keep going and to learn more!

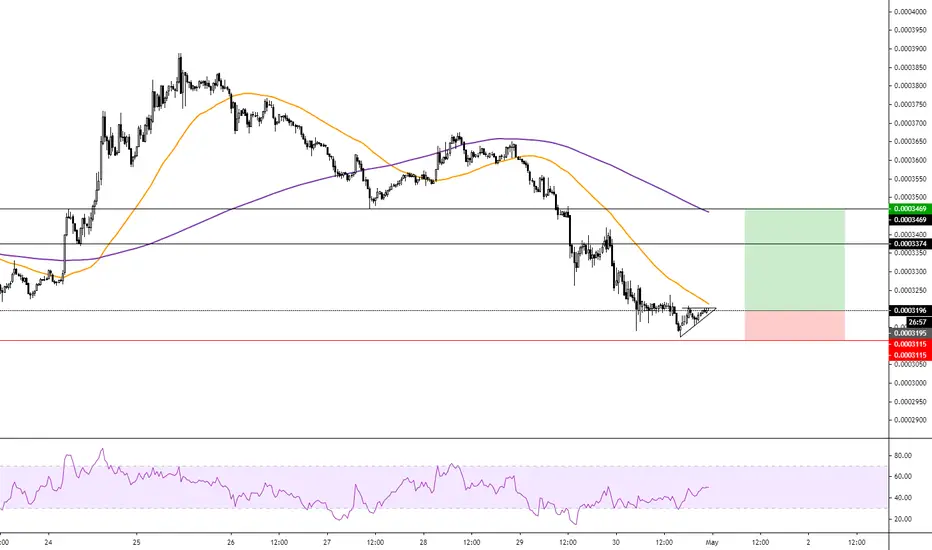
LONG - ATOM - Trading OpportunityBINANCE:ATOMBTC is another one that still hasn't made the comeback that it should, now in an ascending triangle formation in the lower time frame, while also hanging above the MA50 on the 15min chart.
Entry: 0.0003196
Target 1: 0.0003374
Target 2: 0.0003469
SL: 0.0003114