$BA nice short today off ascending support from daily chart.Nice clean ascending support that was tradable today intraday!
Enjoy.
xeenos trading - sending positive energy to all those watching!
Ascending

Trade Journal: Long $TNDM - 4/16/2020TNDM has been on my watchlist for a long trade and today the trade triggered. Ever since bouncing from 44 lows to 70 TNDM has been consolidating sideways and formed a solid Ascending Triangle pattern. This pattern is also right under the 50DMA making this a potentially powerful breakout. I also like the fact TNDM is holding above the rising 5DMA.
Entry - 70.86
Stop Loss - 68.60
Target - 80

EURUSD ShortH4 Mitigation Block + Breaker After falling from Ascending wedge. Looking for a trend line bounce and fake breakout from triangle before trend line breaks.

NZDUSD ShortAloha. This could be a quick play short because the recent trend and run has been quite bulllish, however...
Daily - showing signs of consolidation and rejection of the 50 ema where price is hovering.
1hr- If price breaks strongly bearish and well below the 50ema, this may trigger me in.
4hr - A better consolidation for this pair to go short would be if price was below the 4hr 50 ema, however, we may be in the long ride down if the bears come into play.
We can see a rejcetion and bounce right back into a conslidating pattern. It's been 3 days since any major movement and indicates this may be a good time to enter but it's okay to not rush it. Price can continue its bull rum.
On a LONG note: If price can move off the 1hr and 15minute with a nice break of the ascending channel, then I will be looking for BUY entries on this!
Tread lightly when placing a trade in this market. Allow for more room to be lenient with your SL. It's not always about making money but instead, how to preserve your capital!
Happy trading all!

GBPJPY Gartley Pattern trading setup / 61,8% retrtacement Hello traders, we have a bearish opportunity in GBPJPY with the formation of the Gartley pattern that concur with the 61,8% fib retracement of the last impulse leg.
Stop losses 5-10 pips above X.
Targets 38,2%, 61,8% retrcement of AD and 61,8% pullback af the ascending Wedge.

GBPUSD 1H PA AnalysisSome potential FX:GBPUSD trades to jump on after price action verification.
Market is in a downtrend on the 4H but showing some bullish action. We're getting repeated hits at the current resistance level so I'm expecting some pressure to be released on the upwards to the thin pink line and then possibly to top blue resistance level for a test (more likely a fake breakout). If not, then we'll see a break of the current ascending wedge down to the thin pink line, and then a retest to the thick red support level in accordance with my previous price action analysis.
At this time, I'm looking for decent sell trades and the larger P/L trade signifies such entry. If price continues to go up and hit SL, then I'll re-enter the sell trade at the top of the blue resistance and hold it to the thick red support level for a greater Risk/Reward ratio and adjusted trade size to account for the loss.
Additionally where price currently is coincides with the .5 Fib level exactly which gives us greater sell confirmation bias. And the top blue resistance line is the .618 Fib level for Stop-Loss setting.
Have a good weekend!
Disclaimer: These trade ideas should not be relied upon as a substitute for extensive independent market research before making an actual trading decision. Trading carries inherent risks and a prudent individual will use such information responsibly.

Bitcoin Resistance...After rallying over the past week with implications of a reversal, bitcoin is still encountering a lot of bearish sentiment. Presently, bitcoin is up against resistance from the 200 ema on the 8-hour time frame.
This would not be the first time Bitcoin has broken through resistance in this rally, however there are many areas of resistance in the mid-7k range.
Is this more than a short-term rally? The weekly stochastic is turning up, and the daily is trending up to a 4-day. There is at least potential for a reversal.

#BTC most Annoying Triangle EVER!!! this is 3rd time i am drawing this, we have broken the last 2 Triangle downside with good volume however bulls just keep coming back!!
Just break somewhere!!
i am holding short with Avg entry of 6620 IF WE CLOSE ABOVE 6677 then I will be out!!!
are you Long or Short???


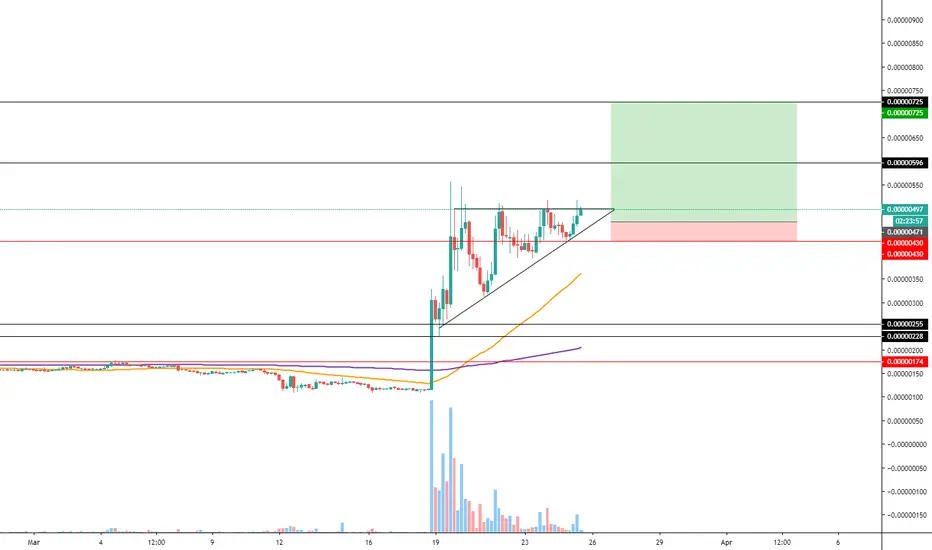
LONG - DATA - Trading OpportunityAfter BINANCE:DATABTC insane pump a few days ago, an ascending triangle formation seems to have taken place, while the volume slowly decreases we might see a last hurrah pump.
This is quite a risky trade so take that in consideration for position size.
Entry: 0.00000471
Target 1: 0.00000596
Target 2: 0.00000725
SL: 0.00000429
CryptoCue is not providing investment advice and is not taking subscribers’ personal circumstances into consideration when discussing investments. Investment involves a high degree of risk and should be considered only by persons who can afford to sustain a loss of their entire position.
CryptoCue is not registered, licensed or authorized to provide investment advice and is simply providing an opinion, which is given without any liability or reliance whatsoever. The information contained here is not an offer or solicitation or recommendation or advice to buy, hold, or sell any security. CryptoCue makes no representation as to the completeness, accuracy or timeliness of the material provided and all information and opinions provided by CryptoCue are subject to change without notice and provided on a non-reliance basis and without acceptance of any liability or responsibility whatsoever or howsoever arising. You hereby irrevocably and unconditionally waive, release and discharge: (a) any and all accrued rights and/or benefits you may have against CryptoCue in respect of any opinion expressed or information conveyed by CryptoCue at any time; (b) any and all Claims you may have against CryptoCue arising out of any opinion expressed or information conveyed by CryptoCue at any time; (c) CryptoCue from all and any claims (whether actual or contingent and whether as an employee, office holder or in any other capacity whatsoever) including, without limitation, Claims you may have against CryptoCue arising out of any opinion expressed or information conveyed by CryptoCue at any time. ("Claims" shall include any action, proceeding, claim, demand, judgment or judgment sum of whatsoever nature or howsoever arising.) You hereby agree to indemnify and hold harmless CryptoCue in respect of any and all Losses paid, discharged, sustained or incurred by CryptoCue in the event of bringing any Claim against CryptoCue. (“Losses” shall include any and all liabilities, costs, expenses, damages, fines, impositions or losses (including but not limited to any direct, indirect or consequential losses, loss of profit, loss of earnings , loss of reputation and all interest, penalties and legal costs (calculated on a full indemnity basis) and all other reasonable professional costs and expenses and any associated value-added tax) of whatsoever nature and/or judgment sums (including interest thereon).
BTC showing multiple Bearish indicatorsCOINBASE:BTCUSD Here we see that BTC has been in a long-term downtrend since June of 2019's high. More recently, at the beginning of this year it appeared as though we could be breaking out of this bearish trend, only to see a major correction to the downside spurred by macroeconomic events.
Since the spike downward the price action of BTC over the past 2 weeks has lead to the formation of an Ascending Wedge. This is characterized by candles closing with higher highs, lower lows, and decreasing volume. It is also considered to be "more" valid if the fib retracement levels remain below the .5 line, which we can see, they still are.
As supply gives out and bullish exhaustion takes over, we can expect to see a continuation of the long term downtrend.
Coupling this with the macro environment we are all aware of, and I don't see BTC bucking this trend.
Of course, it is possible that BTC is strengthened by these factors (as it was designed to be) and we see BTC enter a new bull phase. The problems I have with this scenario are that;
1: People aren't buying any risk On or Off speculative assets (stocks or even bonds) if they can't afford food or housing, which is a very real possibility in the coming months.
2: If hyperinflation drives the price of BTC to 100k, then it will also drive the price of everything else we own up. A cheeseburger could end up costing 10k.
Does that mean it's time to go long on burgers?
Adjusted for the rate of hyperinflation, the fact is that a 100 thousand dollar BTC would actually be worth much less than it would be today, but it wouldn't be evident in the charts.

Asecnding Triangle on the 1 hr? #BitcoinMaybe this breaks North before a retracement. Thoughts?
Please leave your comments and let me know what you think. And don't forget to hit the like button and follow along
-NCCM

Potential Ascending triangle possibility with an apex in aprilwant to see some more confirmation on this one before I'm a 100% convinced but as of now that's the bigger picture. we can see how price action also came up exactly to the teal horizontal line and found resistance further proving the validity of that trendline as it has so many times before. we should break above it soon but not so sure if we'll be retesting the top trendline of the purple ascending triangle on this leg up or if we will turn back around and retest the bottom trendline first. Gonna potential take a lot of sideways here before we find out, if we see a breakout much sooner than very end of march/beginning of April then the ascending triangle may not be the pattern afterall. We'll see what happens soon enough. It would make sense to consolidate her in a long ascending triangle however if the candle from a couple days back was indeed the final capitulation candle. That for now is still up in the air but it very very likely could have been...unless his next weekly candle is the real capitulation candle..for now odds favor the previous weekly candle as the capitulation candle. It is key that we get back above the weekly 200ma in the next couple weekly closes or at least hold support on the 50 monthly ma just below that.

GBPCAD wedge, trend line, supportGBPCAD is right now near 1h trend line. Will the price bounce? Well there is a strong support zone and descending wedge...so after the breakout of the wedge, the bulls should move a price higher.

ETH/BTC Ascending triangleETH/BTC is forming an ascending triangle, we should be looking for a breakout to the upside.

Ascending triangle breakout! Long!!!We have confirmed the ascending triangle and are looking for a breakout! I entered a long at 268.4 and looking to take profits at 300-330 and 360! Have a stop at 264. Gl everyone!

Looks like an ascending triangle to meLooks like an ascending triangle, but not very strong supported. So it may fail. If we get a rebound, we could safely expect some growth, especially considering golden cross that just occured. We should see in one day.

LONG - OKBPERP - Trading OpportunityOKB consolidating above previous support, looking like we could get some kind of ascending triangle action over here, so we will be playing the range.
Entry: 6.731
Target 1: 7.375
SL: 6.3705
CryptoCue is not providing investment advice and is not taking subscribers’ personal circumstances into consideration when discussing investments. Investment involves a high degree of risk and should be considered only by persons who can afford to sustain a loss of their entire position.
CryptoCue is not registered, licensed or authorized to provide investment advice and is simply providing an opinion, which is given without any liability or reliance whatsoever. The information contained here is not an offer or solicitation or recommendation or advice to buy, hold, or sell any security. CryptoCue makes no representation as to the completeness, accuracy or timeliness of the material provided and all information and opinions provided by CryptoCue are subject to change without notice and provided on a non-reliance basis and without acceptance of any liability or responsibility whatsoever or howsoever arising. You hereby irrevocably and unconditionally waive, release and discharge: (a) any and all accrued rights and/or benefits you may have against CryptoCue in respect of any opinion expressed or information conveyed by CryptoCue at any time; (b) any and all Claims you may have against CryptoCue arising out of any opinion expressed or information conveyed by CryptoCue at any time; (c) CryptoCue from all and any claims (whether actual or contingent and whether as an employee, office holder or in any other capacity whatsoever) including, without limitation, Claims you may have against CryptoCue arising out of any opinion expressed or information conveyed by CryptoCue at any time. ("Claims" shall include any action, proceeding, claim, demand, judgment or judgment sum of whatsoever nature or howsoever arising.) You hereby agree to indemnify and hold harmless CryptoCue in respect of any and all Losses paid, discharged, sustained or incurred by CryptoCue in the event of bringing any Claim against CryptoCue. (“Losses” shall include any and all liabilities, costs, expenses, damages, fines, impositions or losses (including but not limited to any direct, indirect or consequential losses, loss of profit, loss of earnings , loss of reputation and all interest, penalties and legal costs (calculated on a full indemnity basis) and all other reasonable professional costs and expenses and any associated value-added tax) of whatsoever nature and/or judgment sums (including interest thereon).

BTC to $11750 in two weeksThis screen captures all 3 runs, our first miracle run to $20k, the run last summer to $14k and this run now. All 3 runs had their own ascending channel. Notice with each run, the return descending channel is more narrow, this is as a result of a larger number of smaller runs versus just a fewer major runs in the past.
2017 run lasted 9 months and had 4 distinct runs from $900 to $20,000
2019 run lasted 3 months and had 3 distinct runs from $4000 to $14,000
2020 run, 6 weeks so far and has already had 4 distinct runs from $6900 to ? ($11750?)
-------------
This ascending channel couldn’t be more calculated and in line with historical resistance points. There is an incredibly strong likelihood this was a good entry point and we are about to run up, continuing the current 6 week trend until it hits a major resistance point around the beginning of March (2 weeks from now) establishing a 2 month trend @$11,750.
At $11750 (See circle), there is a major horizontal resistance point, in fact, one that has been a rest-stop for around 2 years now. More importantly we reach the top of our 2020 ascending channel and are almost certainly no way around a healthy pullback. We can expect a pullback from $11,750 to around $11,000 or if it breaks that, $10,500.
I drew a diagonal line in in black to make this look like a massive triangle, but it’s not. Triangles are typical over a few months, maybe you could stretch it to 6 months, but not two years. But this does establish a top trendline over the last couple of years, it tells us that anything over this line is an improvement to the previous top of candle descending trendline. The next big hurdle will be $14k to prove a long term bull price action. How great it would be if these smaller runs represented greater consolidation just before breaching a 2 year (not triangle) and going parabolic!
Its not all roses. There really is a fairly plausible chance that at $11750, we pull back all the way to the 5 year trendline as we complete this. Since we know the approximate width of descending channel, we are looking at probably $9500ish around June while also threatening to break below our 5.5 year trendline but offering a great entry point with a 5.5 year guarantee.
This is not investment advice, just sharing my observations, do your own research.
Also just some notes from our site vcdepth.io with integrated TV charts, we see that our global order books had gone from $1Billion to around $720Million during this route. We are now sitting at $860M and order books at 1% went from $283M to $260 million. BTC @ 1% orderbooks with overall books and bids and asks separately along with MACD and price action with a line chart, 20SMA, 50SMA and Bollinger.

Beautiful Ascending Triangle is forming in ETH/USDT
This triangle is another great opportunity for us to try and catch a cluster of green candles once it gets penetrated to the upside. As always, we are trading candle color and not necessarily the price. So as soon as green candle closes above resistance line, we will place a bet that the next candle will be green and keep on betting on subsequent green candles until the first loss. Since our wins pay fixed amount regardless of the price move, all we care about is the number of green candles.

CADCHF - Bounce from supportAs we can see, we have ascending triangle, which we hope the price bounces from to the upside. Good luck to everyone!


Higher high and low for AUDSGDJust a casual update on an earlier analysis posted:
Presently biased towards bullish.
AUD appears to have find support above the blue line -- previously acting resistance of the steeper downward channel since Dec 2018.
The pink lines forms the gentler downward channel started since 2017, expected to act as resistance levels for AUD ahead against SGD.
Expect AUD to be rejected at around 0.95-0.97 SGD to retest the support.
If AUD is able to pierce above 0.97 SGD and finds support, a follow-up pump is expected perhaps to ~0.99 SGD at the 38.2% Fib level.
If AUD is not able to find support at ~0.93 SGD, then expect a continuation of the descending channel (defined by the two blue lines), and expect price to go down and revisit 0.9 SGD.
