Current bullflag has morphed into ascending triangle bullpennantWe can see on the 4 hr chart the current bull flag has started to morph into an ascending triangle bull pennant. Probability is good it will break upward....that should trigger the cup and handle that is still in play if that cup and handle is valid....However this entire bull runs price action also appears to be trapped inside a rising wedge which are patterns that usually break downward...It is worth keeping an eye on because if somehow broke downward it's projected drop target could actually take it under the eve bottom trendline. I have marked it on this chart wth 2 blue trendlines. It was not the easiest trendlines to keep consistent so I'm hoping the wedge is invalid as I would really like to see this adam and eve bottom be validated and triggered. So hopefully the cup and handle is triggered instead and lifts us out of this potential rising wedge pattern.
Ascending

Ascending Triangle on Bitcoin - Possible Breakout of 9k?Hey guys, this is just gonna be a quick and simple TA on bitcoin.
Currently looks like bitcoin is trading in a rising triangle which would signal a nice bullish continuation, possibly leading a breakout of the log resistance.
Cheers.

Insecure BITCOIN-Bulls Finally Took The First Step- Awkwardness!Dear Friends! <3
Try to remember back when you were a teenager. Exactly - THAT awkward moment when you are with a girl (or a boy), and you are ready to go... And it's almost about to happen. But NOTHING is happening - something is holding back. The INSECURITY from both sides, just makes everything so awkward.
She is expecting you to take the first step - you are the man, right? Awkwardness... But..
Finally you take that the fist step, and then.. It worked out well! It wasn't that hard after all, huh?
So this is exactly what we have been witnessing with Bitcoin the last week. Nothing has really happened. I told you before about the zone of confluence support and resistance everywhere. We were caught in a small prison where we didn't have much space to maneuver around.
The bears have been trapped again and again. First with 3 lower highs (descending triangle), then a clear head and shoulder pattern, which also predicted we would go down, and the whales just went in the other direction and liquidated the shorts.
Yesterday I predicted another minor "trap". We were clearly in an ascending wedge and needed a smaller correction, but once again we saw how we immediately went in the other direction and up.
AND FINALLY today - an hour ago - we are now here, were the brave bulls took the first step we all have been waiting for! They broke out from the prison and went through the strong resistance at 8,2k-8,4k, and we are now at 8,500 USD. That's the lesson. Forget about insecurity, guys! Confidence is everything!
So far I still stick to my prediction from 2 days ago. We will go my yellow circle. But here it will be VERY interesting. Everything is pointing down from there, and we need some kind of retracement. But be aware of another bear trap, my friends! Whales could make another sick trap.
Last but not least, as I also mentioned yesterday, there are so much uncertainty with Bitcoin at the moment, that I don't even trade it at the moment. I make a lot of money at altcoins - think about it!
D4 Loves you <3
Please give me a BIG LIKE - It will make me happy - and once again, thank you for following me - I REALLY do appreciate it :)

RONALDO Will Now Tell You What BITCOIN Will Do - Are You Ready??Dear Beloved Friends <3
D4rkEnergY - TA's answer to football's Christiano Ronaldo will now tell you, what's going to happen with Bitcoin! Ronaldo scores goals again and again and he gets the girls he wants! D4rkEnergY does the same... The comparison is accurate!
Ooh, ooh... with a TITLE like that, and a PREFACE like that, I can feel them coming.... :D
It's called seduction - You know D4rkEnergY is only here to spread love and wisdom - he loves everybody - also his haters!!
Ok. Are you ready for one more goal? Ronaldo will this time take a look at the 1D BTCUSD Chart. In fact, it's ONCE again a super interesting situation we are facing. We have been going sideways for 6 days after the sick spike. And it's not that surprising after all.
As you can see we have super strong support from our up trendline. On the other hand we also have strong resistance from Point of Control (Volume Profile - longest node where most trades are generated in the past at the given price point). And then we also have have EMA50.
So now what? The most likely scenario is that we will continue our journey up at the ascending wedge. Expect we will reach 8,650-8,840 USD before we will fall out - AND hereafter we will probably crash down to under 5,000 USD eventually.
BUT - Don't worry, guys! We first need to make a double bottom, but after that, it will just be a matter of time before we will make a new All Time High and reach +20,000 USD!
Ronaldo Loves You <3
As always - Remember to give a BIG LIKE! It's much appreciated - thank you in advance, my friends :)

Same Idea as previous just with updated price targetsJust realized I updated my last idea without updating the price movements of the 50ma, 200ma, ascending grey trendline, and pink eve trendline...I also pointed at the golden cross a littlebetter. Please refer to my last idea for more in depth analysis on all these things. I am short term short, but still long term long. Good luck thanks for reading I will post a link to the previous idea below.

VEN April 17, 2018 - BEAR MARKET WINNER CONTINUES UPWARD!!!See chart for embedded notes on where I believe VEN will lead next. This one has been a huge winner during the meltdown so what will it do now that the Crypto's are much stronger? I expect VEN continues to set records but lets see what the chart can tell us.


MISSION IMPOSSIBLE: NEO About To Destroy BITCOIN! (NEOBTC) Hello Dear Friends <3
We have no time to waste. We are this very moment witnessing a CRAZY battle between NEO and Bitcoin. Let's take a closer look at, what is happening, and maybe we can figure out, which of the coins there will be a better holding.
We are now taking a look at the 1D NEOBTC Chart. So NEO had a really nice run in December to the end of January and made some solid 1-5 Elliott Waves. After that we had an ABC-correction. A weird one. Looks like a 3-3-5 where the 5th wave of C is truncated.
It had a bit more than a 61,8 % Fibonacci Retracement, which is pretty normal and healthy. NEO did hereafter kick start, what I will assume it's a new 1st EW. Look at that beautiful uptrend. But we are at this very moment at a VERY CRITICAL point for NEO.
NEO is struggling and using all it's power to go through the 50 % Retracement Level AND the EMA50 AND the EMA100 just a bit higher. But NEO is doing a tremendous job so far, and are showing no signs of weakness.
We are at this moment in an ascending wedge pattern, which normally predict we will go down very soon. Here are the 2 scenarios:
1. We will fall, but only a bit, what is equal to a 38,2 % retracement of the 1st wave and hereafter NEO will use that 3rd Wave to SLAM BITCOIN in the face and continue up, up and up!!
2. NEO will ONCE again surprise us and just continue further up, and will not give a fxxx about normal TA-rules and theory, and then hereafter have a smaller retracement above the EMA's.
NEO seems unstoppable at the moment. Even Bitcoin, who normally fare better in a bear market with uncertainty, seems to have found a new stronger new up- and coming superstar!
D4 Loves You <3
Please leave a like - it would make me happy :)

Education: The ascending wedge. BNBBTC ExampleThe ascending wedge is a pattern in price action that has an uptrend with higher lows and higher highs, however the lines that connect the lows and the highs are tightening. This usually suggests that bull strength is running out, as every rally running toward the resistance is shorter lasting and moves less in terms of price action.
Ascending wedges can break to the upside as continuation, or to the downside as reversal. However they don't usually reverse the underlying, longer term trend. The standard target on a bearish entry on the break of the ascending wedge is the starting point. You can see in the BNBBTC example that the price reversed up very close to the same level that marked the start of the wedge.
Sometimes the ascending wedge will break bullish, to the upside, but the chances of that are lower as the support line is rising faster - what this means is that if the price traded sideways, it would eventually break the support line and thus the bears need less strength to break that support line than what the bulls need to break resistance.
In this example the ascending wedge is going with the trend, as BNBBTC is very bullish on the daily and weekly, as such the expected outcome of the ascending wedge is not a trend reversal, rather it is a retracement back down to the starting level and likely continuation to the upside in the medium term. An ascending wedge during a downtrend is much more likely to be a continuation pattern, and short term bulls that played this wedge should make their exit as soon as there is a close below the support line.

GBPHCHF Channel breakout Price has appeared to broken out of the recent ascending channel, we have highlighted where we think price will retrace to.

4hr bearflag teetering on the verge of a bearish breakdown.Not looking good folks..we can see a bearflag that has been forming on the 4hr for awhile is threatening to break bearishly....you can see the projection of that drop would send us all the way under to the grey ascending trendline which bounced us back up from our biggest low of the year and hasn't been encountered for over a month since that time. It has made strong support in the past and I see no reason why it wouldn't this time around too but always consider the worst case scenario possibility of it breaking down under that as well which I think could only occur if the massive head and shoulders that MagicPoopCannon is claiming is actually actually head and shoulders...if so that could send the market as low as $54000 for a brief while.....It's also very possible that a bearish breakdown from this current 4hr bear flag could still send us all the way to the ascending grey trendline and the grey trendline bounce us back upward quick enough that we never get a chance to actually trigger or confirm the head and shoulders....I think one of these 3 outcomes will happen...bust to consider the potential of all three and have a good game plan ready...If we confirm the bearflag breakdown I will likely go short until just above the grey ascending trend line.You do you though, as this is not financial advice.


BTC hits ascending wedge drop target, flirting w/ h&s breakdownBTC has just reached the target price drop of the ascending wedge breakdown shown by the purple dashed line. WWhile it doesn't surprise me it hit this price, it does worry me, because now we are in real danger of breaking below the neckline of this current head and shoulders..we have already sent a wick below it. In order to break it we will need at least 2 closes below the neckline on the 4 hour chart. Even then its not a guarantee that its not a fake breakout but the probability and odds are then at that point greatly in favor of a successful breakout. However 2 closes on the 1 day chart under the head and shoulders neckline will indeed signal a valid head and shoulders pattern. If this happens we may possibly plummet below my grey ascending trendline and possibly dip even lower than februarys low which is a very scary thought. So these next few candles are clutch. I'm still hoping we will eventually find strong support and a huge bounce back up from either the grey ascending trendline or just under it at the same price as februarys low thereby creating a massive double bottom pattern. The latter would probably be preferable, as it would have greater potential to take the price far higher. Anyways be careful out there if you aren't already still short, and you see 2 confirmation candles below the hea and shoulder neckline it may be wise to go short at least until right above the grey ascending trendline or possibly right above it if you are fishing to trigger a limit with a wick. A more adventurous trader may try to put their limit buy back in just above the low of february. As of right now technically the inverted head and shoulders pattern is also still in play because we haven't gone below its head but I have taken it off the chart currewntly as to not muddy up things with overlapping h&s patterns.

Intra-day play - ascending triangle!On the hourly we can see that a nice ascending triangle is forming.
1/ We have confirmed 3 touches on the support and multiple flush touches on the horizontal resistance. I anticipate that this will be a small breakout given the overall bearish market.
2/ Given previous price action we could potentially test 8.5k but this will depend on buying power. If you want to play it safe take profit at 8350 or 8450.
Give me a like, let me know what you think and give me a follow!

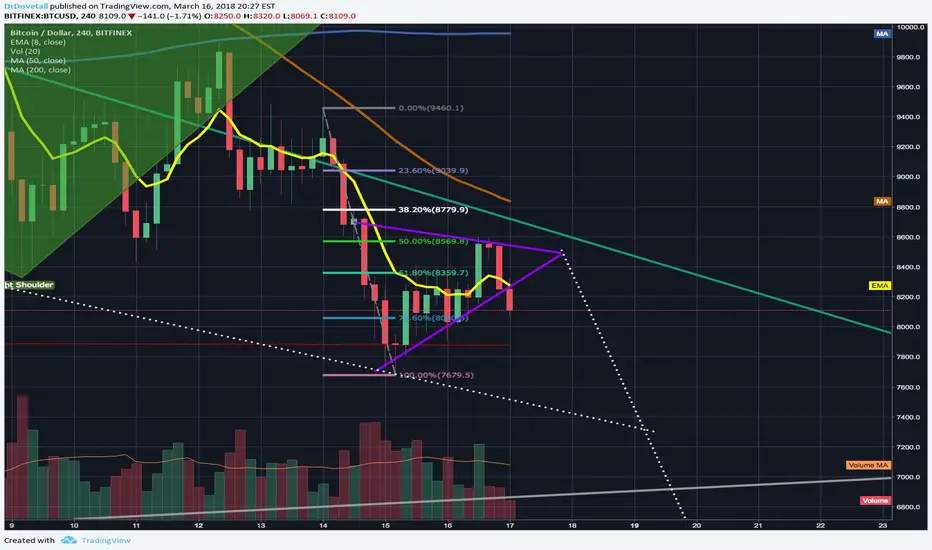
Ascending wedge possible hinting at further downside?Lots of short signals here. The first one is that wre now have yet another 1 day candle closing below the 200 MA. The second big one is on the 4 hour chart where a day or 2 ago the 100 SMA did a death cross under the 200 SMA and is currently continue to trend donward from it, leaving us with the 100SMA under the 200SMA and the 50SMA under both of those..all strong sell signals. We also just closed the last 4 hour candle back below the tline which is usually a good sell signal....and finally we have now an ascending wedge which tends to break bearishly downward especially when compounded with all these other sell signals. I think we could very well break downward form the wedge and diop as low as the 00% fib retrace extension level at around 76...to ensure I buy back in before any bounce abck up though I'm not gonna try to catch the bottom and instead have set 7749 as my arbitrary limit buy back in number. Hopefully this time it actually hits that...my previous limit buy order was $100 too low of the last recent dip and I missed out on the profit taking of the recent temporary bull flag.
ESA: Make it or break it timeESA has been trading in an ascending wedge since the Feb correction and is now testing the 78.6% retracement level; Just like back in 1929 and 1987. I don't like the odds here so would be neutral...ok, bearish if you put a gun to my head. Trumpard is making me worried.

Bitcoin is doing something.>Possible ascending triangle formation.
>Huge resistances ahead viz. 11.3k , 11.7k , 13k
>If it is an ascending triangle breakout,then Bitcoin will find new support around 11.7k level.

Here Is A Bitcoin-Scenario You Need To Be Aware Of - Must See!Dear Friends!
How do you become a good trader? Do you think you are good at predicting things? D4rkEnergY has said it before, but he will say it again:
Good forecasters all share one trait (besides being intelligent): open-mindedness . In everyday life, open-mindedness may be mistaken for having liberal political views, but in psychology it is thought to reflect how well you deal with uncertainty. Crucially, open-minded people tend to be able to see problems from all sides, which seems to help forecasters overcome their preconceptions in the light of new evidence.
So what does that mean? You probably remember, when I made this prediction 2 weeks ago? 2 Bitcoin-Scenarios You Need to Know About - The Chosen Ones!
2 weeks has past, and D4s 55 % scenario has so far been spot on. But we now also have more data, and we should always be open for new ideas and new plausible scenarios. And therefore, here is a new one, you should be aware of. It doesn't change that much, but it is important to pay attention to.
So let's jump in! We are taking a look at the 2h BTCUSD Chart. Let me just throw it out immediately. D4 is still super bullish on Bitcoin! We are still in an uptrend and the 1D and 4H chart also look bullish.
What I have shown in this chart is called a leading diagonal (the ascending wedge). We here assume, we are on the 3rd Elliott Wave. I don't want to go too much into Elliott Wave Theory, it might be too complex. But when we are talking leading diagonals we are allowed, as you can see, to let the 4th subwave go into the 1st subwave price territory. Anyway. So the 1st EW, in this scenario, started from 5,9k and went up to the yellow dot.
As we know ascending wedges are bearish, and as you can see, we also fell out from it. At this very moment we are going sideways, and a bear flag has been created. IF the bulls don't manage to push the price higher very soon, the bulls will be exhausted, and we will fall lower.
We will probably fall to around 10,7k which is equal to the 38,2 % Fib Retracement level. Hereafter we will go up again and test the inverse HS pattern. And we are back where we started.
So here is D4s advice to you guys: Always keep your eyes open for new ideas, and new plausible scenarios. Be open-minded when you trade and also in your life.
D4 loves you <3
PS. Please give a BIG LIKE and FOLLOW. I now got more than 700 messages from people who wants to be 1 out of 100. Guys, be patient. D4 will reveal everything on Wednesday, and how to become One of The Chosen Ones.


EURUSD - Bullish 4h/1D Ascending triangle on the 4h and weekly fib 0.5 level are providing bullish signals for a retest of the previous high. Also, there has been slightly higher highs and higher lows.
I have a scout order for 1.229 if there is no retest of the fib support.
Full position order (2% risk)
Entry: 1.218
TP: 1.25537
SL: 1.2161

CONFIRMED: RIPPLE will go even lower - 78,6 % retracement level!D4 with an quick update on Ripple. 15min XRPUSD Chart.
The bears will probably win one more time! EMA50 as huge resistance, and EMA200 on 5min chart right above our head. Ascending wedge on the pattern and RSI. Bear flag.
It seems like it's just a matter of time, before the bulls must give up. It would be a big surprise if the bulls manage to win this battle!
OUT
D4rkEnergY is everywhere
D4rkEnergY predicts everything

1day chart's 50ema catches bulls & keep them in the rising wedgeSo we had a crazy plummet yesterday. We were long overdue for a retracement and this one was caught by the double reinforced support of both the 50EMA(in blue) and the bottom trendline of what I originally thought was just a channel..after adjusting it to the recent price action I have discovered instead it appears to be a an ascending wedge. The pice has stayed true to this wedge every since the most recent bottom so its definitly a strong source of both resistance and support. Interestingly enough the second inverted head and shoulder target I set up in the 15000s is, as you can see, the exact same price level as where the ascending wedge ends when I drew it until both lines converge...could this be simply coincdence? Who knows but it could be that our secondary head and shoulders breakout target price is valid after all. We shall have to wait and see...the closer we get to it the less the price action is gonna be able to move. It was comforting after we started the new days candle to see the 4hour chart ater a couple red candles throw out a green bullish reversal hammer patern. I'm still cautiously optimistic that with the strength behind this ascending wedge...it can help take us all the way out and break above the descending channel we've been captive of since december.

