ETHUSD Ascending channelDespite the 50 plus day of the current corrective market, ETH has remained resilient with an RSI over 45 and way above the 100-day moving average on the daily charts. ETH is currently in the middle of the ascending channel at about $1106 USD. I am holding my current core positions till it reaches the top or bottom of the channel to determine my next course of action.
**NOTES**
I am not an experienced trader. I am an investor learning TA. So please, take it easy on me.
DO NOT use my published ideas for making decisions. Recommendations are welcomed.
Again, I am not an experienced trader.
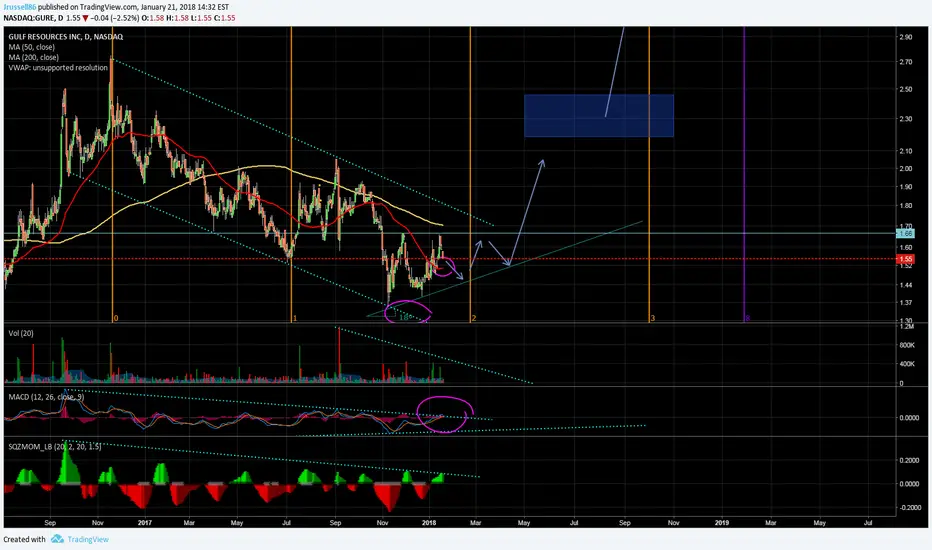
Ascending

Ascending triangle forming Within *8 year Symmetrical triangle.
50Dma now tilted up. *>50% Undervalued.
DCF Models put fair value @ 7.06-19.88
D/E&DA <.01; *Current Ratio≈36*
Ascending triangle forming since November brings opportunities to accumulate at safer prices. This daily formed after bouncing off bottom downtrend boundary. Ascending triangles are bullish in nature as demand line rises towards supply line, but are not reliable upward breaking patterns however they do show that sentiment may be changing and that a reversal may be near.
This Ascending triangle is forming within and near the lower boundary of an 8 YEAR symmetrical triangle.
MACD crossing above 0 on daily signalling upward momentum.

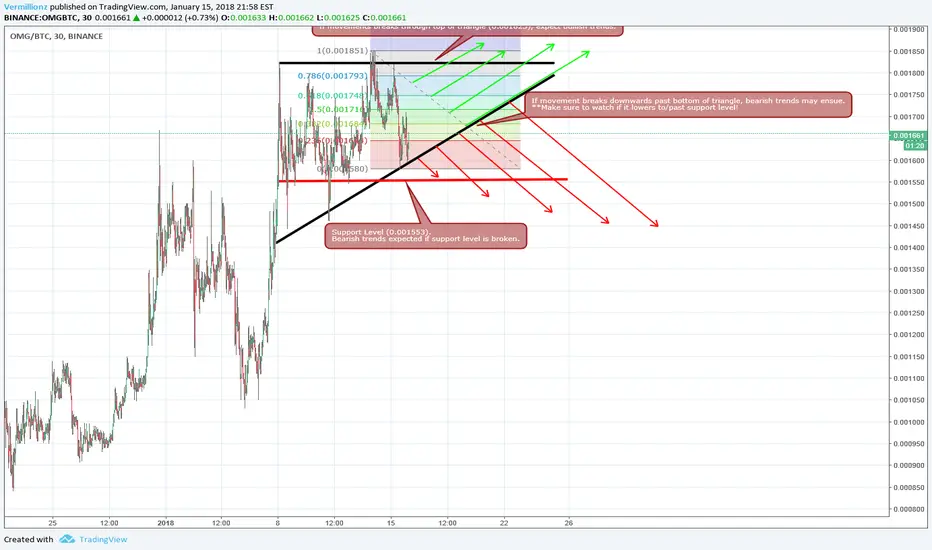
OMISEGO - ASCENDING TRIANGLE - 1/15/18OMISEGO looking to breakout soon, might be longer than hoped though.
Chart showing an Ascending Triangle, marking possible bullish movement.
If support levels are broken, stop loss is advised.
Overall Market is currently a sea of red, holding back any possible tremendous growth. If market begins to pick up again across the board, OMISEGO predicted to go a nice strong bull run.
My personal hopes are that NEO holders/short term investors flip into OMISEGO as they have done plenty of times before.
OMISEGO is, in my opinion, one of the strongest cryptos for 2018 and has a lot of room for massive growth. A great long term hold.
Trade to bottom of wedge - Legendary Trade4:1 risk reward ratio.
Will be selling to the bottom of the wedge structure.
Ascending triangle.
Fibonacci Pullback.
TP - 1 At 150.
TP2 - for 500 pips.

GDPUSD: Ascending triangle pattern (Wait for confirmation)After GDP:USD hit a double top at the resistance I've been bearish ever since. I think we will breakout of this ascending triangle pattern.
Wait for confirmation at the lines of the triangle. If breaks down, set a short trade & the target will be the trend line.
If stop-loss is broken go long.


TIX ascending triangleTIX is close to break out of its ascending triangle.
Here you can see my targets for TIX,
Just keep and close eye on the lower part of the triangle so TIX doesnt break down.


Daily Structure on GBPJPYCurrently price on GBPJPY is not at a considerable place for a buy. Wait for the 147.000 area before considering buying this pair.

Charging up the Bitcoin Cash BCH/BCC Lightning RodBullish Ascending Triangle of the Elliott Wave Principle
Charging up
the Lightning Rod
On Rising Bullish
Support Levels
Maybe we will see the 4-6k range for Christmas. Who knows...
All the best

ETHUSD - Ether on its way to 650$Unfortunately, my first analysis up here on tradingview did not work out (pattern was never confirmed), so today I thought it's time to give it a another try. After all, it's not to late for some beginner's luck.
Over the last months Ethereum formed a ascending triangle pattern that may not be perfect but sure looks good enough. Ether breaking 400$ with highly increased volume is the confirmation I've been waiting for for quite some time. MACD gaining momentum strengthens the pattern further. Nothing more to say here.
Despite being not sure about the future of Bitcoin, I am pretty sure about the future of Ethereum. I really do think it's here to stay. In contrast to Bitcoin, Ethereum has one huge advantage: utility for the "normal" economy and companies. And after all, those people have a whole lot more money than the current crypto community.
Disclaimer: This is no investment advice and I'm by far not an expert. You should not buy, sell or do anything else just because of my analysis.
I'm glad for your feedback.


LTC/BTC: Ascending Elliot Wave #5?Looks like LTC is getting stronger as BTC consolidates around 10k and tries to break to new highs.
RSI is in the 50s which acts as support level for the moment. This also means that there is enough room for the price to go up.
Let's if the market keeps the momentum.
Trading is not perfect...


BITCOIN - 500-700 points potential with just 200 points loss BUY at 8400, Target of 9000 in few hours. Stop at 8200

ETHUSD - Ether on its way to 650$Unfortunately, my first analysis up here on tradingview did not work out (pattern was never confirmed), so today I thought it's time to give it another try. After all, it's not to late for some beginner's luck.
Over the last months Ethereum formed a ascending triangle pattern that may not be perfect but sure looks good enough. Ether breaking 400$ with highly increased volume is the confirmation I've been waiting for for quite some time. MACD gaining momentum strengthens the pattern further. Nothing more to say here.
Despite being not sure about the future of Bitcoin, I am pretty sure about the future of Ethereum. I really do think it's here to stay. In contrast to Bitcoin, Ethereum has one huge advantage: utility for the "normal" economy and companies. And after all, those people have a whole lot more money than the current crypto community.
Disclaimer: This is no investment advice and I'm by far not an expert. You should not buy, sell or do anything else just because of my analysis.
I'm glad for your feedback.

Ethereum open tradeOur Ethereum trade is playing out nicely, we are expecting a slight retrace, then a continuation to the upside.

Example of an Ascending TriangleGBPAUD formed an ascending triangle. We could see a horizontal upper line (that would be a resistance) and a lower uptrend line (that would be a support).
Prices moves with equal highs, and lows higher than previous.
Then after a few attempts, the prices finally break through resistance.
The ascending triangle is a continuation pattern. Prices come from an uptrend then prices bounce inside the triangle before breaking higher.
To confirm the breakout, the price should close above the resistance line, if so, make a long. The profit target is the distance away as the back of the triangle.

Ascending Triangle NZD/JPY 1H Long. Ascending Triangle pattern on 1H Chart. NZD/USD and USD/JPY both in immediate term uptrends on their 1H timeframes as well which should provide minimal pressure from bears to hinder NZD/JPY from going higher should the pattern provide a buy signal with a break above most recent highs. Measured move for profit target comes in very cleanly at next resistance level.


XRP/USD 10/26/2017WITH THIS CONTENT CRYPTOCURRENCY CAPITAL LLC OR ITS AFFILIATES DO NOT PROVIDE INVESTMENT, TAX, LEGAL OR ACCOUNTING ADVICE. THIS MATERIAL HAS BEEN PREPARED FOR INFORMATIONAL PURPOSES ONLY AND IS NOT INTENDED TO PROVIDE, AND SHOULD NOT BE RELIED ON FOR, TAX, LEGAL, ACCOUNTING OR INVESTMENT ADVICE. YOU SHOULD CONSULT YOUR OWN INVESTMENT, TAX, LEGAL AND ACCOUNTING ADVISORS BEFORE ENGAGING IN ANY TRANSACTION AT YOUR OWN RISK.
