Ascending within Ascending Channel + Breakout bear Flag entryPotential Reversal play within the HTF Ascending Structure, the ascending within does not look complete yet. Will only take the Correction After the breakout (CAB) entry on this, no risk entry.
Ascending

DOTBTCI think we might be seeing an inverted head and soulders pattern in daily chart from DOT/BTC. Upside potencial goes to aproximately 0.00075 by this pattern. Shall we wait for the confirmation. In the way to the high point of the pattern it might be a resistance from a suport point of the last bear, breaking could throw the prices above the pattern prediction.

An ascending wedge pattern is near to break downside!In continuation of the previous post, a nice ascending wedge pattern is near to break downside! what does it mean ?
1- Ascending wedge pattern most of the time informs us about a reversal in the market, mostly in combination with other signals
2- The amounts of this decline is measured by its altitude, in our case, it is 40.5K
3- Remember it needs a proof for breaking its lines (in the case of decline= lower line), so don't hurry but wait for it then get a short position or wait for your desired price to get in (get a long position)
And don't forget; if it is not able to break the lower line, it will go up slightly to reach upper line and test it again and again to finally break one side and move as fast as possible.


Ascending wedge coming to the end on GoldWe are in a bearish move down where gold is forming an ascending wedge, looks like plenty of short term downside here to grab a few points.

Google Trade Opportunity Google's price has been in a clear ascending symmetrical channel for almost 10 months now. The bias on this should be bearish, however, Google has just bounced once again off of the lower level of the channel thus confirming it as support once more. Downside risk is around 2.5% as a return to the lower trendline would not be out of the ordinary. A break and close below the trendline on the weekly will be enough to refrain from seeking any further immediate longs.
Your profit taking target will be the top of the channel which is currently sitting at around 12% to the upside.

BNBA won't waiting any LONGer..!BUY strat..
SPEC Buy: NOW 1530-1655
GOOD Buy: IF Break 1660
Swing Target 2445
CL at 1300 (-17%)
Good Luck!

NZDCAD - possible wildcardhi everyone - haven't posted in a while but im back on the charts!
looking over the pairs NZDCAD has caught my eye, after breaking an ascending structure on the daily sitting nicely in the amber zone. price shows a clear 'scoop' (double top) with an element of structure that can be seen approaching the value area on the 4H. i am looking for an entry in the green zone on the lower degree next week if price is to form an element of structure, given the price action previously and the aggressive sell off, i will be inclined to take a RE in this area. if anything else is to form, confirmation and a lower time frame continuation pattern will do just nicely!
dont sleep on this one!
have a good week everyone!
Connor

Technical analysis of bitcoin chartsIn my opinion, as I explained in the previous post, this bitcoin chart chart will continue until almost the end of July, and we will have to wait and see what happens next.
I think there are two events ahead of Bitcoin in late July
$ 25,000 Bitcoin Or $ 45,000 Bitcoin

Audio, time for correction or?Will AUDIO do some correction or will it act like AXS? I will wait and see but don't want to miss this one, long or short, never mind...

[AXSUSDT] Time to shortHello everyone
I think it's time to short AXS
Huge RSI divergence on 4H timeframe + end of ascending wedge
First support is around $14-15 on Fibo 0.236
Not a financial advise, do your own research
Good luck everyone :)

$OXBR ASCENDING BROADENING WEDGE$OXBR ASCENDING BROADENING WEDGE, scaling up exponentially...
CONSECUTIVE HIGHER BOTTOMS
Oxbridge Re Holdings Limited, together with its subsidiaries, provides specialty property and casualty reinsurance solutions. It underwrites reinsurance contracts primarily for property and casualty insurance companies in the Gulf Coast region of the United States. The company distributes its products and solutions through reinsurance brokers. Oxbridge Re Holdings Limited was incorporated in 2013 and is headquartered in George Town, the Cayman Islands.

ADA falling wedge, ascending triangle and cup and handle?ADA looking extremely healthy here guys. we have a clear uptrend over the last days, broke out of the falling wedge and the ascending triangle, and also kinnnnnnddd of forming a cup and handle here as well? price targets are very similar and give a clear path for ADA should the market cooperate. possibly the healthiest looking alt coin if you ask me. i personally have been accumulating a lot of ADA as she feels like a sleeping giant righht now and i think in one year we would kill to get ADA at sub $2. lets get this money guys

BTC ASCENDING WEDGE, DESCENDING VOLUMEon the 4 hour chart, I am seeing an ascending wedge which appears to be accompanied by decreasing volume.
Also, the candlesticks have not surpassed the 50% Fibonacci zone, which leads me to believe that this is not a false pattern.
If the pattern is correct, then another dip can be expected, breaking the ascending wedge pattern. My guess is that BTC would find support around $29,000. I would love to hear your opinions. BITSTAMP:BTCUSD

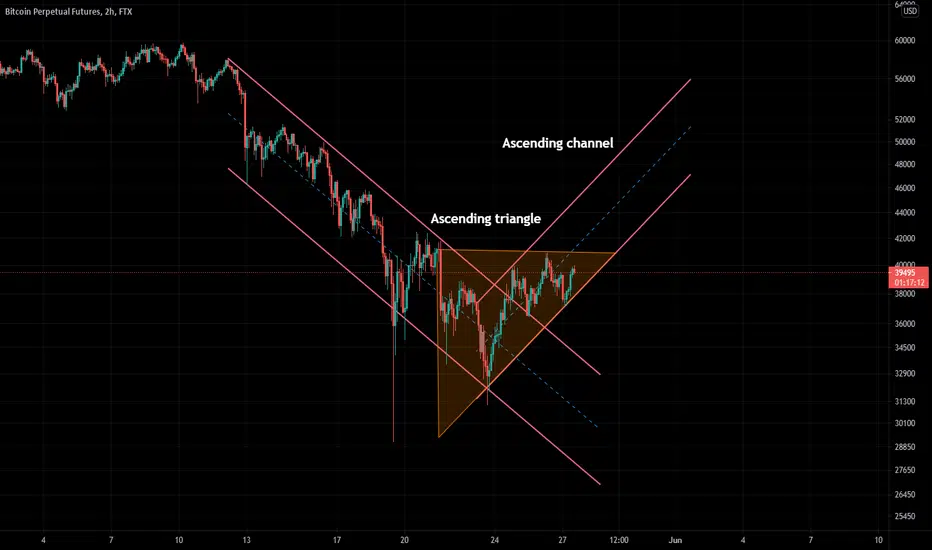
Ascending triangle breakout target 42KHigher higher lower lows on the 4hr chart. A break out of the ascending triangle should result in a breakout of critical assistant to 42K which is significantly important as it will break above the 21 week SMA and flip the narrative bullish on bitcoin on the daily once again.

ADAUSDT ADA CARDANO Ascending TriangleLooks beautifull to me, both scenario's are there on the table.
trade safe.. hit the like and follow and be free to give a comment.

bullish on btc. playing out well in this ascending trianglejust a quick idea ive been watching this pattern for a few days now and playing out well imo, i can see us going to the upper line of the pattern , time shall tell,

EURCHF - How To Trade This BreakoutEURCHF is within a descending channel of an ascending channel... pretty confusing I know but have a look at the chart and you can see which way price will be heading. What we need to do now is find the best entry which is safe and clean.
From the diagram in the chart, you can see that our entry will only be after the break of the descending channel and after a bullish correction such as a bull flag. We need to make sure that price has the momentum to move up so we will be waiting for a breakout of the bullflag before entering with stops below the correction.
Goodluck and trade safe!


Ascending triangle suggest a rally for ETHOn ETH we have an ascending triangle. The resistance of 2900 usd has to get broken to trigger a target of 4400 usd.

#centralBank about to moon soonLong term accumulation happening for a few years now
once we breakout expecting a good move!

NASDAQ is in ascending trendNASDAQ broke a downtrend and pull back to it. it may keep going bull trend.
