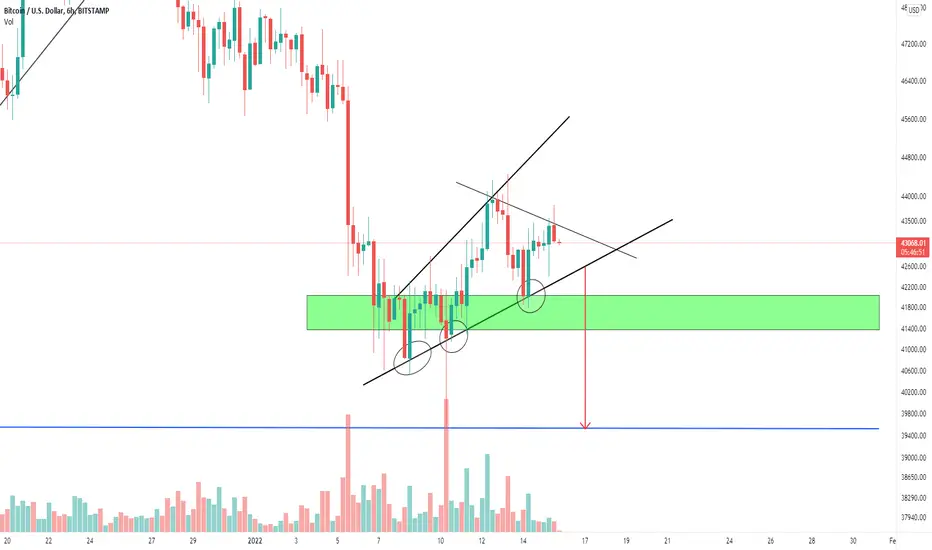
Ascending Broadening Wedge

ES1! (S&P 500 Futures) and NQ1! (Nasdaq Futures) Ascending WedgeBoth the indices showing the Ascending Wedge Pattern. I would like to see the break of support around 11266.75 for NQ and 3700.00 for S&P to short but ideal entry would be on the break of the pattern + re-test of the support trendline.
Targets for NQ1! -
11228.50
11165.50
111068.75
Targets for ES1! -
3700.00
3661.50
3642.00
NOTE: This pattern is forming right before OPEX (17 June 2022) / Quad Witching. Maybe this market pushes up before the volatility comes in and OPEX plays out where a decline in stocks is observed around the end of the day.

Is $XLE making a bearish ascending wedge?It seems like the Energy sector ETF $XLE is making an ascending bearish wedge.
It's showing lots of resistance around the $82.9 area and hasn't be able to close above it for the past ~2weeks.
I wouldn't be surprised if it has a fake breakout to the upside before eventually falling back inside the wedge.
Keep an eye out for a break to the down side as the measured objective would be around the $64.7 area.
I'm neutral for the time being but keeping a close eye on this for a bearish reversal.

USDT.D Dangerous time | Long TermIn my opinion, with the formation of the cup pattern in 1h timeframe and the wedge pattern in the downtrend, we must accept that the time has come for the price to fall.

Ascending Broadening Wedge Breakdown on ROKUI will be targetting the 1.618 Retrace from the Previous Low to High on this short trade.

long term logarithmic growth fan pattern horizontal supportthe gann fan and log view with broadening wedge indicates stock is trending toward long term support. if we cant close over the 4/1 monthly its probably headed for that lower trendline. were at horizontal support so a bounce starting here would probably head for the 2424 area. closing above the mid 2400s and we could head for 2988 where TRAMA is currently hanging out. if 2050 breaks it could go as low as 1785 but its much more likely we see a monthly bounce soon.

AUDUSD Roadmap on 4H timeframethe dollar went down due to the shock of energy price and it help Aussie goes higher. my analysis shows 0.76480 key resistance might end the AUDUSD bullish trend and also complete the ascending broadening wedge pattern for this pair, personally, I will wait for the price rejection occurs at the key resistance level before placing any sell order. good luck traders!
**Disclaimer** the content on this analysis is subject to change at any time without notice, and is provided for the sole purpose of assisting traders to make independent investment decisions.
Traders!! if you like my ideas and do take the same trade as I do, please write it in a comment so we can manage the trade together.
_____________________________________________________________________________________________________________________
Thank you for your support ;)
GWBFX

Luna to $130 or $60?Following on from my LUNA chart using EWP, I've drawn a simpler chart with TLs, a Doji and an ascending broadening wedge. The red TLs, Doji & the ascending broadening wedge (ABW) suggest the drop to $60 favours the yellow TLs rise to $130+
Furthermore if we look at the RSI on the smaller TFs, 4H, 2H & 1H you can easily see that LUNA is overbought.

Broadening wedge ready for LONGWe have a ascending broadening wedge and it's time to go up. Take a part in the journey and collect the pips.

Ascending Broadening Wedge on BTC chartWe have this Ascending Broadening Wedge on the 4 hourly time frame. As we see on the social media everybody is bullish again and that's the point where i am looking in the other direction. I exited my long position from 37.7k because of the bearish divergence on the 4 hourly and entered short postion at 42.2k.
Ascending Broadening Wedge is a bearish pattern and we already have a break out and retest of the support line now turned into resistance.
What do you think about this Ascending Broadening Wedge?
Feel free to leave a comment.
If you like my ideas please follow me and like the post because i am posting every day and you can find always something interesting on my profile, i am new to Treadingview but i have 6 years expirience in trading.
BTC TO THE MOON!!!

Ascending Broadening Wedge Visible on Weekly Time FrameWe gave Double Bearish Divergence on the RSI and are at the Supply Line of this Weekly Ascending Broadening Wedge. We are however very near 100 an di wouldn't be surprised if it just came to visit the area's of 100 before coming down but at this point in the chart would be a nice place to take profit or take a shot a being Bearish.
As of right now the put options are very expensive for this stock most of the puts are trading at about 3-5 times the price of the calls for the same strike so we will have to wait for those puts premiums to go down but if they ever do it will be a nice entry.

Video: New Pattern to Watch For on the Bitcoin Chart!Traders,
I think this ascending wedge should be something we put on our radar here. With fairly recent bullish price action along with our VERY strong support below, the probability that it plays out is LESS LIKELY than normal, but it does appear that BITCOIN is drawing a BEARISH ASCENDING TRIANGLE here. This may be further confirmation that the HEAD AND SHOULDERS pattern I have drawn in PURPLE will indeed play out and meet it's target down of $20-24k. Remember, I have doubted whether or not this will actually occur all along.
So, now we have yet another pattern that seems to indicate there could be further downside in the cards. An exit to the UPSIDE of the TRIANGLE would be very BULLISH. An exit to the DOWNSIDE of the TRIANGLE would be VERY BEARISH and with confirmation on the daily, I would then expect us to reach our TARGET DOWN of $20-24k. Again, confirmation to the downside would be very important. A breach of our support is not enough. We would need a second candle to open and close below support (BLACK ASCENDING TREND LINE) and preferably a third candle to follow suit.
For now, the market remains inside this TRIANGLE, which I have called the FUD ZONE. Until anything significant is determined geo-politically, whether positive or negative, I don't think our station inside the triangle is going to change much. I expect us to remain inside the triangle, unless and until the market receives news (good or bad).
This is just one more indicator to add to your array.
Please be safe with your trades at this time. I wish you only the best.
- Stew

ETHUSDT needs to hold the supportOn the upper chart, we can see the daily timeframe where the price got rejections from the dynamic resistance and the weekly one on 3k.
The price is testing a daily support and the market is trying to hold it on 2560$
On the lower timeframe the price is going to retest the previous zone as new resistance, we could see a pullback on 2610-2640.
How to approach?
We are monitoring the price, if the price is going to have a pullback and got a new rejection from the previous support and retest the daily resistance, According to Plancton's strategy , we can set a nice order
–––––
Keep in mind.
🟣 Purple structure -> Monthly structure.
🔴 Red structure -> Weekly structure.
🔵 Blue structure -> Daily structure.
🟡 Yellow structure -> 4h structure.
–––––
Follow the Shrimp 🦐

Broadening Wedge Viewpoint For visual assistance to my previous idea. Indicates a potential breakdown coming at the support line if price tests the line 3 times without pivoting.

Bearish 5-0 Entry Below Ascending Broadening Wedge Demand LineJust Like BTC Did a Few Weeks Ago , The SPY has broken below an Ascending Broadening Wedge Demand Line and has formed a Bearish 5-0 at the tail-end of the breakout. The Reciprocal AB=CD PCZ of this Bearish 5-0 takes us to the 55% Fibonacci Retracement and that's where we closed today. If we get follow-through price action we should see the SPY Continue Downwards from here and perhaps fulfil the Measured Move of the Ascending Broadening Wedge and take us all the way back down to $344.43

Atom ATOMUSDT - Bullish head and shoulders + ascending channel- ATOM is one of the greatest looking coins at this moment on Binance.
- We can see on the weekly chart an inverse head and shoulders pattern with tripple TOP resistance.
- ALL coins dropped hard, but ATOM's uptrend is still intact as the ascending channel still holds.
- Check my related idea about ATOMBTC chart below! It is very bullish.

BTCUSD Looking to Retest $39000 LevelGood Day my fellow traders! As you can see from the chart on the 6hr, BTCUSD is currently trading inside a Ascending Broadening Wedge. This is know to be a bearish pattern. Thus far, we have three touch points on the support trendline, falling below it will confirm breakout and give a target of $39600.
Disclaimer: I'm NOT a financial adviser...just a regular "joe" voicing my opinion :)
Peace Love Money ;)
Ascending Broadening Wedge *Update* BTC*UPDATE*
The wedge has broken out to the downside as expected. Current target is $38.8K.
Note: A further pullback below this target can happen. BE ADVISED :)
Disclaimer: I'm NOT a financial adviser...just a regular "joe" voicing my opinion :)
Peace Love Money ;)

BTC (Ascending Broadening Wedge)Large ascending broadening wedge for BTC. 80% chance the price will break downwards. Look like a potential form of a complex HNS, shoulder not yet form though.
BTC 1H

Breakdown Ascending Broadening Wedge of ADROADRO forming ascending broadening wedge and already broke downt its lower trendline and is valid on its pattern with bearish divergence. potential downtrend minor if buyer still strong and have a ton of good news with good IHSG movement

AAPL Rising Wedge Break Weekly Options PlayDescription
AAPL has broken out of an Ascending Wedge to the downside following an ATH just over 182.
Ascending Wedges are at most intermediate in their trend implication and represent a general petering out of investment interest as the formation progresses and the stock becomes more expensive. Wedges typically take at least 3 weeks to form, otherwise they would be classified as a pennant. Also, prices usually travel 2/3 of the way through the formation. These are two technical facts we see here when using the bounce on 26NOV to 02DEC as the start of the pattern.
The resulting price move implied by the pattern is equal to at least an entire retracement of ground covered by the formation of the Ascending Wedge, to 156.75.
Using a Long Put combined with a Call Credit Spread here in lieu of a Put Debit Spread
The reason for this is to decrease the overall debit of the position, but also leave profit potential open to the downside in the case of a long or swift fall accompanied by a sharp increase in IV.
Long Put
Levels on Chart
Reevaluation: 177.5
PT : 159
*Stops based off underlying stock price, not mark to market loss
The Trade
BUY
2/4 40P
R/R & Breakevens vary on fill.
Manage Risk
Only invest what you are willing to lose

BTC (Ascending Broadening Wedge)Ascending Broadening Wedge pattern, 80% price breaks down of pattern. Key support will be 40536.66.
BTC 1H

PFE / USD 1D Pfizer - Flying the Bull Flag?Bull flag in the trading sense of the word... I could see a retest of the ATH...Pretty sure the shareholders can too. Bull flag within the ascending broadening wedge pattern may visit around the $55.00 region first. Look at how fast this ones moved though. No surprises eh. Personally not trading this instrument.
