Ascending Broadening Wedge BTC on Large TimescaleAscending Broadening Wedge naturally bearish but failure of pattern also important. Price target 1.618 golden fibo off the entire move?
Ascending Broadening Wedge

GOLD SHORT LONG TERM SELL PENDING AT 1747This chart is on the weekly chart. Over the last few years, Gold has formed an ascending broading wedge price pattern.
Once price builds it winds up to a break in either direction. As the fed tightens and increases interest rates this will push Gold into a strong bearish market.
This is likely to take several months to play out, it could be by end of January or February. Everyone thinks gold will go bullish . That could be completely wrong as with inflation individuals with start using alternative investments.
My methodology will be to use a pending SELL order at 1747 with a TP at 1700 - if it breaks below then looking towards 1681. There will be a break for first win, then a retest following a larger bearish trend .
First target is 1681/1700 with even a long term target of 1450 or lower.

DOT bearish scenario$DOT broke down from ascending broadening wedge pattern.
current zone can act as support and cause increase to broken support to confirm it as resistance.
then more drop to 0.786 fib level and maybe touch support zone between $7 and 10.
RSI candles shaped a triangle that current candle can be on lower line.

Target of ascending wedge formation on monthly timeframeThe possible target of the rising wedge formation in the monthly time frame does not look encouraging at all, there is a possibility that there will be a move that will almost completely eliminate the entire annual rise.

Bearish 5-0 Entry Below Ascending Broadening Wedge Demand LineFrom the looks of things we should see prices at least peak below the 40k level and at worst see this be the beginning of something much more bearish.

DogeCoin is about to make another leg upAn ascending broadening wedge pattern formed on the dogecoin chart. I expect it to make a big move up to $0.44 for the short term. On this level ($0.44), it depends on the market whether if another FOMO drives the price to $1 or rejects this level to the pattern projection.

SHIB Down to 4800 area Hi traders,
Sharing a quick idea for a short. SHIB has left yellow ascending expanding wedge and will complete the figure with the fall to wedge base around 4800 area.
Good luck.
Tony

Bitcoin RoadmapPlan : support level breakout --> wait for the price to bounce off from resistance level --> wait for the rejection candle pattern to form e.g. bearish engulfing , pinbar etc on lower timeframe --> SELL
**Disclaimer** the content on this analysis is subject to change at any time without notice, and is provided for the sole purpose of assisting traders to make independent investment decisions.
Traders!! if you like my ideas and do take the same trade like i do, please write it in comment so we can manage the trade together.
_____________________________________________________________________________________________________________________
Thank you for your support ;)
GWBFX


Ford Motor Co. (F) Overall Macro Trends & Bullish Case for ATHsThis a fairly long video on Ford Motor Company NYSE:F and the overall macro trends I see in its market. I am long on Ford and this is my bullish case-video and DD. I hope you enjoy! NYSE:F . This is also my first voice over video, so please be kind and let me know if there is ANYTHING you disagree with on the charting aspect of the video or otherwise.
Identified:
1. Falling Wedge
2. Ascending Rising Channel
3. Ascending Broadening Wedge
4. Levels of Support
5. Levels of Resistance
6. Breakout Zones
7. Overall Options-Chain Sentiment
Tools Used:
1. Trading View
2. Google
3. Unusual Whales
4. www.ford.com
5. My brain
Indicators Used:
1. Weekly Candles to find levels of support and resistance - keeping it simple
Could Ford be on the verge of a breakout? How is Ford fitting itself into the EV future? What does the big money say about Ford?
After careful study of Ford NYSE:F I have come to a bullish conclusion that this stock is getting very close to all time highs. There are 3 major overall macro BULLISH patterns at play that I have highlighted in my video.
1. Falling Wedge
2. Ascending Rising Channel
3. Ascending Broadening Wedge
NYSE:F
We are possibly about to enter into a breakout zone with NYSE:F as a Broadening Wedge breakout is forming right now. This Broadening Wedge breakout could propel Ford out of its Ascending Channel, which itself was used to thrust Ford out of its Falling Wedge. This is my mind is BULLISH. Please watch the video for more details on my case of Ford reaching new ATH and when that could potentially happen. Any feedback is greatly welcomed!
I am long on Ford F

#AXSUSDT (Update) 10/21Axie Infinity is a Pokémon-inspired digital pet universe built on the Ethereum blockchain where anyone can earn token rewards through skilled gameplay and contributions to the ecosystem.
To create a better user experience and promote scalability, the Axie Infinity team is building a layer-2 sidechain named Ronin.
The AXS token is the ERC-20 utility token of the platform and is used for:
Governance: AXS token holders will be able to stake their tokens and participate in governance voting.
Staking: Players will be able to stake their AXS to earn weekly rewards.
Payment: Players can use the AXS token to play games and conduct payments.
#AXS may be worth it to add this coin to your Watch list. 👀
Pree "like button" and leaving your "comments" below our ideas is a great thing and supports us to providing more ideas.❤️ (Share it with your folks)
Everything mentioned on the chart (Pattern/Resistance/Support / Breakout/breakdown levels, Also R: R)
add to watch list means the coin we mentioned is forming a pattern or moving near a historical bottom, around or above good support, increase in trading volume, showing a reversal candle, accumulation stage, etc, but no reaction from bulls, so we inform you to add it to your Wish-list until the right time for entry.!!
Ps:
we avoid trading any coin if the entire project for it is based on gambling, prostitution, human trafficking, borrowing, and lending, etc.
This is not financial advice, The purpose of these Charts is to give you an idea about coin movement (not buy or sell signal) so before following any idea be sure to do your own research, and follow your risk management. the Cryptocurrency market is very volatile and involves gains and losses as well so know very well what you are heading towards before engaging in it.
The information we mentioned here is a personal effort that is subject to success or failure and we welcome constructive criticism.
Good luck to All.
🙏we ask Allah reconcile and repay🙏

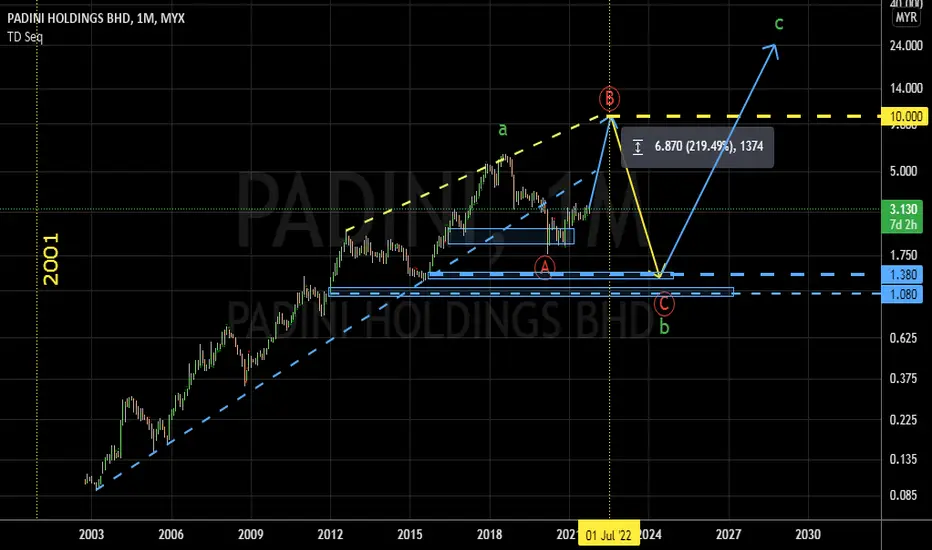
PADINI potential >200% to reach around RM10.. 22/Oct/21PADINI stock price may reach at around RM10 at the upper line of ascending broadening wedge pattern.. Before a big "crash" .. for expanding flat pattern..
BTC/USDT - Ascending Broadening WedgeAs you can see guys, a few hours ago BTC hit the 60k and now it looks like at the end of completing the Ascending Broadening Wedge Pattern, If we can hold that support at $58937 in the next few hours maybe 24 hours we will see a new all-time high.

BTC - 4h - Ascending Broadening WedgeJust another idea after days of pump
Lets see if the wedge plays out, after my last 2 failed

DXY - D1 - ASCENDING BROADENING WEDGEToday, we are looking at the Dollar Index (DXY) from Monthly to Daily.
MONTHLY :
Strategically bullish, supported Under by a double bottom pattern (@0.892090), trigger level confirmed for
a technical target of 97.67 !
September, end of the month closing @ 94.24, above the MBB = positive signal
WEEKLY :
Double bottom clearly identified, followed by a gradual recovery supported by firstly
the uptrend line and by the Mid Bollinger Band too.
Currently above TS but still inside of the clouds and the Lagging line still below the clouds
Therefore, in this time frame, in order to confirm further upside, we need to see :
1) Breakout of the clouds resistance area, currently around 95.00
2) Confirmation by the Lagging line cross over above the clouds too
Such kind of price action would open the door for 96.10 (50 % Fib retracement) ahead of 97.72 (61.8%
Fibonacci retracement and also the double bottom technical target previously mentioned on M1 comment.
Warning :
Last price action triggered a "Doji" pattern which, for the time being is not a trend reversal signal yet but this should be
watch at very carefully
DAILY :
Ascending broadening wedge price action in progress which is usually BEARISH !
Watch carefully upcoming day (s) price action, as a failure to hold above TS would be the first signal of a short term reversal (tactically) which would be
confirmed by a breakout of the Mid Bollinger Band, currently @ 93.50 (of course on a daily closing basis !)
Monitor also closely the price action through the technical indicators which will allow you to detect early potential reversal signal (s) such as for example bearish divergence !
As usual, watch also closely shorter time frames to get intermediate clues for further direction.
Ironman8848

Right Angled Ascending Broadening Wedge - Dollar IndexChart shows the possibility of Right Angled Ascending Broadening Wedge Chart Pattern and it's target.
A right-angled ascending broadening wedge is a downward reversal pattern. The pattern is formed by two diverging lines, the support is a horizontal line and the resistance is an oblique bullish one, so it is an inverted descending triangle. ... Each line must be touched at least twice to be validated.

Broadening Wedges - Advanced AnalysisIn our previous post in this series about chart patterns we described the characteristics, rules, and causes of triangle patterns (if you haven't seen it, see the related idea below).
In this post, we perform an advanced analysis of broadening wedges patterns. We provide a description of each pattern and its implications. We also review the literature in order to find their deterministic cause.
1. Broadening Wedges
Broadening wedges are characterized by price variations laying within one support and resistance, both having the same direction and broadening over time. As such the apex of the support/resistance in a broadening wedge is located to the left.
Broadening wedges must not be confused with other broadening formations. While they all have a broadening characteristic they can have different identification rules
Broadening wedges are classified depending on the direction of the support/resistance.
1.1 Ascending
Ascending broadening wedges mostly occur during uptrends with rising local maxima (higher highs) forming an upward sloping resistance and raising local minimas (higher lows) forming an upward slopping support. The slope of both the support & the resistance should be significantly different from 0.
Bulkowski suggests the price needs to test the support and resistance three times each. Additionally, the resistance should be steeper than the support.
Volume tends to increase during the formation of such pattern.
Ascending broadening wedges have a bearish bias with breakouts mostly occurring downward. Downward breakouts are often followed by a decrease in price.
Example of an ascending broadening wedge followed by a downward breakout on SOLUSDT 4h.
1.2 Descending
Descending broadening wedges mostly occur during downtrends with declining local maxima (lower highs) forming a downward sloping resistance and declining local minimas (lower lows) forming a downward slopping support. The slope of both the support & the resistance should be significantly different from 0.
Similarly to ascending broadening wedges, Bulkowski suggests the price needs to test the support and resistance three times each. Additionally, the support should be steeper than the resistance.
Volume tends to increase during the formation of such pattern.
Descending broadening wedges have a bullish bias with breakouts mostly occurring upward. Upward breakouts are often followed by an increase in price.
Example of an ascending broadening wedge followed by a downward breakout on AVAX 1h.
2. Partial Rises/Declines
Partial rises/declines are phenomena described by Bulkowski in broadening formations and are described as being common. Partial rises/declines often indicate the direction of a breakout.
Partial rises commonly occur in broadening ascending wedges, price bounces off the support, moves towards the resistance without reaching it, and go back to the support. We can expect a potential downward breakout after that. Note that a partial rise always starts from the test of the support.
Partial declines commonly occur in broadening descending wedges. The price bounces off the resistance, moves towards the support without reaching it, and then goes back to the resistance where we can expect a potential breakout upwards. Note that a partial decline always starts from the test of the resistance.
Partial rises and declines can offer a better price to buy/sell instead of waiting for a breakout.
3. Measure Rule
The measure rule for broadening wedges allows us to determine the position of a take-profit/stop-loss.
For a broadening ascending wedge the measure rule would place our take profit at the lowest low inside the formation. Selling directly after a partial rise would allow for higher profits.
For a broadening descending wedge the measure rule would place our take profit at the highest high inside the formation. Selling directly after a partial decline would allow for higher profits.
Certain analysts close trades caused by partial rises/declines when the price reaches the support/resistance of the wedge, opening a new position in the case of a breakout while using the metric rule for setting their take profit.
4. Causes Of Broadening Wedges
Bulkowski offers a description of the causes of broadening wedges in the market in terms of the market participant's behavior.
The cause of an ascending broadening wedge is a surge from an initial buying impulse, driving the price higher. Momentum traders follow the initial impulse further pushing prices up.
Contrarian traders judge the price to be trading above its intrinsic value, selling and thus creating a decline in prices. However, before the decline reaches the previously established low, certain market participants buy again. These participants can be composed of initial buyers, accumulating positions, or late traders seeing the potential to buy at a better price. This allows the creation of a new impulse, with only a divergence left.
This scenario eventually repeats itself with increased volume, causing impulses and retracements of higher magnitude reinforcing a positive feedback loop until the price is judged overbought even by initial buyers.
A broadening falling wedge follows the same scenario structure but with sellers instead of buyers.
5. Other Observations
The amplitude of the cyclical variations within a broadening wedge increases over time, thus potentially highlighting volatility clusters in higher time-frames.
Another interesting observation that can be made is that prices within a broadening wedge are subject to heteroscedasticity (variability is not constant, it increases inside a broadening wedge), while prices inside a channel are homoscedastic (variability remains constant). This concept is inherent to regression analysis.
6. Conclusion
In this post we described broadening wedge patterns in depth. We have highlighted partial rises/declines as well as how the measure rule applies to such patterns. We then focused on showing how market participants act during the formation of broadening wedges.
Note that unlike triangles patterns we did not find a significant amount of studies mentioning such patterns, nor any agent models developed to describe their occurrence.
7. References
(1) Bulkowski, T. N. (2021). Encyclopedia of chart patterns. John Wiley & Sons.

DXY may go down from right hereDXY currently is in a 'hard-to-tell' situation as I was expecting it to jump to 93.7 which it didn't manage to achieve last week. However it did achieved 93.524 and fell after retest for the second time hitting exactly at 93.524. So my assumption here is that there's big sellers available at this level that managed to push price down.
DXY is still in uptrend in general on daily and weekly chart. On lower time frames, it does look like that DXY failed to create higher high after revisiting 93.524 so I expect it to head south and retest previous lows.
RSI on most times frames currently are above 54 indicating buying strength. However lower time frames RSI is heading down agressively, it's highly possibly to move down further comparing with it's historical RSI data.
Ascending broadening wedge can be considered to support this analysis.
However it may also be possible that the price wants to visit higher high at 94.290 which in my opinion is highly unlikely but it's month end, and Q4 start, so I bias in thinking long investors taking profits therefore pricing going down. So if US data and news goes negative this week, the price may go crazy as it's also profit taking week, things can go wild.
Overall - I'm biased on bullish dollar so may simply bounce back up from any of these support zones before reaching to the lower end of the rising wedge.
Note: I do not trade DXY. It's used as analysis support for other pairs.
Disclaimer: Chart does not show future market prices, make sure you adjust your trades accordingly. No financial advise is given here. Manage money at your own risk. Never believe 100% accuracy. Don't

$XTZ huge uncertainty we have hereI am aware that analysing the market in its current conditions is tricky, but I just can't hold back.
Most of the altcoins are showing weakness with previous movements of $BTC and financial market in general. Multiple altcoins and $BTC are drawing symmetrical triangles on a 1D timeframe and are in the middle of it which is why I think market can go any direction at the moment. But with $XTZ the situation is even trickier.
We have two options from here. We are seeing Ascending Broadening Wedge on 1D timeframe and it went to the upper side of the channel according to my previous thoughts. Although, now is a completely different situation and this formation is ending most of the time with bearish movement. As we have been in this pattern for a long time, my thoughts are that we will retest the bottom line of the pattern and go down. I am almost certain that it will not achieve the full potential of the pattern. However, I think we will revisit the bottom line of the trend channel.
The second option is that BINANCE:BTCUSDT will not continue the downside movement and we will go to the upper side of the Ascending Broadening Wedge up to the price of 9$. But for me this is not likely to happen. Keep a close look at the hidden bullish divergence on 1D timeframe.
Entry zone of short position: 5.5-5$
Stop-loss: 5.75-6 (as we expect a small upwards squeeze to collect the SLs)
Targets: 4.53 - 3.9 - 3.25 - 2.9 - 2.4 (and 2.1 as an extreme point which is not likely to happen)
Even if I mentioned two options, I am voting for the first one.
This is not a financial advice. Do your own research. These are just my personal opinions.
Good luck.

flow
🟢 Buy : 20.12 - 19.166 $
🔸Short Term Sell Target 23.7733 , 27.8520 $
🔸Mid Term : 33.33 , 40.0883 $
T A 🧑🏻💻 : Ascending Broadening Wedge
🔻SL : -7% from buying zone because of BTC sudden fluctuation(Use Stoploss tightly)

Monthly Put Options Play: Monthly Partial-RiseBABA seems to have completely broken it's trend and looks to be preparing to reverse back down to where it started i think in the next few months you will certainly see BABA below $145 and worst case scenario it will go back to the 60s.

BTCST
🟢 Buy : BELOW 22 $
🔸Short Term Sell Target : 23.91 ,25.74 , 26.83 $
🔸Mid Term : 27.95 , 31.12 $
🔻SL : -7% from buying zone because of BTC sudden fluctuation.
T A 🧑🏻💻 : Symmetry triangle , Descending triangle , Above BOX ,Ascending Broadening

BNB#Keep eye on BNB
#Trading in Box
#Ascending Broadening Wedge
#I'm Bullish
Trade according to BTC movement
