I Can't Get Over How Great $THETA LooksTheta has been printing an ascending broadening wedge since March 10th. The price is currently sitting in a nice symmetrical triangle. The market as a whole seems bullish right now so there is a high chance that we see this triangle break up. In the short term I am targeting local highs. I think we could see price in the $22.00 range (Fib Extension) by the first week of April if the market remains bullish. The BTC pair for $THETA looks very similar to this chart. I am bullish on both pairs.
Ascending Broadening Wedge

EURJPY - BIG Drop ComingEURJPY reversed from the third touch of the bigger pattern in play and there was a short entry already from the top.
The next best place to enter is after the break of the ascending wedge and a retest. Will update closer to the time,
Trade safe!

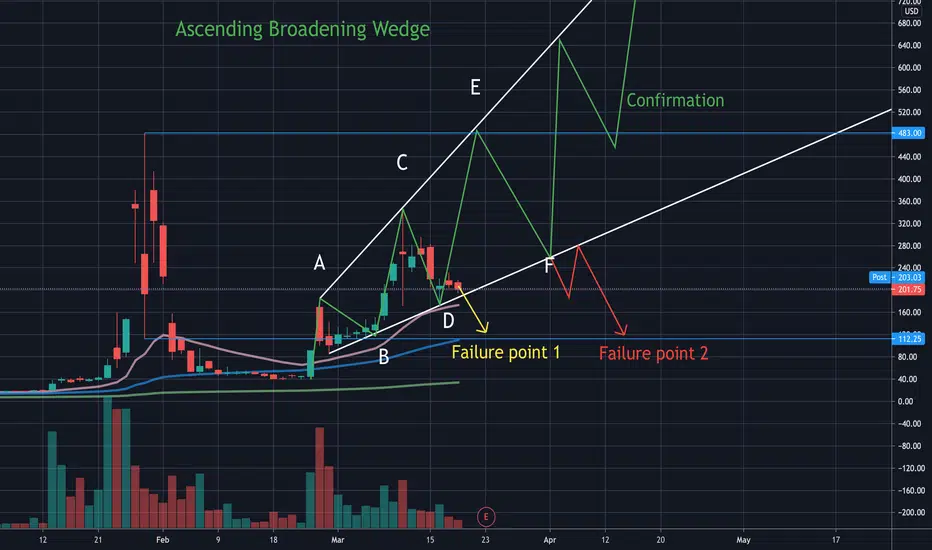
GME Ascending Broadening Wedge PatternWho knows where GME will end up in the future.
Short interest is either back to a normal percent or being underreported and there is a negative beta which is super weird. There are still plenty of $800 contracts for the 19th and decent Q4 earnings for 2020 coming up on the 23rd. Earnings could be a potential price mover, but in my current opinion GME will not see much upward movement unless some of shady shenanigans come to light. If all the current information being reported is correct, anyone long on the stock may have to rely on fundamentals of the company instead of hoping for a potential short squeeze.
From the looks of it, GME is filling out an ascending broadening wedge pattern. If volume stays low and buying pressure continues to dwindle, it's likely this pattern will fail and GME will return to its previous support (listed as failure point 1).
If all the speculation about the 19th is correct and the earnings call spikes the price, GME may see a move up to the previous high. At that point GME could get rejected at the previous high and lead to double top rejection (listed as failure point 2).
If the price regains support at the bottom of the wedge there could be another wave upward and confirm the ascending broadening wedge pattern.
All that being said GME has had some weird movements, decreased buying pressure, low volume , and high volatility in the past two weeks leading me to believe there is still some unhealthy schemes waiting in the shadows. So who really knows...
(Not financial advice)

US10Y Yield Will Show A Growth In Broadening Wedge To 1.75%Throughout the last one month, I noticed that US10Y has been trading within an ascending broadening wedge chart pattern, and has been respecting the two diverging bullish lines that form its dynamic support and resistance extremely well.
After bouncing off the dynamic support of the ascending broadening wedge, US10Y is now halfway through its growth towards the dynamic resistance. I expect this growth to continue and hit around 1.75% by the end of March.
It is also interesting to note that if US10Y continues to move within this ascending broadening wedge (assuming status quo on a macro level), we are potentially looking at 2.5% to 3% yields by mid-2021.
I used mid-2021 as a reference point because this morning, I came across a Wall Street Journal article stating these:
"Economists in the Journal survey said they see annual inflation rising to 2.8% by the middle of this year, then falling gradually after that"
"“Inflation will reach levels rarely experienced over the past decade, at close to 3% in mid-2021, but uncontrolled overheating isn’t likely,” Mr. Daco said."
Source of article: www.wsj.com
So I thought it will be interesting to compare it to the current ascending broadening wedge technical chart pattern that US10Y is current trading within, and it looks like we are definitely on track to those numbers if this continues.
Just some food for thought!
This is not an investment or trading advice so please do your own due diligence!
Support this idea with likes and share your thoughts below.

LTCUSD short trade ideaPlan: trendline and support level breakout --> wait for the price to bounce off from resistance level --> wait for the rejection candle pattern to form e.g. bearish engulfing, pinbar, etc --> SELL
**Disclaimer** the content on this analysis is subject to change at any time without notice, and is provided for the sole purpose of assisting traders to make independent investment decisions.
Traders!! if you like my ideas and do take the same trade as I do, please write it in a comment so we can manage the trade together.
_____________________________________________________________________________________________________________________
Thank you for your support ;)
GWBFX

NZDUSD - Ready to SHORTWe have been waiting for this short for quite sometime. We're anticipating overall NZD weakness and looks like it will happen very soon. This would also mean we'd be bullish for EURNZD depending on which currency is the weakest.
I'll be breaking things down further and providing updates in the links below.
Goodluck and trade safe!

AAVEUSD: Ascending broadening wedge Vs. Inverse H&SHello Traders,
Decision time. Decision time..
We have an ascending broadening wedge pattern forming on the 4hr.
What’s interesting is that we have an inverse head and shoulders pattern forming within this wedge. This gives us a mix signal of a bullish short-term and a bearish mid-term.
Outlook: short-term, we may see some continued support to the upside through today and tonight. But I would expect a decent pullback to the strong support line that AAVE has been following for the last month or so. This is where I will set some buy orders in place, just above the line, anticipating a bounce up.
If we do seem to follow this inverse and shoulders pattern to the upside, we will probably retest recent highs. If not, then we will want to wait for a confirmation bounce off of that support line and then hold.
Good luck!

Bearish Price Action Near Top of Ascending ChannelWe seem to be having significant bearish reactions every time we hit the top of the channel, It also looks like the RSI is struggling to make higher highs near overbought levels; Pair that with less than stellar earnings and you've got yourself a decent reason to enter a bearish position.

TRACKING BITCOIN!!side by side here. 1h and 4h.
for the risk oriented . possible double bottom can lead to huge W pattern breakout to 62K!!
on the 4h we are in an ascending broadening wedge breaks bearish 52% of the time as per thepatternsite.com
learn more at thepatternsite.com

Ethereum Reversal? Cup & Handle?RSI Bearish divergence,
Declining volume,
Ascending wedge,
Psychological resistance at 2k,
Well beyond ATH,
XABCD pattern,
Potential cup and handle,
400% Fib Extension.
I can't wrap my head around a short term bull argument right now.


TESLA ANALYSIS: STOCK MARKETHello everyone, I hope you all enjoyed your three day weekend! Here is my analysis on Tesla, please let me know in the comments below on what you think of this video.
This is not financial advice it is up to you on what you want to take on it but I would love feedback. The purpose of these videos is to help educate the public on how I see trading.
I also want to say thank you all so much for all of the support and love, I was in a great slumber and now I feel more motivated than ever with all of this support!
~Master Chef out.
P.S. If you want to know why I call myself Master Chef lets get this video to 45 likes and I will let you all know!

Bitcoin Short Term Ascending Wedge Pattern -10% Correction aheadIdentified a short term ascending wedge/triangle with Bitcoin. Breakdown to $43,300 in the next 72 hours likely followed by a re-test of $50,000 in the coming weeks...

Ethereum is in a broadening wedge pattern.Formation of an ascending broadening wedge after a trough
www.centralcharts.com
This type of pattern appears during the correction in a bearish movement, it is a bearish continuation pattern. Resumption of the bearish movement after correction.
The break in the support line definitively validates the pattern.
The price objective is given by plotting the wedge’s maximum height onto the breaking point
NB: pullbacks are harmful to the pattern’s performance.
Statistics of the ascending broadening wedge after a trough
- In 79% of cases, the exit is bearish.
- In 23% of cases, an ascending broadening wedge occurs in a consolidation movement.
- In 81% of cases, the pattern's price objective is achieved when the support line is broken.
- In 40% of cases, the price makes a pullback in resistance on the ascending broadening wedge’s support line.
From www.centralcharts.com

Bearish Butterfly Bearish Divergence Ascending Broadening Wedge.I think we'll see a pullback to atleast 10 dollars from here.

Are we going to deep Correction?Still bullish or Bearish? there are two possible continuation , if BTC will go to the below EMA 200 period And close there there is high possibility to bearish continuation .
if EMA will reject the price strongly and start to moving up and break the Dynamic bearish trend line as you see in the chart it will retest the 40K Again.
what do you think Bearish or Bullish?

TLKM SETCUANDengan adanya bidikan Patern Ascending Broadening Wedges, ada Potensi cuan golden 1.618.

Cardano Forming Bullish Megaphone PatternCardano appears to be forming a bullish megaphone pattern, similar to the one Bitcoin formed earlier during it's current run.
You can see from my chart that we have broken through the blue symmetrical triangle and currently testing the upper trend line of the red ascending triangle. Once these breakouts are confirmed this should propel Cardano to the upper trend line of this Bullish megaphone, with a target of around 50 cents. Don't be surprised if Cardano breaks through this trend line and hits a target further to the upside as Bitcoin previously did.
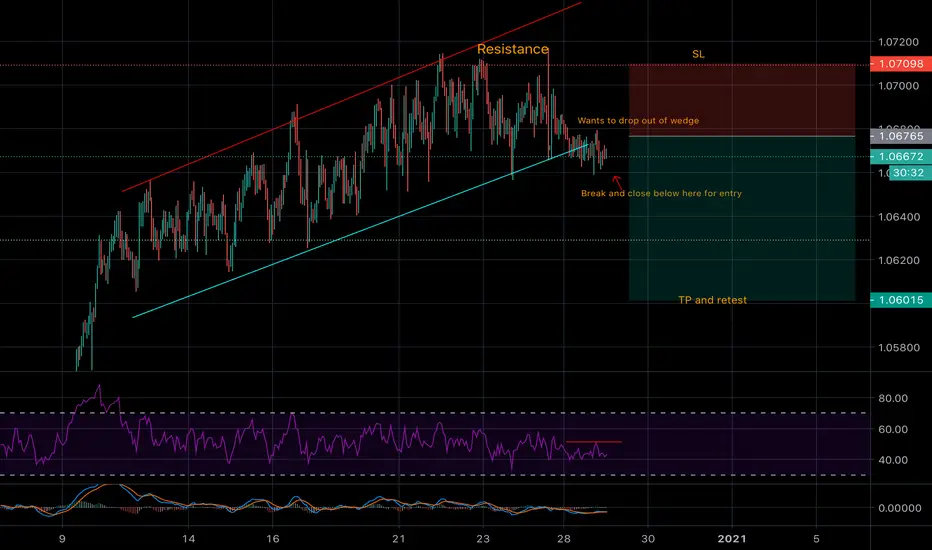
Potential falling out of wedgeThe pair has been in an ascending wedge and has hit some straight resistance following a drop below support. We have some consolidation so for better sentiment towards a drop wait for a breach and close below 1.06600.
RSI is finding resistance as presented in chart and MACD/Signal set to divert.
TP and SL as shown on chart and pay attention to entry.
Please comment with thoughts and ideas. Thank you.
SCALP - GOLD SELLComing out of a ascending wedge pattern we see a very likely move to the downside. Accroding to all of the indicators we are moving out of overbought territory acting as confirmation to our wedge breakout when it occurs. Pending order set for breakout with two targets.

Price target till february 2021. Thoughts please.Price target of $220-230 because the confluence of :
- Fibonacci retracement (0.618 - $219.06) from ATH to September '15 low
- Fibonacci retracement (0.5 - $223.52) from ATH to December '18 low
- Fibonacci retracement (0.382 - $225.76) from ATH to March '20 low
- Low side of the parallel channel formed since the IPO
- Low side of the broadening wedge formed in December 2018
- Price target of the new descending triangle forming since 16 November 2020
- MACD convergence divergence negative in Weekly
- Chinese regulations risk
- U.S delisting risk
But probably trend reversal in first weeks of February 2021 when :
- New democratic POTUS arrive to the White House in 20 January
- New Alibaba earnings release between 02-09 February with sustained growth
Please leave your thoughts to create a better community with better ideas. Do you think I'm right or not? Why?
I'm from Barcelona so sorry if there are some spelling mistakes :)

LINK about to break lower towards $11.50 (Buy Support)*** Disclaimer - I am relatively new to TA ***
Moving averages and stochastics are showing bearish signals on the 4 HR . We're in a large descending triangle . Inside that, we're also seeing an upwards broadening wedge play out. I think we're going to break lower to the support around $11.50. This would be a great buying opportunity. If the US reacts positively to stimulus news upon markets opening, this could all be invalidated quickly. I'm bearish , but what do you guys think? This could make a decent short position depending on which route you want to take. I'll personally be putting in a leveraged long at support.
