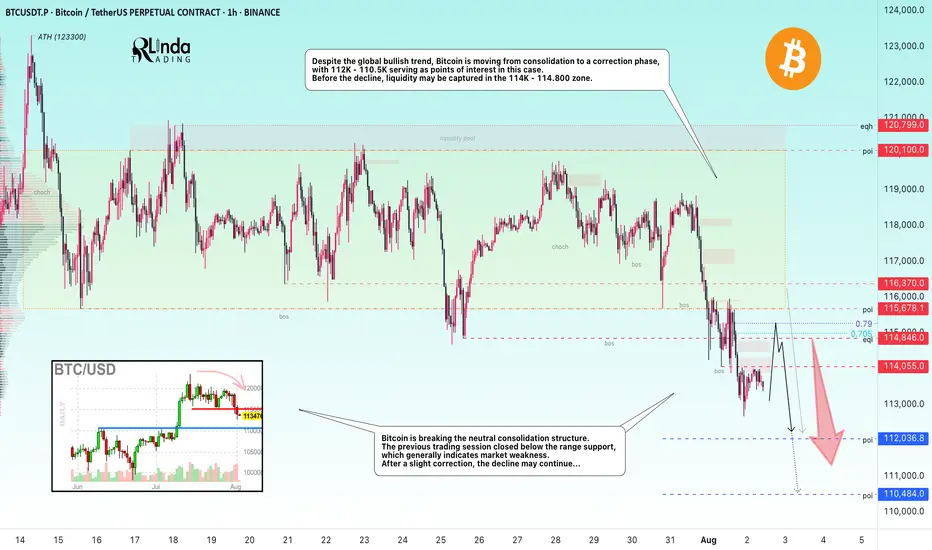
BITCOIN → From consolidation to distribution. Market weaknessBINANCE:BTCUSDT.P is moving from consolidation to a correction phase. The price broke through the support zone of 114.5–115.5, closing within the Friday trading session in the sell zone...
Previous idea from July 22: BITCOIN → Consolidation and compression to 116K. Correction?
The fundamental background is shifting to neutral, the hype has temporarily ended, and there are no bullish drivers yet. And for the health of the market, a correction is needed. Bitcoin is breaking the neutral consolidation structure. The previous trading session closed below the support range, which generally indicates market weakness. Despite the global bullish trend, Bitcoin is moving from consolidation to a correction phase, with 112K - 110.5K serving as points of interest in this case. Before the fall, liquidity may be captured in the 114K - 114.800 zone.
Resistance levels: 114.05, 114.85, 115.67
Support levels: 112.03, 110.48
After a strong movement, the market may enter a correction or local consolidation, during which it may test the specified resistance zones before continuing its downward movement to the zone of interest and liquidity at 112 - 110.5.
Best regards, R. Linda!
Ascending Channel
GOLD → The market is waiting for NFP. What could happen?FX:XAUUSD is bouncing off resistance at 3310, confirming the upper limit of the new trading range. The dollar continues to rally, but the market as a whole is stagnating ahead of upcoming news—NFP is coming up!
Gold is consolidating at monthly lows around $3268, awaiting key US labor market data (NFP). Trump's new tariffs (10% globally, 35% for Canada, 39% for Switzerland) have boosted demand for the dollar, putting pressure on gold. Markets are waiting for NFP: forecast +110K jobs, unemployment 4.2%. Weak data (<100K) → gold may rise to $3400. Strong (>150K) → the dollar will strengthen, gold will continue to fall. The probability of a Fed rate cut in September is <50%.
Based on yesterday's data, I would cautiously suggest that NFP will be in the range of 125K–145K, slightly above the consensus (110K). This will play into Trump's hands (I think you understand what I mean...).
Resistance levels: 3300, 3310, 3320
Support levels: 3287, 3268, 3255
The news has a negative nuance — unpredictability. Be careful.
Technically, based on the data we have at the moment, I would assume that the market may test resistance at 3300-3310 before a possible pullback to the specified support. BUT! Unpredictable data could turn the game around, and in that case, if the dollar falls, gold could start to rise.
Best regards, R. Linda!

SP500 → Countertrend correction before growthFX:SPX500 is correcting against an upward trend. In the second half of the week, the market received fairly positive fundamentals during the reporting period.
S&P 500 futures found support after strong reports from Meta and Microsoft, which exceeded earnings expectations and forecasts thanks to AI. The rise in futures supported demand for the “Magnificent Seven” despite Powell's hawkish comments. The focus is on Apple and Amazon reports in the evening, which could strengthen the tech rally. On Friday, we are seeing a countertrend correction in which the market is testing the 6288 zone of interest.
Support levels: 6288.4, 6262.6
Resistance levels: 6342, 6371
Most likely, the market will form a false breakout of support during the correction. If the bulls keep the index above the key level, we can expect continued growth in the short and medium term.
Best regards, R. Linda!

GOLD → False breakdown 3310. Consolidation ahead of news...FX:XAUUSD is forming a false breakdown of support at 3310, thereby confirming the boundaries of the trading range. The dollar is testing strong resistance within the global downtrend. And in the near future, we can expect more economic news...
Gold is trading below the key resistance level of $3345, remaining in a narrow range ahead of the Fed's decision and US GDP data for Q2. Weak data could reinforce expectations of a rate cut and support gold, while strong data would strengthen the dollar. The Fed is likely to keep rates at 4.25–4.5%, with markets pricing in a 64% chance of a 25 bps cut in September. Investors are waiting for signals from Jerome Powell, with a possible split within the Fed: some members may support calls for easing, which would be a driver for gold.
Technically, the situation on D1 is quite interesting. Gold is still below the previously broken trend resistance, but there is no continuation of the momentum. Buyers are reacting to support at 3310, but the market is stagnating due to uncertainty ahead of the news...
Resistance levels: 3345, 3375
Support levels: 3320, 3310, 3287
Thus, from a technical analysis perspective, I expect a retest of 3345, followed by a pullback to support at 3320, from which gold could move higher (if the bulls take the initiative), but if 3320 breaks and 3310 comes under pressure, gold could test 3287. Again, the emphasis is on trend support (the upward line) in the 3335-33450 zone. If the price can consolidate in this zone, we will have confirmation that the price has returned to the boundaries of the upward trend.
Best regards, R. Linda!

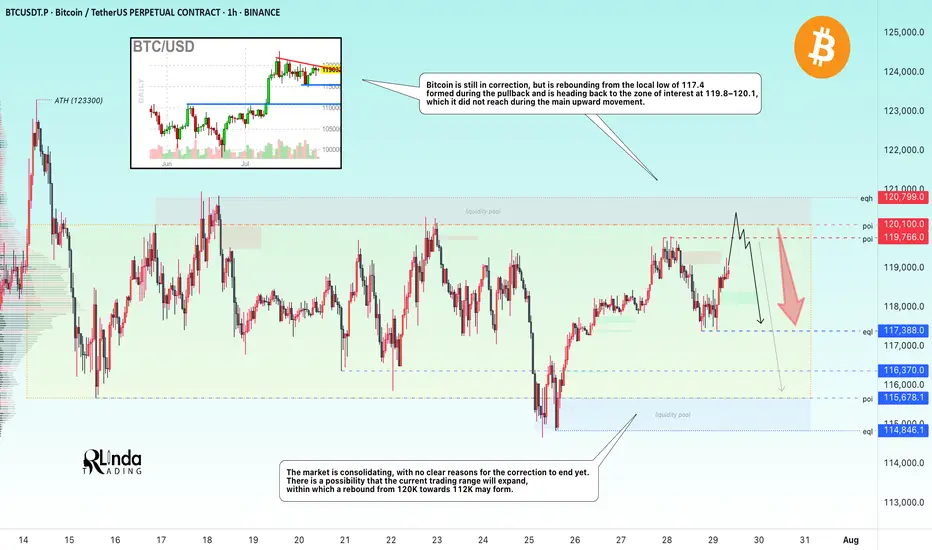
BITCOIN → Hunting for liquidity. Retest resistance before a fallBINANCE:BTCUSDT.P continues to consolidate after a strong rally. There is no strong driver yet, and Bitcoin is reacting weakly to economic data. There is a possibility of a continued correction...
Bitcoin is still in correction, but is rebounding from the local low of 117.4, formed during the pullback, and is heading back up towards the zone of interest at 119.8-120.1, which it did not reach during the main upward movement. I see no fundamental or technical reasons for the correction to end and for growth beyond 121K. I expect a rebound from the resistance zone towards 115-114K. However, in the medium term, I expect the market to attempt to close half or all of the gap between 112K and 114.8K, thereby expanding the key trading range.
Resistance levels: 119.77, 120.1K, 120.8K
Support levels: 117.4, 116.37, 115.68
Technically, a false breakout (liquidity capture) of key resistance and price consolidation in the selling zone could trigger bearish pressure on the market, which in turn would lead to a correction.
Best regards, R. Linda!
GOLD → Retest of trend support. Consolidation...GOLD is consolidating below the previously broken trend support. On Sunday, Trump announced a trade deal with the EU, which is putting pressure on the market along with the rising dollar...
Gold rebounded from support at $3310 after a week-long low, interrupting a three-day decline amid profit-taking. However, the overall downtrend remains intact as markets brace for a busy week with the release of US GDP data and the Fed's decision. Optimism surrounding US-China trade talks and the US-EU framework agreement is reducing demand for safe-haven assets. Additional pressure on gold is coming from easing geopolitical tensions: Thailand and Cambodia have agreed to ceasefire talks. The metal's recovery may be short-lived.
Technically, we have global and local bullish trends, against which gold is testing support, but as we can see, buyers are trying to hold back the decline due to uncertainty over interest rates. There is a chance that we will see active action by the Fed, behind which lies a rate cut, this week...
Resistance levels: 3345, 3375
Support levels: 3320, 3287
At the moment, I do not see a proper reaction to the support breakout. The price is consolidating after confirming the key trigger at 3345. Thus, if the price starts to return to 3345, test and consolidate above the level, we will have a chance for growth. I do not rule out a liquidity grab from 3325 (false breakout) before the rise.
BUT! The structure will be broken if the price breaks 3325 - 3320 and begins to consolidate below this zone. In this case, gold may fall to 3287
Best regards, R. Linda!

EURJPY → Retest support before growthFX:EURJPY has been correcting since the opening of the European session. The movement was triggered by yesterday's news related to the trade deal between the US and Europe...
EURJPY is reacting to news related to the deal between the US and Europe. A correction is forming amid the fall of the euro, but against the backdrop of the dollar's growth, the currency pair has a chance to rise if the bulls keep the price in the buying zone relative to the support level of 173.08.
The dollar is rising, and against this backdrop, the Japanese yen is falling. Bulls have every chance of holding their ground above the previously broken resistance. If the market confirms support, we will have chances for growth.
Resistance levels: 173.87
Support levels: 173.082, 172.47
The currency pair may form a liquidity trap relative to the previously broken consolidation resistance. A false breakdown of support and price consolidation in the buying zone (above 173.1) could trigger further growth.
Best regards, R. Linda!

GOLD → Countertrend correction, retest of 3345 before growthFX:XAUUSD , undergoing a deep correction after a false breakout of local resistance at 3433, has reached the support of the upward trend. Will the bulls be able to maintain the trend?
Gold held below $3,400 on Friday, rebounding from $3,350, and is poised to end the week higher. Investors are watching the conflict between Thailand and Cambodia, which is boosting demand for safe-haven assets, and are also awaiting decisions from the Fed and the Bank of Japan next week. The markets received additional support from US trade deals with Asian countries and progress in negotiations with the EU, easing fears of a tariff war.
As part of the correction, gold is testing trend support and the 3345-3337 zone of interest. A false breakdown, lack of downward momentum, and bulls holding prices above 3345 could trigger growth and a continuation of the main upward trend.
Resistance levels: 3375, 3383
Support levels: 3345, 3337, 3330
Technically, the support level of 3345 plays a fairly important role in the market. If, during the correction, the bulls manage to hold their ground above this zone, the prospects for recovery will be high, especially against the backdrop of geopolitical problems.
Best regards, R. Linda!

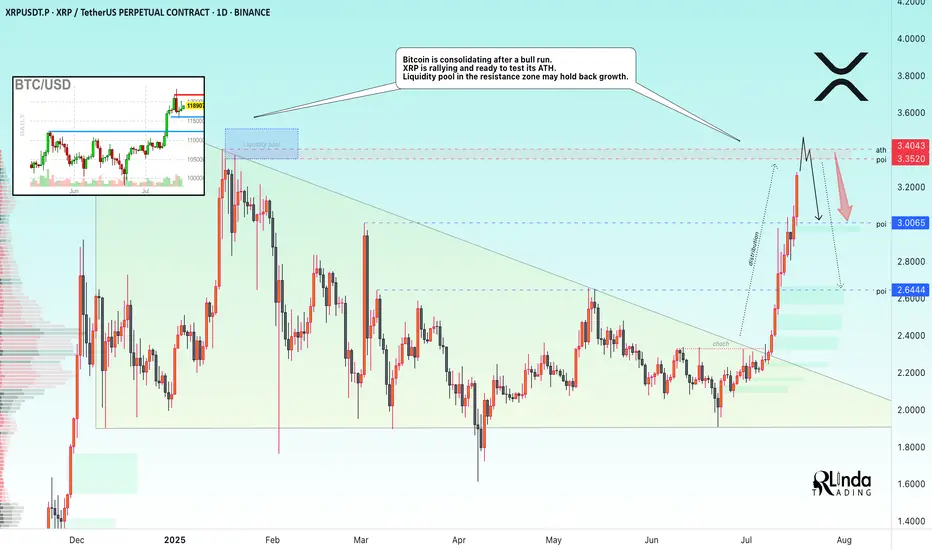
XRP → ATH retest. Reversal or continued growth?BINANCE:XRPUSDT.P is rallying and ready to test the resistance zone - ATH. Against this backdrop, Bitcoin is consolidating after a bull run. The liquidity pool may hold back growth.
Fundamentally, there is excitement across the entire cryptocurrency market. Altcoins are rallying after Bitcoin hit a new high and entered consolidation. The BTC.D index is declining, which generally provides a good opportunity for altcoins to grow. However, the index is approaching technical support, which may affect market sentiment overall...
As for XRP, there is a fairly strong liquidity pool ahead — the ATH resistance zone. The price is in a distribution phase after a change in character and a breakout of the downtrend resistance in the 2.33 zone. The momentum may exhaust its potential to break through the 3.35-3.34 zone, and growth may be halted for correction or reversal (in correlation with Bitcoin's dominance in the market).
Resistance levels: 3.35-3.40
Support levels: 3.0, 2.64
A breakout of resistance without the possibility of further growth, a return of the price below the level (i.e., inside the global flat) will confirm the fact of a false breakout of resistance, which may trigger a correction or even a reversal.
Best regards, R. Linda!
GOLD → Countertrend correction. Where will growth begin?FX:XAUUSD faced pressure in the 3430 zone, traders moved into profit-taking mode, triggering a correction. The price entered the sell-off zone...
On Thursday, gold is trading below $3400 as traders assess progress in US-EU trade talks and await preliminary PMI data from the US and the EU. These indicators could influence expectations for Fed and ECB rates. Optimism is being bolstered by reports of trade agreements between the US and Japan and other countries. The ECB is expected to keep rates unchanged, while the probability of a Fed rate cut in September is estimated at 60%. Investors are also watching Trump's conflict with Powell amid his visit to the Fed. Technically, the daily market structure is not broken, and a correction is forming within acceptable limits.
Based on the current direction, the market may test the intermediate bottom: trend support, the 3345-3320 area.
Resistance levels: 3375, 3383, 3400.
Support levels: 3345, 3320
A retest of resistance at 3375-3383 is possible. If the bears keep the price below this zone, the metal may continue its correction phase towards the zone of interest indicated on the chart. Local sell-offs have not yet broken the bullish daily structure.
However, the absence of a downward impulse and consolidation in 3375 - 3383 with a subsequent breakout of local resistance could increase demand again, which would generally lead to premature growth to 3400 - 3435.
Best regards, R. Linda!

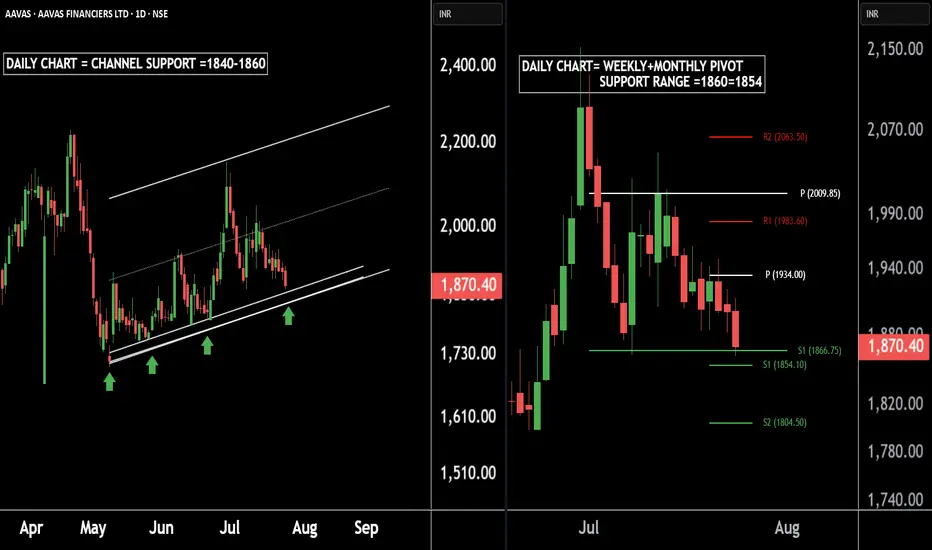
AAVAS Housing – A Hidden Gem for Medium-Term InvestorsThere are two charts of AAVAS FINANCIERS.
On the first chart AAVAS FINANCIERS is moving in a well defined parallel channel with support near at 1840-1860.
On the second chart AAVAS FINANCIERS is taking Weekly + Monthly support near at 1866-1854.
If this level is sustain ,then we may see higher prices in AAVAS FINANCIERS LTD.
Thank You !!
GOLD → Consolidation before the next jump to 3450?FX:XAUUSD continues to rally, with the price updating its local high to 3438 and moving into consolidation, possibly for another jump...
After hitting a five-week high of $3,438, traders are taking a break. Optimism is fuelled by Trump's statements about the largest deal with Japan and negotiations with Canada, but uncertainty about the details of the agreements and political instability in Japan are keeping caution in check. The market is waiting for further signals on trade and political issues, which remain key factors for gold.
Technically, the dollar continues to fall, which generally supports gold. But! Gold is approaching strong resistance at 3445-3450, where growth may be temporarily halted.
Resistance levels: 3433, 3446
Support levels: 3416, 3401, 3375
As part of a local correction, gold may test consolidation support or 0.5-0.7f before continuing to rise. There are quite a few orders in the 3433-3446 zone, and it will be difficult to break through this area to reach the target. Consolidation before this level may help the rise to continue.
Best regards, R. Linda!

BITCOIN → Consolidation and compression to 116K. Correction?BINANCE:BTCUSDT.P continues to consolidate, with the price testing support at 116K, leaving behind the zone of interest at 120K-121K. Are there any chances for further growth?
(Alternative scenario (if growth to 120K does not occur))
Fundamentally, there is nothing particularly new, and the hype surrounding Bitcoin is stagnating. Technically, on D1, consolidation is underway with pressure from bears against the backdrop of an outflow of funds into altcoins. However, the dominance index is starting to rise, which could trigger some correction in the market. The price on the working timeframe, without updating local highs, is testing lows, and the latest retest of the liquidity zone is provoking a fairly aggressive reaction that could bring the price to retest the zone of interest at 120K-121K.
But! If the price is squeezed between 116K and 0.5 Fib with a gradual squeeze towards support, the chances of a breakdown and a premature fall will increase.
Support levels: 116370, 115860
Resistance levels: 119650, 120100
Technically, the market needs a breather or correction, which is generally a sign of health. The nuance with Bitcoin is that below 115860 there is no support until 112K, and if the market breaks the current consolidation boundary, the further correction could be quite deep. In the current situation, I do not yet see any drivers or reasons for another rally.
Best regards, R. Linda!

USDJPY → Hunting for liquidity before the fallFX:USDJPY is changing its local trend and succumbing to global pressure. The market is seeing a change in price movement following the decline in the dollar index...
The trend has broken and the price movement has turned bearish. The fall in the dollar index is allowing the Japanese yen to strengthen, which is generally negative for the currency pair. The decline may continue after a slight correction.
Fundamentally, the dollar is correcting amid uncertainty due to the tariff war, as well as expectations of interest rate cuts.
Resistance levels: 147.20, 147.89
Support levels: 145.85, 145.23
As part of the correction, the price may test the liquidity zone of 147.7 or 0.7f. A false breakout and consolidation of the price in the selling zone may trigger a further decline in both the short and medium term.
Best regards, R. Linda!

GOLD → Correction before continuing the rally to 3450FX:XAUUSD updates its local maximum to 3401.5 and enters a consolidation phase ahead of news. The dollar correction gives speculators a chance...
The price of gold is correcting from 3400. The reason is profit-taking ahead of Powell's speech at 12:30 GMT and waiting for clarity on US trade negotiations with the EU and Japan before August 1.
Gold remains sensitive to the progress of negotiations and the dynamics of the dollar, which is weakening amid political uncertainty, declining yields, and pressure on the Fed from Trump.
Technically, after exiting consolidation and retesting 3400, the price is entering a local consolidation phase.
Focus on key levels: 3401, 3382, 3375. A false breakdown of support could trigger a recovery phase.
Resistance levels: 3402, 3393
Support levels: 3382, 3375, 3362.75
The distribution phase has been halted by resistance, and the price has moved into a countertrend correction due to uncertainty. Markets are waiting for positive signals from the Fed. Local and global trends are bullish, which may support the price overall...
Best regards, R. Linda!

GOLD → Breakthrough accumulation. Correction before growthFX:XAUUSD has been strengthening since the session opened and is heading towards the 3374 zone of interest. The price has previously broken through the consolidation resistance and may test this boundary before moving further.
Gold is rising amid trade risks and dollar weakness. After falling to $3310, gold resumed its growth, seeking to break through the $3368 level. Support for prices was provided by uncertainty surrounding Trump's tariff policy and expectations for Fed Chairman Powell's speech. The US dollar weakened temporarily as investors sought refuge in gold amid trade disputes with the EU, political instability in Japan, and criticism of the Fed from the White House.
Technically, the price is in a realization phase after breaking out of consolidation, but it has encountered resistance at 3368, which could lead to a correction. The focus is on the 3350-3355 zone. If the bulls hold their ground above this zone, the market may return to the realization phase.
Resistance levels: 3368, 3374
Support levels: 3345, 3332
The market is bullish and feels support, especially against the backdrop of a weak dollar. Traders are watching Trump and Powell. If the latter decides to cut rates, for example tomorrow at 12:30 GMT, gold could rally...
Technically, gold could test 3350 before rising.
Best regards, R. Linda!

BITCOIN → Consolidation, retest of 120K. Correction of dominanceBINANCE:BTCUSDT , after a rapid rally and touching 123K, rolled back and entered consolidation, giving altcoins a chance. At the same time, Trump signed new crypto laws, but will these laws open new doors?
On June 18, the GENIUS Act was signed. Information can be found in the sources, but there is no direct reference to BINANCE:BTCUSDT.P , except perhaps indirectly: increased confidence in the crypto market, increased liquidity, possible new rules, and pressure on decentralized assets. Bitcoin has not always grown on positive news; more often it has been a deep pullback and liquidation before the momentum.
Technically, Bitcoin is currently consolidating, and I would highlight several key areas: the upper range is 120K-120.9K. The zone between these levels is particularly important, as this is where buyers were previously liquidated and sellers gathered (liquidation is possible).
The bottom is 117K (confirmed) - 116.2K. There is a liquidity pool on the support side.
additional scenario if the market does not reach resistance and decides to form a long squeeze before growth
Theoretically, I am not yet expecting a breakout and growth of Bitcoin. I think that consolidation may continue for some time, especially against the backdrop of a pullback in altcoins and a deep correction in the dominance index.
Resistance levels: 120100, 120850
Support levels: 117000, 116230
Since the opening of the session, the price has been working off the liquidity capture from 117K. There is a reaction - growth, which could bring the price to the zone of interest at 120K. But the question is: will the price hold in the 120K zone? A false breakout of resistance could trigger a correction to 117-116K. Thus, I expect the market to remain in consolidation for some time or even expand the current trading range...
Best regards, R. Linda!

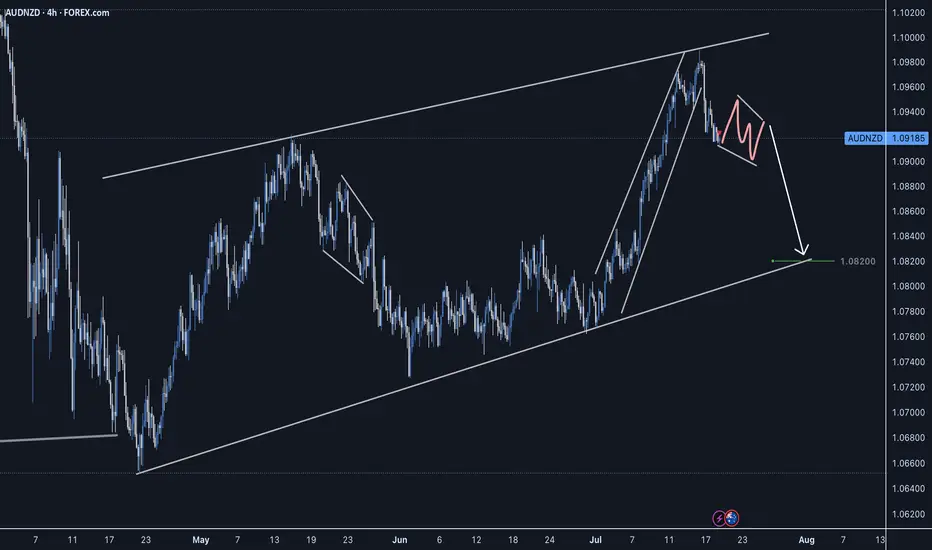
AUDNZD Short Setup - CAB EntrySellers stepping in, strong reversal impulse. Waiting for a slight correction before taking a short entry on the LTF.
Good Luck
EURAUD → Correction for accumulation before growthFX:EURAUD reaches the zone of interest during a correction and forms a false breakdown of local support. Traders can switch to the buy side to support the trend.
Against the backdrop of a global bullish trend and a correction in the euro, the currency pair is following this movement, the essence of which is to consolidate funds for further growth. Liquidation is forming in relation to the liquidity zones of 1.785, 1.78, and 1.773, and the market imbalance is changing. The current movement is bringing the price to the zone of interest: the liquidity area of 1.773 and the order block. The capture of liquidity relative to 1.773 leads to the formation of a false breakdown and a pullback to the area of interest for buyers. Accordingly, price consolidation above 1.776 and 0.7 Fibonacci could support the main trend and allow the price to strengthen.
Support levels: 1.776, 1.773, 1.763
Resistance levels: 1.786, 1.795
The euro clearly demonstrates an upward trend, the structure of which has not been broken during the correction. Correction is a perfectly healthy movement within a trend, allowing positions to be opened at more favorable prices. If the bulls hold their defense above 1.776, momentum towards the specified targets may form.
Best regards, R. Linda!

GOLD → Consolidation ahead of CPI. Chances for growth?FX:XAUUSD Gold is consolidating amid a correction in the dollar ahead of important news. Consumer price index data is due later today. The market is stagnant and will not move prematurely.
On Tuesday, gold rose slightly amid profit-taking ahead of the US CPI release. Investors are waiting for a signal from inflation: weaker data could strengthen bets on a Fed rate cut and support gold, while strong inflation would strengthen the dollar and put pressure on the metal. The situation is exacerbated by Trump's new tariff threats and his criticism of the Fed chair. Let me remind you of Trump's pressure on regulators regarding inflation and interest rate cuts.
Technically, gold is trading above the previously broken “symmetrical triangle” consolidation. Bulls are trying to hold their ground above 3340-3350. Focus on the current range of 3340-3373
Resistance levels: 3373, 3394
Support levels: 3350, 3340
Favorable news for gold could boost interest in the metal, which would generally lead to growth. However, there is a factor of unpredictability, and against this backdrop, gold may test support at 3350-3340. If the bulls manage to keep the price above this zone, we may see growth in the medium term. Otherwise, the price may drop to 3310-3280.
Best regards, R. Linda!

ETHEREUM → Correction to 2900 before growth BINANCE:ETHUSDT is entering a correction after a strong breakout of resistance. At the same time, Bitcoin is falling from 123K to 116K, triggering a pullback across the entire market...
On D1, ETH is facing strong resistance and is not yet ready to break it (it lacks strength after the rally). The most likely scenario after a false breakout is a correction to support. But the main focus is on Bitcoin — will there be a correction or a reversal of the local trend? If the flagship continues its decline, the cryptocurrency market will humbly follow suit.
ETH has a nearest zone of interest at 2913, where liquidity capture could attract buyers, but I do not rule out the possibility that the correction could go much deeper before further growth, for example to 2879-2827 (support on D1).
Resistance levels: 2992, 3041
Support levels: 2913.7, 2879, 2827
Technically, consolidation against a bullish trend. Confirmed support area 2913 - 2879. As part of the correction, the market is interested in capturing liquidity. If, against the backdrop of the current correction, the bulls manage to hold their ground above the specified support, ETH may still surprise us with its growth :)
Best regards, R. Linda!

GOLD → Consolidation. Long squeeze before growth to 3400FX:XAUUSD has broken through resistance at 3353-3357 since the session opened, and bulls are currently trying to keep the market in the buying zone. Should we expect a long squeeze before growth?
Gold is in local consolidation after breaking through a key level. The price is still in the consolidation phase formed during a week-and-a-half correction. The price reached a three-week high of $3,374 on Monday but fell after the EU's conciliatory statements. Investors are awaiting US inflation data and Chinese GDP figures as they assess the prospects for a Fed rate cut. Heightened geopolitical and trade tensions are keeping demand for safe-haven assets high.
Technically, gold has entered a local buying zone, but there is a fairly complex resistance zone above it, and consolidation is needed to break through it. Such patterns could include a retest of support and a liquidity grab before growth.
Resistance levels: 3373, 3394
Support levels: 3357, 3353, 3345
There is a possibility of a retest of eql 3353 in a long squeeze format and a return to resistance at 3373 for a breakout. I also do not rule out a retest of the key level of 3345. The global trend is bullish, with the price locally in a fairly wide range, with an emphasis on the support zone of 3345-3355. If the bulls can hold this zone overall, the market will have a good chance of rising to 3400-3450
Best regards, R. Linda!

Bitcoin – Rising channel with critical support at $119.000!The chart presented shows Bitcoin in a well-defined rising channel, highlighting a strong bullish momentum over recent trading sessions.
Rising channel
The price action is currently oscillating within the boundaries of this upward sloping channel, marked by parallel trendlines. The channel suggests that Bitcoin has been consistently making higher highs and higher lows, with the current price hovering around $121,794. The upper boundary near $123,200 acts as potential resistance, while the lower boundary of the channel provides dynamic support, suggesting a continuation pattern if this structure holds.
Uptrend
The overall uptrend is clearly visible and remains strong, especially since July 10th, where a significant bullish breakout occurred. The breakout was followed by steady gains, with minimal pullbacks, indicating strong buying interest and market confidence. The momentum shows a healthy bullish structure with minimal price overlap, characteristic of a trending market, which favors continuation as long as critical support levels remain intact.
Support area
A critical element in this chart is the key support area, highlighted in green. This support zone is located between approximately $118,500 and $119,600. This zone was previously a resistance level that has now turned into support following the breakout. It also aligns with the mid-level of the rising channel, reinforcing its significance. Should the price retrace, this area is likely to act as a cushion where buyers may step in again to defend the trend.
Fibonacci
Additionally, the chart features a Fibonacci retracement drawn from the swing low to the current swing high. The 0.618 Fibonacci level is particularly noteworthy, sitting at around $119,623. This level is known as the “golden ratio” in technical analysis and often acts as a strong retracement level during corrections. Below it, the 1.0 level is marked at $116,669, which represents a full retracement of the move and a deeper correction scenario if the support fails. These Fibonacci levels coincide with the key support zone, further validating it as an area of high confluence and likely buying interest.
Final thoughts
Overall, the technical structure remains bullish within the rising channel, with key levels of interest lying around $119,600 for support and $123,200 for potential resistance. A successful defense of the support area could propel the price higher toward the channel’s upper bound, while a breakdown may lead to a test of deeper Fibonacci retracement levels.
Disclosure: I am part of Trade Nation's Influencer program and receive a monthly fee for using their TradingView charts in my analysis.
Thanks for your support. If you enjoyed this analysis, make sure to follow me so you don't miss the next one. And if you found it helpful, feel free to drop a like and leave a comment, I’d love to hear your thoughts!
