GBPUSD → Correction amid a global bullish trend...FX:GBPUSD is testing the 1.345 - 1.35 area as part of a correction. The price is closing the imbalance zone and testing support, which may trigger a reaction. Further developments will largely depend on the dollar, which is testing resistance.
The daily market structure is quite strong. The correction against the backdrop of a strong trend is within acceptable limits, and bulls should fight to keep the price away from risk zones. GBPUSD, as part of the correction, closes the imbalance zone of 1.34 - 1.35 (0.7 - 0.79f) and forms a false breakdown of the intermediate support level of 1.3476. If buyers hold their ground in the 1.347-1.35 zone, the currency pair will be able to return to the global trend.
Support levels: 1.3476, 1.345, 1.3382
Resistance levels: 1.3511, 1.359, 1.375
Price consolidation above 1.349 - 1.350 will confirm the market's intentions. In this case, we can expect growth to 1.36 - 1.374.
Best regards, R. Linda!
Ascending Channel

USDCAD still bullish?
OANDA:USDCAD what's next, we are have bullish push, currently price in ASCENDING CHANNEL and in ascending channel is visible and one more ASCENDING CHANNEL (marked yelow), interesting chart,- can we see higher bullish push?
SUP zone: 1.36800
RES zone: 1.37600, 1.37900

BITCOIN → Stopping after the rally? What next? 125K or 110K?BINANCE:BTCUSDT rose and updated its historical maximum to a new record of 118K with “kopecks” (different prices on different exchanges). Now the price has supposedly stopped and entered a consolidation phase, but it is too early to draw any conclusions based on this alone...
Fundamentally, Bitcoin rose following the SP500 and NQ100 indices. The reasons are clearly geopolitical. The correlation level is not high, but the flagship is following the stock indices, which are also updating their historical highs.
Technically, Bitcoin has emerged from a two-month consolidation and entered a realization phase. So what's next? Continuation of the phase or correction? Let's take a look.
On the daily chart, I would highlight two zones. The risk and sell zone is below 117,500. If the price closes below this zone today/tomorrow, we will most likely be able to look for signals for a possible correction. As part of the correction, we can expect a decline to 115,500, 114,300, or even to the old ATH of 112K.
The second zone is the buying zone. A closing price above 118,400–118,900 and consolidation with the gradual formation of a breakout of structure may hint at a possible continuation of growth toward psychological targets.
Resistance levels: 118,400, 118900
Support levels: 117100, 116700, 115500
In the chart above, I have highlighted the situations, levels, and zones that interest me more precisely.
Now I am waiting for Bitcoin to retest resistance or support and confirm certain levels, based on which decisions can be made. I think that in the near future, Bitcoin will show us where it is headed. Updates will be published as something interesting emerges...
Best regards, R. Linda!

SOLUSDT → Countertrend correction and hunt for liquidityBINANCE:SOLUSDT looks quite promising on the bullish side. The price is testing one of the key resistance levels within the local trend rally. A correction is forming. Is it beneficial for us?
On the higher timeframe, we see a change in character, a breakout of the trend resistance, and the formation of an upward trend support line. Bitcoin is still bullish (locally) at this time, but it is consolidating, which generally provokes a correction in SOL as well. Focus on the 150-149 area. If the bulls are able to keep the price above this zone after the retest, followed by the formation of momentum, this can be considered a positive medium-term sign.
Locally, the price within the trading range of 149.36 - 158 is heading towards the area of interest and liquidity (eql) at 149.36. The current sell-off is most likely triggered by a large player seeking a more favorable entry into the market.
Resistance levels: 154.75, 156.8
Support levels: 149.36, 147.93
In the current situation, it makes the most sense to consider an intraday trading strategy. A countertrend correction and a retest of support could attract buyers...
Best regards, R. Linda!

GOLD → Distribution. There is potential for growth to 3450–3500FX:XAUUSD breaks through consolidation resistance and forms a distribution pattern. A breakout of 3345-3358 could lead to another rally amid high economic risks...
Gold is rising for the third day in a row amid growing concerns about new tariffs announced by Trump. He threatened to impose tariffs on Canada and most of its trading partners, as well as the EU. Despite the strengthening of the dollar, demand for gold remains strong due to uncertainty and expectations for US inflation data next week. Investors are cautious ahead of CPI and the Fed's possible response
The correlation between gold and the dollar is declining, with gold rising due to geopolitical reasons amid high economic risks.
If the bulls keep the price above 3300-3345, the market could be extremely positive for 3400-3500.
Resistance levels: 3345, 3358
Support levels: 3330, 3308
Gold has broken through the resistance of the “triangle” consolidation pattern and is forming a distribution phase towards the zone of interest 3345 - 3358, from which a small correction may form before growth. Since 3345 is an intermediate level, the focus is on 3358. I do not rule out the possibility of a long squeeze of the support levels 3330, the triangle support, and 3310 before the growth continues.
Best regards, R. Linda!

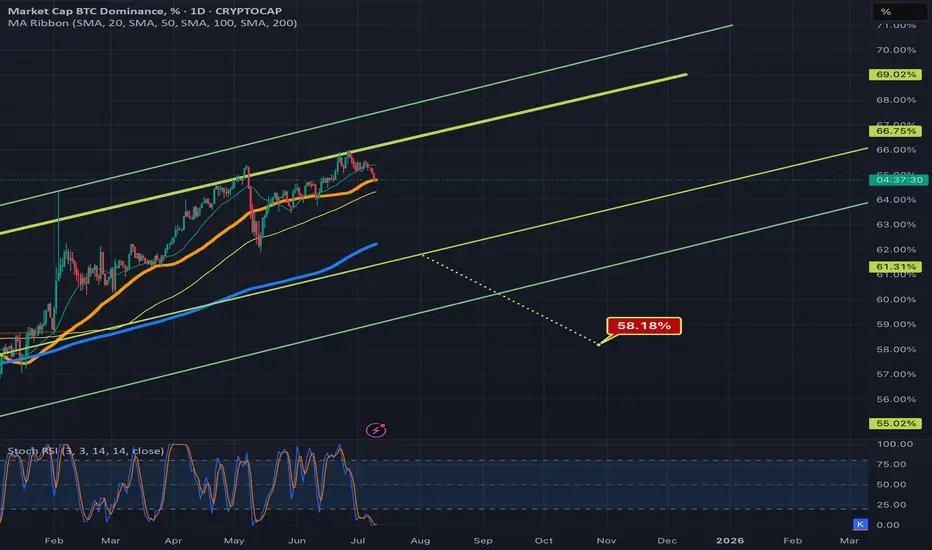
Bitcoin dominance chart ready to dump?Bitcoin dominance aka the btc.d chart has been in these 2 rising channels now for a long long tie, after ust recently being rejected down fro the top trendline of the neon yellow channel, there seems to be an opportunity here for it to potentially head down to retest the bottom trendline of that channel as well. If this occurs this could lead to an altcoin season. Price is right now combating the 50ma(in orange) and trying to maintain it as support. If this moving average flips to solidified resistance that greatly increases the chances of price going down to retest that bottom yellow trendline. Being that both of these channels are rising channels probability favors price action eventually breaking down from them instead of up so I have arbitrarily placed the measure move break down target of the yellow channel in a random spot below roughly where price could break down from the channel were it to be rejected strongly enough here by the 50ma. It’s retested this bottom trendline multiple times in the past and has always found away to avoid the breakdown thus far though so a breakdown there is definitely not guaranteed if it does retest the trendline, but even heading back down to retest the trendline in the first place may provide enough momentum for an alt season *not financial advice*
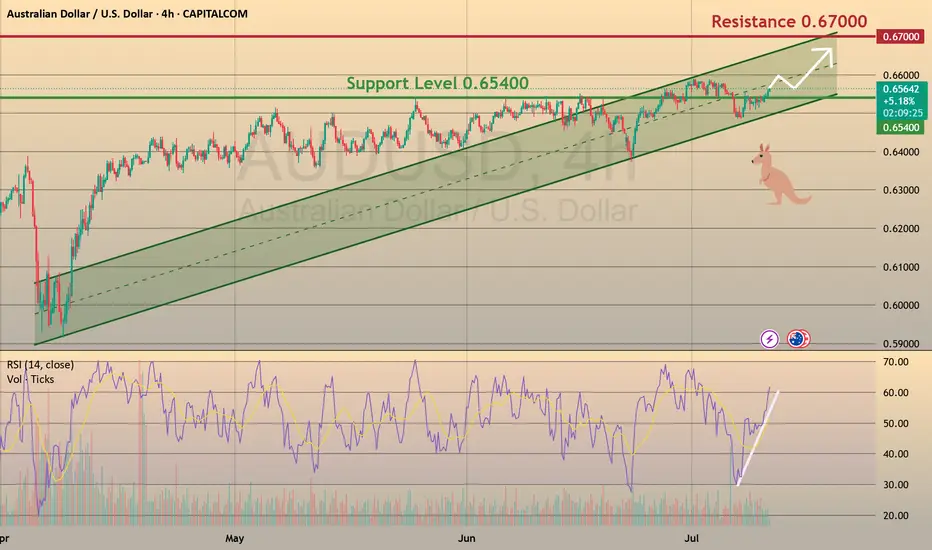
Aussie: Still Growing!
CAPITALCOM:AUDUSD
The bullish momentum continues after our last successful AUDUSD setup, and a move toward the 0.65900 resistance area looks probable now.
🪙 My Trading Plan:
🔼 BUY Stop: 0.65648
❌ Stop Loss: 0.65320
✅ Take Profit: 0.65965
💡 Why am I buying here?
✅ Price broke recent resistance at 0.65500, activating buy trades.
✅ RSI confirm ongoing bullish momentum 📊.
📰 Fundamental Situation:
🏦 RBA Rate Decision Supports AUD
The Reserve Bank of Australia (RBA) surprised markets by holding rates steady at 3.85% 🏛️, diverging from expectations of a cut. This cautious stance reflects the RBA’s preference to wait for clearer signs of slowing inflation 📉 before adjusting policy further.
Governor Michele Bullock emphasized that inflation risks remain persistent ⚠️, driven by high labor costs and weak productivity, possibly requiring a longer period of restrictive policy ⏳. Deputy Governor Andrew Hauser noted the bank is closely monitoring global risks 🌐, especially US tariff developments, underscoring sensitivity to global headwinds that could impact trade and growth 📦.
🌎 Trade Tensions in Focus:
President Trump ruled out extending tariff deadlines beyond August 1 ⛔, announcing new duties:
🔹 50% on copper 🪙
🔹 Potential 200% on pharmaceuticals 💊
🔹 10% on goods from BRICS 🌐
These moves are likely to intensify global trade tensions ⚔️, potentially impacting commodity flows and inflation, which the RBA and markets will continue to monitor closely.
BITCOIN → Market manipulation. Chance for growth to 110KBINANCE:BTCUSDT , as part of a correction triggered by negative news from the US regarding tariffs, is testing liquidity in the support zone. There is a chance of recovery to 110K.
Bitcoin is reacting with a decline to fundamentally negative data on tariffs from Trump. Technically, the price is facing support and forming a false breakdown, the purpose of which was to capture liquidity. This could lead to a recovery within consolidation in an uptrend, but again, there are conditions...
Countries that have received notification of tariffs are responding positively to cooperation (if this trend continues, Bitcoin could receive a local bullish driver).
The market perceives this as positive, and after liquidity is captured, the price could recover to the resistance of the trading range.
Resistance levels: 108230, 109690
Support levels: 107500, 106500
Bulls are trying to hold the local interim bottom at 107500. There is a reaction to the false breakdown of support. The focus is on 108230; if the market can break through this level, we will have a chance to grow to 110K.
Best regards, R. Linda!

EURUSD → Bullish daily structure. Correction before growthFX:EURUSD , after significant growth and a break of structure, has entered a local correction, the target of which may be a phase of accumulation of potential for updating intermediate highs (1.183).
The daily market model is bullish. A break of the structure has formed on D1, and the market is entering a correction phase, during which it may be interested in testing 0.5 or the 0.7 Fibonacci area before continuing its growth. I would also like to draw attention to the previously broken resistance level of 1.164 - 1.163, which, within the current correction, may act as a support level for buyers...
In addition, the market has not yet reached the liquidity level it was heading for during the correction for a possible continuation of growth. Zone of interest: 1.168, 1.164, 1.159
Resistance levels: 1.1728, 1.1766
Support levels: 1.168, 1.164, 1.159
A false breakdown of the specified support zone could change the market imbalance and attract buyer interest, which could generally support the bullish trend.
Best regards, R. Linda!

GOLD → Correction for confirmation before growthFX:XAUUSD is recovering due to increased demand as a safe-haven asset. After breaking through local trend resistance, an upward channel is beginning to form on the chart.
On Monday, gold tested the 3295-3300 zone (liquidity zone) and, against the backdrop of incoming economic data, is buying back the decline, forming a rather interesting pattern that could lead to continued growth, but there is a but!
Investors are reacting to President Trump's threats to impose tariffs on imports from a dozen countries starting August 1. In addition, the main question is the Fed's interest rate decision. The regulator is likely to leave the rate unchanged due to inflation risks.
Uncertainty surrounding tariffs is supporting interest in gold as a safe-haven asset. The market is awaiting further news and the publication of the Fed minutes on Wednesday.
Resistance levels: 3345, 3357, 3396
Support levels: 3320, 3311, 3295
A correction to support is forming. If the bulls hold their ground within the upward channel and above the key areas of interest, the focus will shift to 3345, a resistance level that could hold the market back from a possible rise. A breakout of this zone would trigger a rise to 3357-3396.
Best regards, R. Linda!

GBPUSD → Correction before the bullish trend continuesFX:GBPUSD is forming a trading range for consolidation of potential ahead of a possible continuation of growth as part of a countertrend correction.
The dollar is trying to recover from its decline due to a local change in the fundamental background, but the global trend for the DXY is bearish. This could provide support for the GBP to continue growing, provided that the bulls hold their defense above the 0.5 Fibonacci zone of the main impulse movement.
The market is holding GBPUSD within the trading range of 1.359 - 1.3675. The trend is bullish, and within the correction, liquidity may be captured from 1.359 before further growth.
Resistance levels: 1.3675, 1.3764
Support levels: 1.359, 1.3511
If the reaction to the subsequent retest of support at 1.359 is weak, we can consider a continuation of the correction to the 0.7-0.79 Fibonacci zone, which would be the most favorable entry point for us (focus on 1.3511 — a false breakout will increase interest in buying). In the current situation, the focus is on 1.359.
Best regards, R. Linda!

GOLD → Consolidation after a trend break...FX:XAUUSD , after breaking out of a downtrend, is consolidating, which may continue for some time due to Thursday's news and low liquidity on Friday.
Gold stabilized after a correction, but volatility risks remain. After falling from a weekly high of $3,366, gold prices found demand again in Asia on Friday. Strong US employment data cooled expectations of an imminent Fed rate cut, which supported the dollar and limited gold's gains. Additional pressure is coming from the hawkish shift in Fed expectations, but US budget risks and weak liquidity due to the holidays could increase price volatility in the coming days.
Technically, the focus is on the boundaries of the current consolidation at 3311 and 3357. In addition, within the range there is an important level of 3325, which divides the market into bearish and bullish zones...
Resistance levels: 3350, 3357, 3393
Support levels: 3325, 3311
It is important to understand the situation: due to the holiday in the US, liquidity is lower, making it easier to move the price. The rest of the world, interested in gold, can easily push the price up. The trigger will be the zone 3350 - 3350. There is a chance that the market will try to break through the resistance without a pullback and continue to rise to 3393.
However, the most likely scenario is that after yesterday's volatility, gold will remain within 3325 - 3357 before rising next week
Best regards, R. Linda!

GBPCAD → Retest the area of interest before growthFX:GBPCAD is closing the imbalance area as part of a countertrend correction and consolidating below the 0.5 Fibonacci level. What's next, growth or decline?
The global trend is upward, and the situation is classic: the market needs energy and liquidity to continue growing.
Locally, we see that as part of a countertrend correction, the market is closing the imbalance area, but at the same time forming consolidation below 0.5 Fibonacci, still leaving the zone of interest and order block below 1.84600 untouched.
Technically, there is a fairly high probability of continued growth, provided that the price ends its consolidation with a breakout of the 1.85690 resistance and consolidates above 0.5 Fibonacci.
Resistance levels: 1.85690, 1.8657
Support levels: 1.84986, 1.846, 1.8417
However, as an additional and, in my opinion, the most important scenario, I still consider a complete closure of the fvg and a retest of the 0.7-0.79 zone, within which the order block is located. A false breakdown of the zone of interest and the capture of liquidity could attract additional interest, which would trigger growth.
Best regards, R. Linda!

GOLD → Attempt to consolidate above 3350 for growth to 3400FX:XAUUSD , after retesting resistance at 3347, is breaking through the key level, while bulls are trying to hold their ground above support. There is potential for growth to 3400.
Gold retreated from its weekly high of $3366 ahead of key US employment data (NFP), which could set a new direction for the movement. But technically, this looks like a correction to consolidate above the level before continuing to rise. After three days of growth, the price faced selling amid a recovery in the dollar and profit-taking. Weak employment data (especially below 100,000) could reinforce expectations of a Fed rate cut as early as July and support gold. Conversely, a strong report will strengthen the dollar and put pressure on the metal. The market is bracing for high volatility
Resistance levels: 3363, 3393, 3400
Support levels: 3347, 3336, 3311
The price has entered a new range of 3345-3400. Consolidation is forming above the support level before a possible rise. I do not rule out another retest of 3345-3336 (liquidity zone) before realization and a rally to 3400.
Best regards, R. Linda!

GOLD → Retesting resistance may lead to a breakout.FX:XAUUSD breaks the downward resistance line on the senior timeframe and tests the upper limit of the trading range amid the falling dollar and Powell's speech. The metal may continue its upward movement.
The dollar's rise was short-lived after Fed Chairman Jerome Powell hinted at an imminent interest rate cut, but not in July... The probability of a rate cut in July fell to 22%, and in September to 72%.
Markets are awaiting fresh employment data (ADP and Nonfarm Payrolls), which could influence the prospects for rate cuts. Weak reports could revive interest in gold, but for now, the asset remains under pressure due to the short-term strengthening of the dollar and uncertainty surrounding Fed policy.
Technically, if the pre-breakout structure remains intact and gold continues to attack resistance within the local range of 3347-3330 (3335), the chances of further growth will be high...
Resistance levels: 3347, 3358
Support levels: 3336, 3316, 3311
The global trend is upward, and locally, the price is also returning to growth. If the bulls can maintain the current trend, break through the resistance at 3347, and hold their ground above this level, then the next target will be 3390-3400. I do not rule out a correction to 3325, 3316 (liquidity hunt) before the growth continues.
Best regards, R. Linda!

AUDUSD → Pre-breakout consolidation for trend continuationFX:AUDUSD may continue its upward trend. After another local distribution, the currency pair is consolidating and may repeat the cycle
The dollar index continues to fall, the global trend is clear, and the price is testing multi-year lows. After yesterday's speech by Powell, the decline may intensify amid expectations of a rate cut, which will only support AUDUSD.
AUDUSD is moving within an uptrend, stopping below resistance at 0.6583, but is not going to fall.
There was a false breakout (the zone was tested), the structure is not broken, and the price continues to squeeze towards resistance, which could lead to a breakout and growth
Resistance levels: 0.6583
Support levels: 0.6566, 0.6556
There is potential accumulation in the market, and the market is choosing growth against the backdrop of a falling dollar as its direction. Accordingly, the currency pair is one step away from a possible realization phase. Thus, if the price breaks 0.6583 and consolidates above this zone, it may continue to grow in the short and medium term.
Best regards, R. Linda!

GOLD → Retest of the resistance range. Correction?FX:XAUUSD is recovering amid expectations of lower interest rates in the US, and the falling dollar is also supporting the price of the metal.
The dollar remains under pressure due to political uncertainty in the US, budget concerns, and trade risks. However, strong stock market growth and possible tariff measures against Japan and the EU are also affecting the market, adding volatility to gold
Powell will speak at the ECB forum, and markets are waiting for him to hint at a rate cut. Currently, the probability of a cut in July is estimated at 20%, and in September at 77%. A dovish tone will support gold, while a hawkish tone will increase pressure.
Technically, since the opening of the session, gold has exhausted its daily range (ATR), and there is a fairly high probability that after strong growth, the price may be stopped in the 3347-3350 zone.
Resistance levels: 3347, 3350
Support levels: 3312, 3295
If gold cannot continue to rise after breaking through 3347 and the price returns to the resistance zone, then in this case, we can consider a correction to 0.5-0.7 Fibonacci before a possible continuation of growth.
Best regards, R. Linda!

NZDUSD → Pre-breakout consolidation. One step away from a rallyFX:NZDUSD is consolidating, but the chart shows signs of readiness to shift to a distribution phase, which could lead to a rally.
Against the backdrop of a falling dollar, which is continuing its main trend, the NZD may break out of consolidation in a distribution pattern. Since the accumulation is quite large (taking into account the long squeeze), the trend may be strong.
A pre-breakout consolidation is forming relative to 0.6080, followed by the price breaking through the resistance of the global trading range. Consolidation above 0.6080 will confirm the breakdown of the structure, which could trigger distribution
Resistance levels: 0.6080, 0.612
Support levels: 0.6062, 0.604
The price may be supported by a bullish trend and a decline in the dollar. A breakout from the 4-month consolidation may be accompanied by a continuation of the uptrend until the intermediate high of 0.6355 is reached in the medium term.
Best regards, R. Linda!

SOLANA → BINANCE:SOLUSDT.P is consolidating after breaking through trend resistance. The market trigger is 148.0, and Bitcoin is provoking the market to recover...
The market is buying back all the losses. SOL breaks the local downward resistance and forms consolidation with a trigger of 148.0. The market has come to life following the rallying Bitcoin. If the general trend continues, SOL may break out of the accumulation zone and form a distribution towards 154.0
The latest retest of resistance is provoking a correction. Before rising, the price may test the zone of interest at 144 or the lower boundary of consolidation at 142.2. The ideal scenario would be a false breakdown of support at 142.2 before rising.
Resistance levels: 148.0, 154.2
Support levels: 142.2, 137.5
Fundamentally, the situation for the crypto market is improving. Technically, the market is also showing positive dynamics. SOL is consolidating after growth, which is generally a positive sign. Now we need to wait for the price to break out of consolidation and continue its growth. One of the signs of this is a rebound from the 0.5 range and a quick retest of resistance with a gradual squeeze towards the trigger.
Best regards, R. Linda!

ALUMINIUM Futures at Best Support !!This is the 1 hour chart of Aluminium futures.
Aluminium is moving in well defined ascending parallel channel with Support at 245 level .
If this level is sustain , then we may see higher prices in the Aluminium Futures.
Thank you !!

TITAN ' s Key Point | Breakout | Swing.This is the 4 hour Chart of the TITAN COMPANY.
Titan has formed a Cup and Handle pattern and given a breakout .
Two possible scenarios:
If the breakout sustains with volume, the rally may continue.
If it retests the breakout level, it would offer a safer entry before the next leg up.
If this level is sustain then we may see higher prices in Titan.

RAIN INDUSTRIES ' s Key Support Zone This is the one hour chart of RAIN INDUSTRIES.
Rain Industries is moving within an ascending parallel channel with support around 140 range and resistance around 160 range.
If this level is sustain , then we may see higher prices in the
Rain Industries
Thank You !!

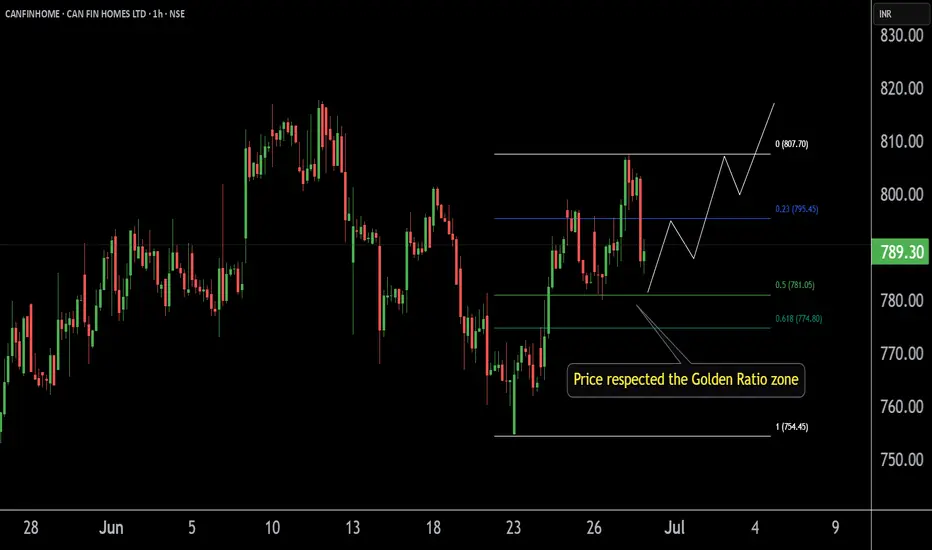
CANFINHOME'S Key ZoneThis is the 1 hour chart of CANFINHOME.
Canfinhome is taking support at the Fibonacci Golden Ratio zone.
If this zone is sustain then we may higher price in CANFINHOME .
Thank You !!