I think our final move to 35k is coming April 12th - May 7thThat is fast - My target for 35k was somewhere around May.
I don't like any of these indicators, but, CPI comes on April 12th, I am still bullish.
I will spot buy altcoins at 27.2k - 27.3k.
Ascending Triangle
XAUUSD : Gold Breakout Trading StrategyOANDA:XAUUSD
Hi , Trader's as you can see market is trading in ascending triangle
Ascending triangle is a bullish pattern , Price after breakout can reach next resistance level at 1986 area from there it can fall to 1974
It can retest 1974 area which now become it's support line
After completion of retest it will continue it's trend
❤️ Please, support my work with follow ,share and like, thank you! ❤️

an update on XLM's Bullish trendPrice finally managed to break the triangle.the price can easily reach the target(0.13) after a little correction.
Previous Analysis:
✅Access trading ideas, build strategies with drag and drop, backtest, and automate your trading for passive income with our Sponsor's platform Vestinda. check it out using the link in the Description.
_ _ _ _ _ _ _ _ _ _ _ _ _ _ _ _ _ _ _ _ _ _ _ _ _ _ _ _ _ _ _ _ _
🌍Thank you for seeing idea .
Have a nice day and Good luck.

DYDX/USDT LONG SCALP SETUP!!Hello everyone, if you like the idea, do not forget to support it with a like and follow.
Welcome to this DYDX/USDT trade setup.
DYDX looks bullish here. Breaks out from the ascending triangle in 4hr time frame and currently retesting it. Long some here and add more in the dip.
Target:- $2.58
Target2:- $2.72
Target3:- $2.88
Target4:- $3.10
SL:- $2.26
Use low leverage (5x-6x)
If you like this idea then do support it with like and follow.
Thank You!

BTC/USD: ascending triangle setupBitcoin forming an ascending triangle in H4 timeframe what we see a potential long position toward $31k.
To view in H1 timeframe, Bitcoin break up this structure forming a lower low in this downtrend line in this chart, what bulls made confirmation that want to lead the price to the new higher high.
In Daily timeframe still bullish, but we can to see another possibility that Bitcoin may to down toward $26k key support level to then see a smart buy in that zone. But well, in Daily timeframe we're in the range, meanwhile in H4 look bullish setup
So guys, I put the trade information in this display to look if you decide to entry to long position in Bitcoin right now.
Meanwhile, I was check out the new features that Trading View team created and I want to study it new emoji, stickers and new features that appear in my tools.
Good luck!!!

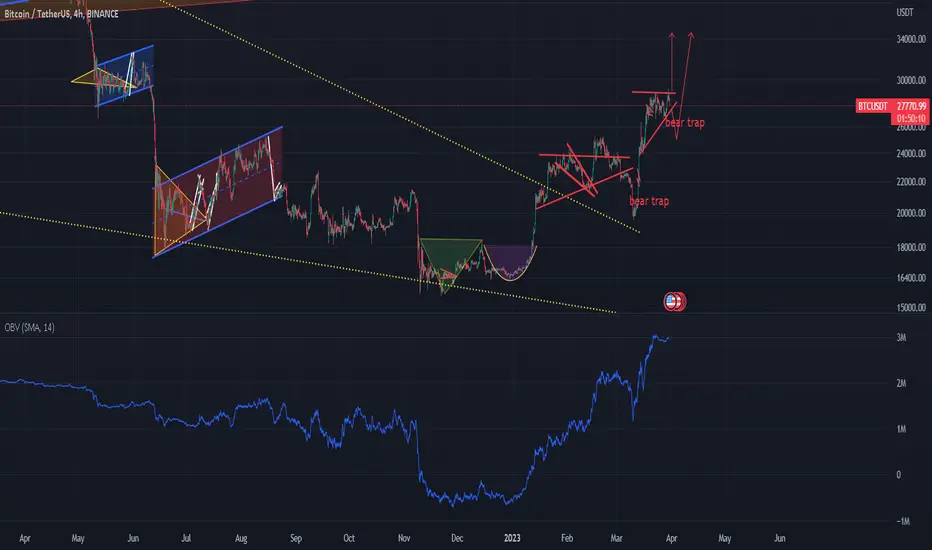
BTC short term (1h candle)We recently broke down from our small ascending triangle (blue lines) and hit the target shortoy after perfectly! (White dotted lines and yellow horizontal)
We then quickly bounced upward to retest the bottom of the triangle, which looked like rejection!
Currently looking at other possible plays. Mainly a upward parallel channel (green lines). As you can see we are reacting nicely to the centre line nicely using it as both support and resistance.
Will keep you updated

Near Identical Rally SetupHello! Yesterday I posted an idea based on ascending triangles that turned into a pretty good trade (link below). In this idea, you can see that one included as well. The first set of triangles was yesterday's setup. Today's idea shows another set of triangles that have formed and they are nearly identical to yesterday's. I'm going to leave my long open for now. There was even a small dip at the end of the first triangles that has played out again here. Though I am long I think it's a pretty precarious situation. They won't play out the same way necessarily. There is many other factors I take into consideration when taking a position.
- Yesterdays Idea

Textbook Ascending Triangles - Too Obvious?You can see very bullish looking, clear cut ascending triangles that would point to a breakout very soon. Seems so obvious, too good to be true almost. I find crypto rarely does what seems most obvious. I'm suspicious of these, though, I still gotta lean bullish on this one. They're too perfect to ignore!

Ascending Triangle on NZD/JPY @ W1This pattern on the weekly chart of NZD/JPY resembles a mix of ascending and symmetrical triangles and provides a bullish breakout trading opportunity. The triangle's borders are marked with the yellow lines. My potential entry is marked with the cyan line. My potential take-profit level is marked with the green line. The stop-loss is to be set to the triangle's low at 77.068.

Is there a bearish ascending triangle forming in US oil?- There looks to be the early stages of an ascending triangle forming on the US Oil chart.
- Since the previous trend was down, this ascending triangle should be considered bearish.
- Measuring the height of the triangle's base projected downward from the break-out point near the apex of the triangle, puts price at around the $66 mark.
- Break-down achieved by no later than Dec. 2023.

LKQ - Hidden Divergence - BullishOn the chart of LKQ, we can see a forming ascending triangle and we can see hidden bullish divergence on daily timeframe.
An ascending triangle is a bullish formation. The pattern gets validated when the price breaks out of the upside of the pattern.
By using the Relative Strength Index we can hidden bullish divergence.
A long position can be taken when the resistance of the triangle turns into a support.
See all further details on the chart.
Goodluck!

Buy Bitcoin at 17600 | Secret level
Buy/long Bitcoin at 17600, because there is an unfilled GAP between the previous candles. It's the start of the huge parabolic uptrend, and the bulls will most likely defend this level!
It looks like Bitcoin is going to reach levels above 25000 after we fill the GAP and complete this Elliott Wave corrective pattern (ABC). Currently, we are in wave B.
Why should Bitcoin not fall below the 17600 level? There is no reason to go down because the majority of liquidity is exactly at this point.
What is the target for wave C? Wave C 's target will be specified in one of my next analyses. Make sure you follow me! We need to use a FIB extension from Wave A -> B later to help determine the target. But at this point, we can speculate between 25000 and 39000.
On the chart, I can see a strong impulse wave (A). This gives us a great chance for a continuation to the upside after we finish this correction.
This analysis is not a trade setup; there is no stop-loss, entry point, profit target, expected duration of the trade, risk-to-reward ratio, or timing. I post trade setups privately.
If you haven't seen my previous analysis, where I told you that Bitcoin could go to 10k, make sure to check it out right now!
At this point, we need to be patient and wait for bitcoin to reach 17600. If we reach this level, it's a good idea to turn bullish again and buy some great altcoins as well.
Thank you, and for more ideas, hit "Like" and "Follow"!

Ethereum Monthly Ascending Triangle Interesting formation on the ETH monthly chart - forming what looks to be an ascending triangle.
Typically asc. triangles break upwards, could take time to play out.
Just an observation, not a trade plan.

My Favorite Setup1. Breakout resistance zone with gap on earnings day.
2. Confirmation of resistance turning into support.
3. Fly to next support zone.
* 𝗧𝗵𝗲 𝗶𝗻𝗳𝗼𝗿𝗺𝗮𝘁𝗶𝗼𝗻 𝗮𝗻𝗱 𝗮𝗻𝗮𝗹𝘆𝘀𝗶𝘀 𝘀𝗵𝗮𝗿𝗲𝗱 𝗶𝗻 𝘁𝗵𝗶𝘀 𝗽𝗼𝘀𝘁 𝗶𝘀 𝗻𝗼𝘁 𝗳𝗶𝗻𝗮𝗻𝗰𝗶𝗮𝗹 𝗮𝗱𝘃𝗶𝗰𝗲. 𝗔𝗹𝘄𝗮𝘆𝘀 𝗰𝗼𝗻𝗱𝘂𝗰𝘁 𝘆𝗼𝘂𝗿 𝗼𝘄𝗻 𝗮𝗻𝗮𝗹𝘆𝘀𝗶𝘀 𝗮𝗻𝗱 𝗿𝗲𝘀𝗲𝗮𝗿𝗰𝗵.

Bitcoin to 10K! Disgusting
This is a bearish technical analysis of Bitcoin. It's supported by technical tools, and I am not saying this is going to happen; this is just a scenario because we need to consider all possibilities.
First of all, we need to take a look at the bearish wave from November 2021 to November 2022. It definitely looks like an impulse wave; it's pretty obvious, but I have seen a lot of failed impulses on the other side. You may say that it's not an impulse but a WXYXZ triple-three corrective pattern. It's possible, but in my opinion, these patterns tend to have more sideways price action than steep. You may also say that it's an ABC correction, but there are clearly 5 waves.
Since November 2022, Bitcoin has been going upward. The wave looks very strong, and I think we will reach levels above 25K before a potential drop to 10k to complete an ABC correction. It's very likely that this is going to happen.
Currently we are in wave B, which is a corrective wave, and we could end this wave at around 20k or 19k at the 0.618 FIB retracement.
I do not watch news often, to be honest; I am more of a technical guy, but I can't ignore the Binance bad news. There is speculation about the closing of the Binance US exchange, and their stable coin, Binance USD (BUSD), has some problems as well. But I am not surprised at all. A potential collapse of Binance could send Bitcoin to 10k in just a matter of days. For example, you can take a look at the COVID crash in 2020; it was a pretty fast liquidation of longs.
This analysis is not a trade setup; there is no stop-loss, entry point, profit target, expected duration of the trade, risk-to-reward ratio, or timing. I post trade setups privately.
10k is a strong psychological level, and there is plenty of reason to buy Bitcoin here. 0.618 LOG FIB retracement and the start of the GAP are definitely reasonable targets.
Like I said before, this analysis is just a scenario that could happen to give you more perspective on the market. I always have a bullish and a bearish scenario ready to execute, so it's not about being wrong or right; this is not how you trade markets.
Let me know in the comment section, do you think Bitcoin is going to drop to 10k? Or we are going to a new all time high.
Thank you, and for more ideas, hit "Like" and "Follow"!

STOCK NAME { IGL } SWING TRADEswing trade perfect symmetrical triangle short term opportunity for upside take trade after breakout from the trendline according to own risk this is not call just a analysis.

Bitcoin - Best plan for the next week!
First, Bitcoin is going to drop to 21833 or even a little bit lower at the start of the week, probably Monday or Tuesday. After that, we should see a massive pump to the upside to fill the previous unfilled GAP, which is around 23395.
The bulls should step in at around 21833 because, technically, we will finish the ABC correction from the Elliott Wave perspective. Also, we will close the previous GAP.
Don't get caught with your shorts in this white trendline. I can see this trendline everywhere on social media. If you enter a short, you will get REKT.
This analysis is not a trade setup; there is no stop-loss, entry point, profit target, expected duration of the trade, risk-to-reward ratio, or timing. I post trade setups privately.
I am bearish on Bitcoin overall, and I think we are going to reach 17k-18k before a massive bull market takes us to a new all time high.
If you want more of these short-term analyses on Bitcoin, hit the like right now so I can see if you are also interested in the short-term periods.
The whole crypto market is going to go down, including ETH and XRP. Only a few stronger coins will keep pumping.
Thank you, and do not forget to leave a comment if you trade these short-term moves!

REVIEW $ARRYFA
V - YES
IV - NA
G - YES
TA
- TR - soon ( bullish )
- Broke previous downtrend ( bullish )
- Inverse H&S ( bullish )
- Cup & handle ( bullish )
- Ascending triangle ( bullish )
- > MA - Yes

2023 looks awfully similar to 2019, I am Long here. I copy pasted the previous cycle chart and it literally looks like a copy. I am long here, I have confidence that we will definitely not go below 20k. The indicators are also the same, with 1D close to resetting; I expect us to top out at 35k around May 2023.

Bitcoin - No one is expecting this! (react fast)
The new monthly candle is closed as a DOJI. This is one of the most powerful reversal candles that can happen at the end of a trend. The previous candle from January was a huge green candle, so this DOJI from February is an indication of bullish exhaustion. The bulls were not able to continue the uptrend, and the bears stepped in. This is the psychology behind this reversal candle, and of course, do not forget that the monthly interval is very powerful; that's why it has a lot of value.
On the chart, you can see the gate to a new bull market. We are going to enter through the gate later this year, but not now. I expect a last pullback to 17k - 18k to fill the gap and retest the previous market structure. Simply, we need a retest because that's what markets usually do.
This is what is going to happen. The market never moves in a straight line, and because the bear market was extremely steep, the bulls need more time to recover and accumulate!
This scenario is not just an option that can happen; in my opinion, it's very likely to happen! But it's also good news for people who still need to buy cheap bitcoin.
At this point, we can see an incomplete reversal pattern. I feel like I am missing something. The right shoulder is not yet formed, and the GAP is unfilled. If we continue to go higher, then it will be even worse because otherwise we are going to crash even more at a higher level.
The DXY index is rising at this moment, and we will reach much higher levels.
This analysis is not a trade setup; there is no stop-loss, entry point, profit target, expected duration of the trade, risk-to-reward ratio, or timing. I post trade setups privately.
I think the majority is now bullish, and everyone is talking about the future of bitcoin and how it's going to be great. It will, but now we need to shake out these traders from the market by going down.
There are a lot of signs of trend reversal on lower timeframes, too. The bears started to sell, and you can identify this action, of course, because the price action never lies. It looks like the sellers are back.
Thank you, and for more ideas, hit "Like" and "Follow"!

BTCUSDT - Ascending TriangleAs price breaks out from Descending Triangle is it possible that we are forming an Ascending Triangle? Calling early.
Descending Triangle analysis.

Bitcoin to 18k. The big crash is coming!
It looks like Bitcoin has completed the first bullish impulse wave, which is a very positive sign for the future, but right now the correction is in progress.
As you know, from the Elliott Wave perspective, wave 2 corrections are usually deeper, especially in crypto. 0.618 FIB or even lower is a classic retracement, and because we have a huge unfilled GAP, this is going to happen!
0.618 FIB is at 18658 (LOG), and the start of the gap + POC of the previous consolidation structure is at 16830. Only these two levels are important; the others are insignificant. So you want to buy bitcoin at these points!
The market always moves in waves, no doubt about it. The waves in crypto are absolutely different from the stock market because different environments have different personalities. What works on the crypto market doesn't work on the stock market. If someone claims that his bot or trading system works on all markets, including forex, indices, crypto, commodities, and stocks, he is most likely lying to you. It is best to concentrate on a single type of market; in my case, that is crypto. I don't trade forex, stocks, or gold because the market movements are very different. It's like comparing apples to beef steak; they look different and taste different. It's better to eat the beef steak.
We can see on the chart that there is a large unfilled GAP between approx. 16830 and 20407. These gaps tend to be filled sooner or later. I think maybe it's better to fill the gap right now than next year. You probably do not want Bitcoin to go to 40k and then dump back to 16k next year; this would be as ugly as the COVID crash in 2020.
The bulls didn't react to the major supports on lower timeframes, and it's a huge sign of weakness at this moment. The structure was bullish, but currently at this point, it's extremely bearish to me.
So what is the plan now? You can trade Bitcoin on futures and trade reactions on the previous structures. For example, 21,950 is a strong level and bitcoin could bounce from it, so you can take some intraday trades with a few % of gains before it collapses down to the abyss. You can definitely short bitcoin. I will make these types of trades in the next few weeks. Once bitcoin reaches my reversal zone, I will take some brutal long trades with an extremely high RR and a target of 30k+.
March is going to be a very bearish month. And usually Bitcoin starts to pump significantly when April starts. You can do a back test. April is a very positive month.
Thank you, and for more ideas, hit "Like" and "Follow"!

BA FEB24 220/FEB17 225 DIAGONAL CALLHIGH BASE SET-UP
Detailed Definition of setup and what market conditions are desirable
Ok, so on January the 13th, BA made a new swing high and it's been trading above the 50-day SMA...really since about November 2nd. So as far as trend analysis goes, BA looks like it has more momentum to the upside in the coming months.
Detailed Definition of the trigger (entry point) used to enter positions
You can say this also has an ascending triangle pattern but I saw this more as a longer than 5 day base with lower or equal volume. I had set an alert for 212.15 using yesterday's high as my trigger. I also wanted to wait until earnings to see the price action. Seems to me as this has a higher probability of it going higher.
Detailed Definition used to determine Stops (abandon or adjust)
No stops will be used. I'm set up for max loss risking under 2% of my portfolio.
Detailed Definition of the methods used to determine targets
Let's take a look at the 4 hour chart. Since about November 10th 2022, it's been poking it's head above it until the price action brought it into the upwards channel I drew. So if it trades in this area until the 17th of this month.. then it should come close to my 225 target. But it may even want to jump up to the other channel above it and push to 230, 235, 240 maybe? That's why I went with a diagonal strategy just incase it does take off more.
How strike prices and expiration dates are selected
If we look at the hour chart I think it may want to slowly trade within this channel to get to 225 by the week of the 17th. Also, this traded in this range of 200ish to 225ish for most of the back half of 2021. So I would think it might want to trade in this area once again. 3 weeks is more than enough time for this trade to unfold.
Position management strategies when the stock goes lower
If the stock goes lower I'll let the combo expire worthless since I'm set up for max loss.
Position management strategies when the stock goes sideways
Again, set up for max loss so if it just stays here, i'll let it expire worthless and move on to the next trade.
Position management strategies when the stock goes higher
This is the outcome I prefer. If this goes straight through 225 and stays above 225 come the 17th, I'll close out the entire combo. That's why I would prefer this pushes up to the higher channel and stays above 225 until the 17th.
Position management strategy at expiration
Come February 17th, if this is trading below 225, I'll let my 225 strike expire and hold on to my 220 strike until the 24th. The week of the 24th I'll monitor this and close out the 220 strike once it gets to my 225 target.
