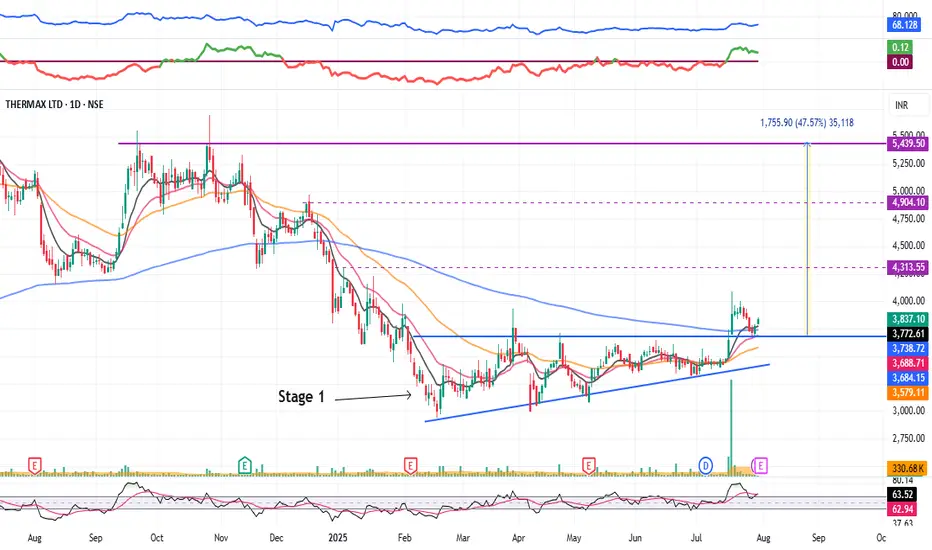
Thermax : Stage 1 Breakout (1-3 Months)#Thermax #stage1nreakout #ascendingtrianglepattern #patternbreakout #trendingstock #swingTrading
Thermax : Swing Trading
>> Stage 1 Breakout + Retest done
>> Ascending Triangle @ bottom of Downtrend
>> Trending setup in stock
>> Good strength & Recent Volume Buildup
>> Low Risk High Reward Trade
Swing Traders can lock profit at 10% and keep trailing
Pls Boost, comment & Follow for more Analysis
Disc : Charts Shared are for Learning Purpose & not a Trade recommendation. Pls consult a SEBI Registered Advisor before taking position in it
Ascendingtrianglebreakout
$FET Ascending Triangle Incoming PUMP? 1 Hour Time FraNYSE:FET 1Hr Time Frame
📝 Technical Analysis:
FET is currently forming an ascending triangle pattern, a typically bullish continuation structure. This pattern is developing after a clear retest of the demand zone between $0.7038 and $0.7390, which previously acted as a strong support area.
✅ Key confirmations:
- Two clear rejections from the lower boundary of the ascending triangle, suggesting strong buying interest.
-A break of the previous bearish trendline, shifting market sentiment from bearish to neutral/bullish.
-Volume consolidation seen in the lower portion of the chart aligns with the tightening price action – often a precursor to breakout.
📊 Price Action Insights:
- The next potential retracement is expected around the Golden Pocket (0.618–0.65 Fib zone), which aligns with both the ascending triangle support line and demand zone – this confluence adds strength to the level.
- A breakout above the triangle's resistance, with confirmation, would present a long opportunity.
- Fair Value Gaps (FVGs) on the 4H timeframe are visible overhead at:
$0.7873 – $0.8061
$0.8401 – $0.8470
These serve as profit-taking targets for any bullish breakout trades.
📊 Volume Profile:
Using the anchored Volume Profile:
- High volume node is seen around $0.9141–$0.9889 – indicating historical resistance where price may slow down.
- Low volume node (volume gap) exists in the mid-region, implying a potential fast move through this zone if the triangle breaks upward.
❌ Invalidation Criteria:
This bullish setup is invalidated if:
- Price breaks below the ascending triangle support, followed by a loss of the swing low and demand zone below $0.7038.
This would likely lead to a continuation of the prior downtrend.
🧠 Conclusion:
The setup currently favors bulls, provided the ascending triangle holds. A confirmed breakout above resistance opens the path toward the identified FVG zones. However, risk management is crucial around the support area as a breakdown would negate the bullish structure.

How Can You Use the Ascending Triangle in Trading?How Can You Use the Ascending Triangle in Trading?
An ascending triangle is a chart pattern traders rely on to identify potential breakouts and further price movements. Recognised for its versatility, this pattern can signal trend continuations across all types of markets, including stocks, forex, commodities, and cryptocurrencies*. In this article, we’ll break down how to spot and trade this formation.
What Is an Ascending Triangle?
An ascending or rising triangle is a bullish chart pattern that usually signals a trend continuation. It is framed by two trendlines. The upper line connects highs placed at almost the same level, while the lower line is angled and connects higher lows.
The triangle’s appearance is explained as follows: buyers try to push the price up, but they meet a strong resistance level, so the price rebounds. Still, buyers have strength, which is reflected in higher lows. Therefore, they continue pushing the price until it breaks above the resistance level. The period during which the price bounces back and forth between the two lines depends on the timeframe. On daily charts, the triangle can be in place for over a week.
Note: The ascending triangle is a continuation chart pattern but sometimes it can be used as a reversal signal. It happens when the ascending triangle occurs in a downtrend. It’s the biggest challenge of all the triangles.
The rising triangle is one of the setups in the triangle group. There are also descending and symmetrical formations.
Ascending, Descending, and Symmetrical Triangles: The Differences
The triangle group of patterns comprises ascending, descending, and symmetrical formations.
The ascending triangle is a bullish formation and the descending triangle is bearish. At the same time, the symmetrical triangle is a bilateral setup that signals a rise and a fall in the price.
To distinguish between them, traders draw trendlines. In a rising triangle pattern, an upper trendline is horizontal and connects equal or almost equal highs, while the lower trendline is rising as it connects higher lows. In a descending or falling triangle pattern, the lower trendline is horizontal and connects equal or almost equal lows, while the upper trendline declines, going through lower highs. A symmetrical triangle has a falling upper line that connects lower highs and a rising lower line that connects upper lows.
How Traders Spot the Ascending Triangle
It’s quite easy to identify the formation on a chart. Still, there are a few rules that may help a trader determine its strength.
- The trend strength. Although the setup may appear on any timeframe, traders look for strong long-term trends as risks of a fakeout on low charts are higher.
- Consolidation. Triangles appear when the market consolidates within an overall trend.
- Trendlines. Trendlines must be drawn through at least two points. Still, the larger the number of points, the higher the possibility the setup works.
- Breakout. Can the ascending triangle pattern be bearish? No. It is a bullish formation that appears in a bullish and a bearish trend but always signals a potential price rise.
How Can You Trade Ascending Triangles?
The rising triangle pattern is usually considered a continuation setup formed in an uptrend. Still, if the ascending triangle is in a downtrend, it may signal a trend reversal. The trading rules will be the same in both cases.
As with most chart patterns, triangles have specific rules that help traders place entry and exit points.
Entry
The theory suggests trades go long when the price breaks above the setup's upper boundary. In a conservative approach, traders wait for the price to form at least several candles before entering the market. In a risky strategy, traders open a position as soon as the breakout occurs, and the breakout candlestick closes.
It's worth considering trading volumes as breakouts often turn into fakeouts, meaning the market returns to its previous trend. The chance of a strong breakout is higher if the volumes are high.
However, increased volumes aren't the only tool used to confirm a breakout. Many traders consider trend indicators and oscillators to potentially limit the risks of bad trading decisions.
- If the triangle serves as a continuation setup, it may be helpful to look at the signals of trend-strength indicators, including the average directional index.
- If traders use the ascending triangle as a reversal setup, they usually implement indicators that may signal a trend reversal, including the moving average, the relative strength index, the moving average convergence divergence, and the stochastic oscillator.
Take Profit
A standard take-profit target equals the size of the largest part of the setup and is measured just from the breakout trendline.
Stop Loss
Traders consider several options when placing stop-loss levels. In a conservative approach, they implement the risk/reward ratio, which is usually 1:2 or 1:3 but depends on the trader's willingness to take risks. Also, traders utilise the upper trendline as a threshold and place the stop-loss order just under it.
Note: These are general rules. However, traders can develop their own trading strategies and adjust the pattern's parameters and rules according to their trading approach.
Ascending Triangle: Strategy
In this strategy, traders observe an existing bullish trend and the formation of an ascending triangle, which suggests the potential for a continuation pattern. Incorporating a short-term moving average, such as a 9-period EMA, provides dynamic support, aligning with the trendline to strengthen the setup.
Entries
- Traders typically wait for the price to break through the top trendline of the ascending triangle.
- A strong candle breaking the resistance level adds confidence, though any move above the top trendline can serve as an entry signal.
- The price should also trade above the moving average, offering additional confirmation.
- An order is often placed at the top trendline, anticipating a retracement to this level, which now acts as support.
Stop Loss
- Traders place a stop-loss below the most recent swing low within the triangle.
- For more conservative traders, the stop may be set at any prior swing low, depending on risk tolerance.
Take Profit
- Many traders aim for a risk-reward ratio of 1:2 or 1:3.
- Profits might also be taken at the next strong resistance level, aligning with the market structure.
Rising Triangle: Benefits and Drawbacks
This formation has advantages and pitfalls that traders consider when developing their strategies.
Benefits
- It can be used on any timeframe. Triangles are formed on charts of any period. Still, they might be more effective if the setup appears in a solid trend on a high timeframe.
- It can be used for any asset. Another advantage is that the ascending triangle pattern is used for stock, commodity, cryptocurrency*, and Forex trading.
- Easy to spot. A trader only needs to draw two trendlines to define this setup on the chart.
- Exact entry and exit points. Although traders can develop their entry and exit points, the setup assumes there are specific rules traders with any experience utilise.
Drawbacks
- It can confuse traders. As the rising triangle is used as a reversal and continuation formation, traders with less experience may be confused with its signals.
- False breakouts. The setup works when a price breakout occurs. However, there is a high risk the breakout will appear to be a fakeout, and the price will return.
- The pattern may fail. Aside from a fakeout, there is another risk when trading with triangles. The price may break another side of the formation, and the formation will fail.
- The trading rules may not work. Although specific rules indicate where a trader should place entry and exit points, buyers may be too weak to push the price to the take-profit target.
Final Thoughts
The ascending triangle is one of the more common chart patterns traders use when trading various assets. Still, there is no 100% guarantee that it will work every time you spot it on a price chart. It's vital to remember that every signal must be confirmed with other indicators, chart patterns, and candlesticks. Also, it's a well-known fact that any trade involves risks that should be considered every time a trader enters the market. Improve your skills by practising on different assets and timeframes.
FAQ
How Do You Form an Ascending Triangle?
An ascending triangle is formed when the price action creates a series of higher lows while facing a resistance level, resulting in a horizontal upper trendline and a rising lower trendline. The price consolidates between these two lines before potentially breaking out above the resistance, signalling a bullish continuation.
Is an Ascending Triangle Bullish or Bearish?
The ascending triangle is a bullish pattern. It suggests that buyers are gaining strength as higher lows form, increasing the likelihood of a breakout above the resistance level. There is a descending triangle pattern that usually appears in a downtrend, signalling a downward movement.
How to Enter an Ascending Triangle?
According to the theory, in triangle pattern trading, it’s common to enter the market when the price breaks above the upper trendline of the triangle. In a conservative approach, traders wait for confirmation through several closing candles after the breakout. The increased volume also adds confidence to the trade.
What Is the Ascending Triangle Pattern Retest?
A retest occurs when the price breaks out of the triangle but then briefly falls back to test the former resistance level. A successful retest confirms the breakout and can provide an additional entry point.
How Long Does an Ascending Triangle Pattern Take to Form?
The formation of a bullish triangle pattern can vary based on the timeframe. On daily charts, it can take several days to weeks, while on shorter timeframes, it might form within hours.
What Is the Difference Between an Ascending Triangle and a Rising Wedge?
In comparing the ascending triangle vs. the rising wedge, it’s key to recognise that the rising wedge has converging trendlines, signalling a possible weakening trend, often leading to a bearish reversal. In contrast, an ascending triangle trading pattern typically signals a continuation of the uptrend.
*At FXOpen UK, Cryptocurrency CFDs are only available for trading by those clients categorised as Professional clients under FCA Rules. They are not available for trading by Retail clients.
This article represents the opinion of the Companies operating under the FXOpen brand only. It is not to be construed as an offer, solicitation, or recommendation with respect to products and services provided by the Companies operating under the FXOpen brand, nor is it to be considered financial advice.
(ETH/USD) Poised for a Major BreakoutMarket Structure & Analysis:
Falling Wedge Breakout: Ethereum previously broke out of a falling wedge pattern, which is a bullish reversal signal.
Ascending Triangle Formation: Price is currently forming an ascending triangle, indicating potential for a breakout.
Support Levels:
$2,021 – Local support.
$1,926 - $1,873 – Strong demand zone.
Resistance Levels:
$2,120 - $2,251 – First resistance zone.
$2,531 - $2,564 – Final bullish target zone.
Trading Plan:
Buy Setup:
Enter long on breakout above $2,120 with strong momentum.
Stop Loss: Below $2,021 (support level).
Take Profit Targets:
TP1: $2,251 (first resistance).
TP2: $2,531 (main target).
TP3: $2,564 (extended bullish target).
Risk Factors:
A failure to break $2,120 could result in a pullback to $1,926.
Macroeconomic factors or Bitcoin’s movement may impact Ethereum’s trend.

XAUUSD → Will Retrace till 2802-2794 but after hitting 2835Hello Traders!
As gold has made its ATH 2830 which was also a trendline where gold respect that trend line and down now every thinking for retracement but gold will do a breakout till 2835 as gold done on previous trendline
gold can hit 2835 easily before drop to retracement level of 2794, so for now i am bullish till 2835 in that zone i will see a good entry for sell.
Support: 2802
Resistance:2830
Fib Golden Zone: 2794-2796
Liquidity Zone: 2794
Gold will continue its trend after retracement but we need a good entry for sell almost from 2835

XAUUSD → Expected to retrace to 2802-2794 after hitting 2835.Hello, Traders!
like gold has made its ATH 2830, which was also a trendline that gold respected, and down now every thinking for retracement, but gold will do a breakout till 2835 like gold did on the previous trendline.
Gold will easily reach 2835 before dropping to the retracement level of 2794, thus I am bullish until 2835, when I will find a decent entry point for selling.
Support: 2802.
Resistance: 2830 Fib. Golden Zone: 2794–2796
Liquidity Zone: 2794
Gold will continue its trend following the retracement, but we need a decent entry point to sell almost from 2835.

TELCOIN 3 Ascending Triangles PatternTelcoin has been following a very distinct pattern with it's ascending triangles.
NOV TELCOIN TRIANGLES
NOV 12 - 9 Day Build, 48 Hour Pump, 55%
Nov 23 - 3 Day Build, 24 Hour Pump, 44%
Nov 28 - 2 Day Build, 12 hour Pump, 33%
It leads me to believe that
BASED ON THIS PATTERN
The next triangle "Breakout to peak" will be under 14 hours long and will be about 22% return.
Short term breakout target for Telcoin is $0.0092.

ARE YOU INTUIT?! Trade setup!ARE YOU $INTUIT ?! Trade setup!
1️⃣ MY #HIGHFIVESETUP trading strategy
2️⃣ Ascending Triangle Pattern
3️⃣ My plan for this trade
Short🎯 $703
Med. 🎯 $870
Long 🎯 $1070
Chart 3/5 dropping
Do you like this trade setup?
NFA AMEX:SPY #tradingstrategy
NASDAQ:INTU

Ascending Triangle Pattern Tutorial: 3/8 Bullish PatternsAscending Triangle Pattern Tutorial: 3/8 Bullish Patterns
An ascending triangle is a bullish continuation chart pattern that signals the potential for an upward breakout. Here's how it forms:
Flat Upper Trendline: The upper trendline is flat, indicating a resistance level where the price consistently faces selling pressure and fails to move higher.
Rising Lower Trendline: The lower trendline is ascending, showing higher lows as buyers step in at increasingly higher prices.
Price Convergence: The price action gets squeezed between the two trendlines, leading to a tightening range.
Breakout: Eventually, the price breaks above the resistance level, indicating a continuation of the upward trend. This breakout is typically accompanied by a surge in volume.
Ascending triangles are popular among traders because they offer clear entry and exit points. The height of the triangle, measured from the base to the horizontal resistance, can be used to estimate the potential price target following the breakout.
LIKE l FOLLOW l SHARE

META's NEXT BIG MOVE!!! Are you ready?!NASDAQ:META 's NEXT BIG MOVE!!!
1️⃣ MY #HIGHFIVESETUP trading strategy
2️⃣ Ascending Triangle Pattern
3️⃣ My plan for this trade
Short🎯 $600
Med. 🎯 $706
Long 🎯 $780
Chart 2/5 dropping
Are you adding it to your watchlist?
NFA NASDAQ:QQQ #trading
NASDAQ:META

WILL CARNIVAL CRUISE LINE ($CCL) CONTINUE TO SAIL HIGHER?! 50%+🚢 WILL CARNIVAL CRUISE LINE ( NYSE:CCL ) CONTINUE TO SAIL HIGHER?! 50%+ Potential! 🚢
NYSE:CCL had a rough ride during the COVID pandemic as everyone stayed home, not vacationing, and definitely not cruising. But could it be ready for a massive comeback?
In my latest video, I break down the "High Five Setup" trading strategy, the ascending triangle breakout, and when to possibly enter this exciting trade.
Trade Idea:
Entry: $20
Exit: $17.88
PT1: $26
PT2: $30.64
Thanks for watching and for all the support! Let me know what stock or video you want to see next.
LIKE | FOLLOW | SHARE
Not financial advice.
#StockMarket #Trading #Investing #CarnivalCruise #HighFiveSetup

Decoding the next Big Bull - Jio FinanceJIO Finance - from the day of its Demerger listing - had gone thru a very subdued performance up until now. Finally the Tiger is out of the bushes and is showing up its real power
On the Technicals front - we can derive the Near to Short term view using chart patterns. Long Term view is still strongly bullish, but due to lack of history and patterns, we are proposing Incremental targets
Technical Analysis: Near to Short Term view
On Daily Time Frame, price has already completed a beautiful Cup and Handle Pattern / Bullish Ascending Triangle pattern with Target of 300.
Price did reach very close @ 295 to the target but fell sharply, retracing back to the C&H BO zone and took a bounce - now forming a Fresh Rounding Bottom pattern. BO above 296 WCB for New Target of 335
Disclaimer:
Stocks-n-Trends is NOT registered with SEBI. We do not provide Buy / Sell recommendations - rather we provide detailed analysis of how to review a chart, explain multi-timeframe views purely for Educational Purposes. We strongly suggest our followers to "Learn to Ride the Tide" and consult your Financial Advisors before taking any positions.
If you like our detailed analysis, please do rate us with your Likes, Boost and share your comments
-Team Stocks-n-Trends

BTC broke the horizontal resistance of Ascending Triangle37k or 50k upcoming. Multiple patterns indicating a move.
I love trading BTC when volatility is aggressive...
Easy Money.

Compressing the Compressor - Elgi EquipmentElqi Equipment is a leading manufacturer of Compressor mainly for the Railways. Given the Focus & Investment on railway sector by govt of India - many railway themed stocks are flying.
Elqi Equipment on Monthly is getting compressed in an Bullish Ascending Triangle formation. Its a Double Resistance -
1) Long Term Parallel Channel BO pending
2) Ascending Triangle BO pending
BO for both same - above 580 WCB will take to a target of atleast 300 points to 885. Enjoy the ride
Disclaimer:
Stocks-n-Trends is NOT a SEBI registered company. We do not provide Buy / Sell recommendations - rather we provide detailed analysis of how to review a chart, explain multi--timeframe views purely for Educational Purposes. We strongly suggest our followers to "Learn to Ride the Tide" and consult your Financial Advisors before taking any positions.
If you like our detailed analysis, please do rate us with your Likes, Boost and share your comments
-Team Stocks-n-Trends

The Multi-Bullish Voltas20-Dec-2023 - Voltas - Multi-Bullish Patterns
Weekly - I can see atleast 3 Bullish Patterns
1. Rounding Bottom BO done above 928, Target 1117
2. Double Bottom around 740 levels - Target 1050
3. Bullish Ascending Triangle - BO done
Predictions become accurate when multiple patterns work In-Sync.

TRON/BTC , Ascending triangle , timeframe 1 weekFormation of an ascending triangle on such a large timeframe.
Working out of the previous descending triangle is shown by red lines!
Price is clamped in the triangle, volumes are decreasing, there is a possibility of accumulation of coins before the breakout and achieving the specified goals
Thank you for your attention

GBPUSD Ascending Triangle Pattern Breakout. We expect further downside on this pair, signalled by the ascending triangle channel pattern breakout. We can also see the formation of a low high which signals a change in trend from bearish to bullish as well as a breakout of a key level which further supports our directional basis.

KASUSDT Ascending Triangle BreakoutKASUSDT Daily is about to break out of a nice ascending triangle pattern. A fairly new crypto so no overhead resistance. Also breakout coincides with a market cap of around 1 billion.

A Winner run for BAJAJ FINSERV?BAJAJ FINSERV looks promising for an upside gain as it makes new powerful momentum swings. The stock has formed a ascending triangle zone where it tried breaking out near previous resistance zones. After being an underperformer for over an year it would be interesting to see if it can break through previous price points & recover to form new highs.

Covid & Vaccine Related Novavax Long Play in the cardsHi guys! So lately theres been some buzz on a particular variant, increased cases of hospitalizations and government backing. At risk population that require vaccinations/ boosters will always exist. Therefore, i believe this fact along with various technical analysis findings can make companies such as Biontech, Moderna and even not as famous Novavax potential plays.
(Look below for my analysis on Biontech)
Jumping right in. This is a technical analysis on Novavax (NVAX) on the 3 day timeframe.
Zoomed in we can see that we have a GOLDEN CROSS.
Between the:
21 EMA
50 SMA
Being on the 3 Day its ALOT more Powerful than having it on 1 Day and it may influence the larger timeframes. Which is what we want.
We have also maintained SUPPORT on both Moving Average. (21 EMA and 50 SMA)
This is a great sign, if we continue like how we are with our current candle during the close that would further confirm Support and a bullish case in my opinion.
This 3 day candle will close on the 8th of September. Pay attention to how big the body of candle gets on the close.
With this i would like Volume to start to pick up especially if and when we get to the "flat trendline".
Another important development to notice is the Ascending Triangle.
This can be giving us evidence we are in the process of BOTTOMING out.
Watch for the breakout ABOVE the Flatline. This with confirmation of Support on flatline would be a Major Area to take Long Positions.
I would ADVISE AGAINST buying inside the triangle. But Belowthe Ascending Support Line would be an area for Stop losses.
Watch also how the MACD acts. If we continue in Green and the Blue/Orange lines make it ABOVE 0 level. We will be off to the races, as it would be the necessary catalyst that provides momentum to have the triangle play out.
__________________________________________________________________________________
Thank you for taking the time to read my analysis. Hope it helped keep you informed. Please do support my ideas by boosting, following me and commenting. Thanks again.
Stay tuned for more updates on NVAX in the near future.
If you have any questions, do reach out. Thank you again.
DISCLAIMER: This is not financial advice, i am not a financial advisor. The thoughts expressed in the posts are my opinion and for educational purposes. Do not use my ideas for the basis of your trading strategy, make sure to work out your own strategy and when trading always spend majority of your time on risk management strategy.

USD/CAD HTF Bullish Confluence? Multiple Breakout OpportunitiesBullish Outlook
In this post (Bearish Outlook and former post update below), I highlight the potential bullish confluence we’re seeing on multiple higher time frames. This HTF reversal could begin with the former strong support level that we broke through but could act as support again – this would create an extremely convincing Inverse H&S as our left shoulder has tons of liquidity already built up.
Current Buy Trades:
On the Mid Time frame (2hr) - If we do break out on the 2HR with a healthy retest and bullish CHoCH, we will reconsider for a potential IHS signal upward toward the mitigated HTF supply zone and attempt to create a Major CHoCH to the upside.
On the higher Time Frame: we should keep an eye on the weekly and daily charts for pattern confluence and strong level breakouts.
This potential confluence of the bullish flag and Inverse H&S on the weekly is showing strong signs as the selloff has been controlled within this channel and if we do see a breakout of channel and neckline, we could make our HTF move up.
Confluence:
If we do see some bullish structure start to form, we might see confluence on multiple time frames which would be a very bullish HTF signal:
1. 2HR – Bullish breakout of ascending triangle and CHoCH
a. Subsequent BOS and LTF trade signal to upside.
2. Daily – Inverse H&S neckline retest and breakout
a. Resistance to turn support
3. Weekly – Breakout of bullish flag upper channel and neckline of IH&S.
LAST POST Summary and Update: (Bearish Outlook)
As I mentioned in my previous post, on the higher time frame weekly chart we mitigated our demand zone and hit expected resistance at the top of our bearish channel and failed to make a higher high. We then smashed through a strong support level and created a major CHoCH. We just recently mitigated that higher time frame supply zone but failed to make a high so we are currently on the bearish path toward a new lower low.
Our projected trade from last post (linked below) is still in play and awaiting its Choch signal. As we can see we have twice mitigated our LTF supply zone as I mentioned would occur in my previous post (linked below), and are awaiting an entrance signal via 2HR (MTF) CHoCH and subsequent 15min supply zone mitigation.
Current 2HR Sell trade:
We are now creating an ascending triangle and although typically a bullish signal, due to the HTF outlook, I’m looking for a potential liquidity grab from the upper resistance level and a fake out. If we do grab liquidity and see a strong move I’m looking to short this on the rejection of the triangle breakout.

TRACUSD Hidden Ascending TriangleTRACUSD daily forming what I am now calling a Hidden Ascending Triangle Pattern. I have charted a few of these patterns that break out temporarily only to fall back within the triangle. Also a nice horizontal level of support and resistance running through the middle as well.

A Variation Of The Ascending Triangle On The Weekly TRACETHOrigintrail has a history of outperforming ETH. This looks like a variation of the Ascending Triangle Pattern. With a well-defined horizontal level of resistance.
A very nice looking chart that complements the TRACUSD chart I have also linked to below.
