HA-RSI + Stochastic Ribbon: The Hidden Gem for Trend & MomentumNavigating volatile markets requires more than just raw price action. The Heikin Ashi RSI Oscillator blends the power of smoothed candlesticks with momentum insights to give traders a clearer picture of trend strength and reversals.
At Xuantify , we use the Heikin Ashi RSI Oscillator as a hybrid momentum and trend tool. While the indicator calculations are based on Heikin Ashi values to smooth out noise and better capture trend dynamics, the chart itself displays standard candlesticks (real price data) . This ensures that all signals are aligned with actual market structure, making it easier to execute trades with confidence and clarity.
This dual-layer approach gives us the best of both worlds: clarity from smoothing and precision from real price action. MEXC:SOLUSDT.P
🧠 How We Use It at Xuantify
At Xuantify , we integrate the Heikin Ashi RSI Oscillator into our multi-layered strategy framework. It acts as a trend confirmation filter and a momentum divergence detector , helping us avoid false breakouts and time entries with greater precision. We pair it with volume and volatility metrics to validate signals and reduce noise. Note the Stochastic Ribbon Overlay as shown in the chart, very accurate for momentum.
⭐ Key Features
Heikin Ashi Smoothing : Filters out market noise for clearer trend visualization.
RSI-Based Oscillation : Measures momentum shifts with precision.
Color-Coded Bars : Instantly identify bullish/bearish momentum.
Dynamic Signal Zones : Customizable overbought/oversold thresholds.
Stochastic Ribbon Overlay : A powerful multi-line stochastic system that enhances momentum analysis and trend continuation signals.
💡 Benefits Compared to Other Indicators
Less Whipsaw : Heikin Ashi smoothing reduces false signals common in traditional RSI.
Dual Insight : Combines trend and momentum in one visual.
Better Divergence Detection : Easier to spot hidden and regular divergences.
Visual Simplicity : Clean, intuitive design for faster decision-making.
⚙️ Settings That Matter
RSI Length : Default is 14, but we often test 10 or 21 for different timeframes.
Smoothing Type : EMA vs. SMA – EMA reacts faster, SMA is smoother.
Overbought/Oversold Levels : 70/30 is standard, but 80/20 can reduce noise in trending markets.
📊 Enhancing Signal Accuracy
Combine with Volume Oscillators to confirm momentum strength.
Use Price Action Zones to validate oscillator signals.
Look for Divergences between price and oscillator for early reversal clues.
🧩 Best Combinations with This Indicator
MACD : For cross-confirmation of momentum shifts.
Bollinger Bands : To identify volatility squeezes and breakouts.
Support/Resistance Levels : For contextual trade entries and exits.
⚠️ What to Watch Out For
Lag in Strong Trends : Like all smoothed indicators, it may react slightly late.
Over-Optimization : Avoid curve-fitting settings to past data.
Standalone Use : Best used in conjunction with other tools, not in isolation.
🚀 Final Thoughts
The Heikin Ashi RSI Oscillator is a powerful hybrid tool that simplifies complex market behavior into actionable insights. At Xuantify, it’s a core part of our strategy toolkit, helping us stay ahead of the curve with clarity and confidence.
🔔 Follow us for more educational insights and strategy breakdowns!
We regularly share deep dives into indicators, trading psychology, and backtested strategies. Stay tuned and level up your trading game with us!
Ashi

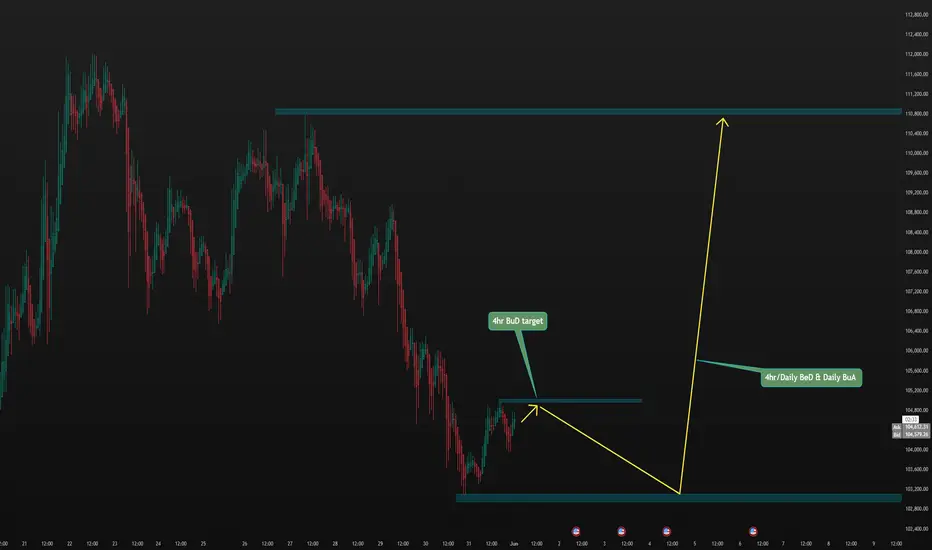
Bitcoin analysis based on Heiken-Ashi4hr, daily forecast based on HA pattern. We'll come back to validate it.
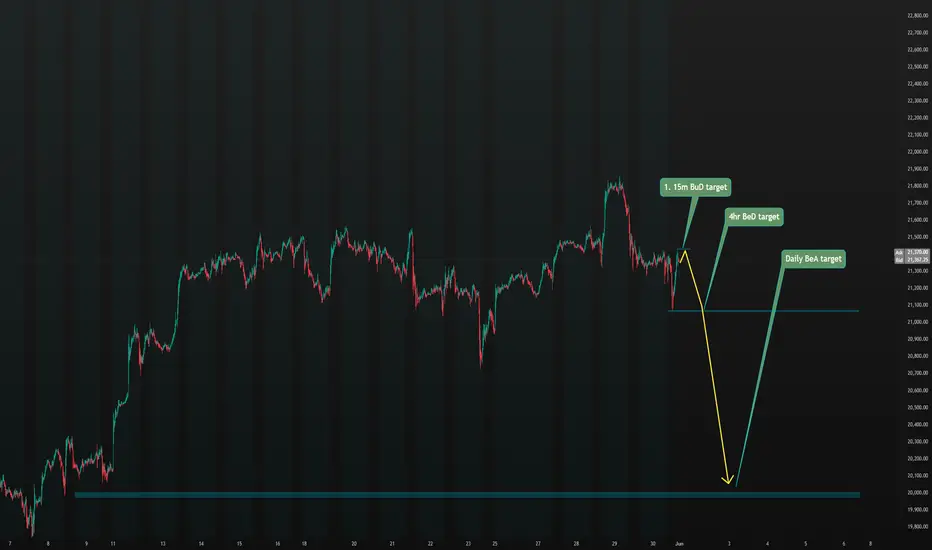
E-Mini Nasdaq 100 analysis based on Heiken-Ashi15m, 4hr, daily forecast based on Heiken-Ashi chart pattern, as I couldn't find any patterns on 1 hour chart, ones that found were already validated by this time. We'll come back to this to validate it.
Heikin Ashi VS Regular candlesticks - EducationalNASDAQ:AMZN
Everything is explained in the video.
I hope you will find it very educational and test it. Those who trade stocks will probably switch to Heikin Ashi :)
Thank you!

GBPCHF; FXAN & Heikin Ashi trade exampleOANDA:GBPCHF
In this video, I’ll be sharing my analysis of GBPCHF, using FXAN's proprietary algo indicators with my unique Heikin Ashi strategy. I’ll walk you through the reasoning behind my trade setup and highlight key areas where I’m anticipating potential opportunities.
I’m always happy to receive any feedback.
Like, share and comment! ❤️
Thank you for watching my videos! 🙏

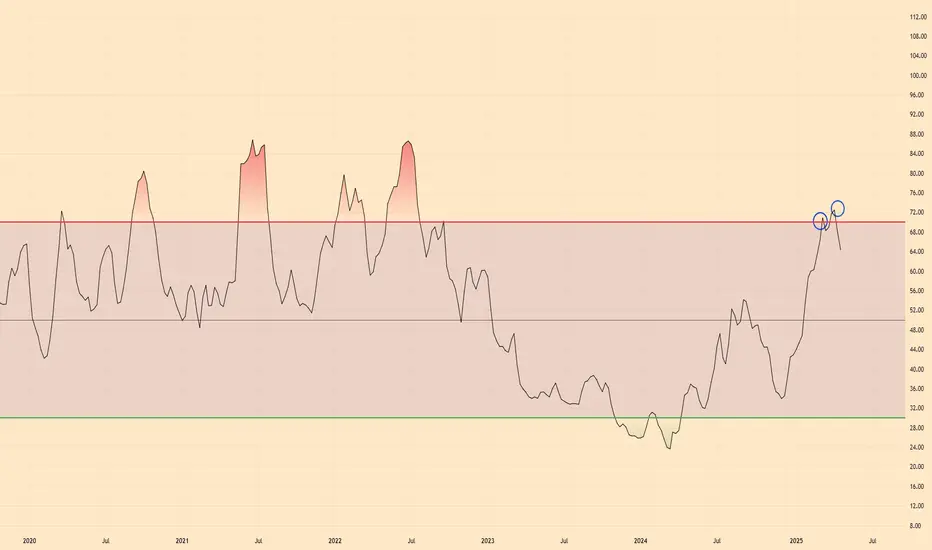
$USDC | Altseason Incoming.....FinallyCRYPTOCAP:USDC Dominance looks to be Double Topped on the RSI side and per historic movements, this looks promising for the market.
I say, BRING ON THE ALTCOINS.
$RBN | Showing glimpses of lifeAdded to my Altcoin Portfolio:
• COINBASE:RBNUSD @ $0.13876 bringing my average cost from $0.17 -> $0.1511
Notes/Thoughts: Typically I would wait until the Weekly Close for my buys as it’s only Tuesday but I like the market pump currently & perceived momentum plus price is still held in a Weekly Demand area without collapse.

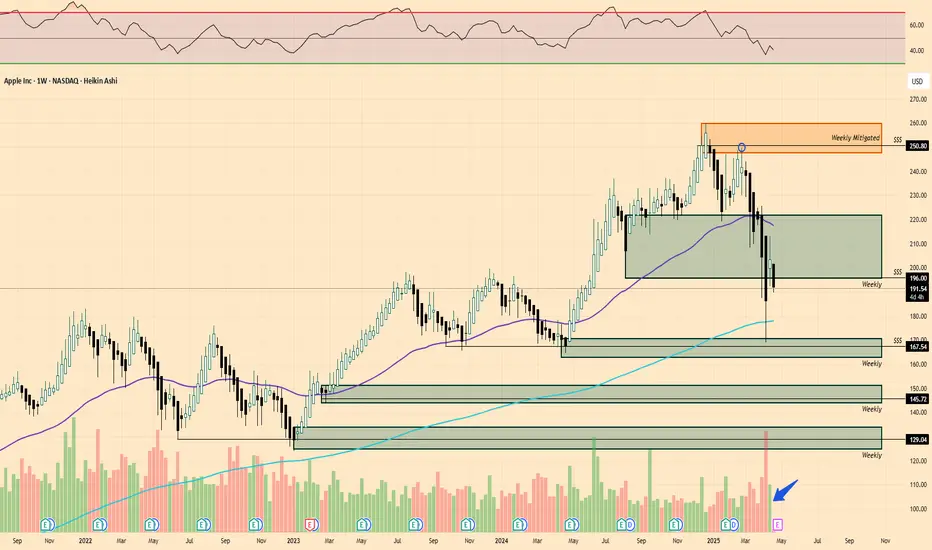
$AAPL | $200 showed lifeThese are my levels I am most concerned with for NASDAQ:AAPL
Last week, $200 level showed life and buyers stepped in but that doesn't mean we are out of the woods and price currently is in semi "no man's land", kind of just hanging around the demand area.
One bright point is bullish price volume last week as well.
I would wait to see how this week turns out before putting money back into the iPhone company.
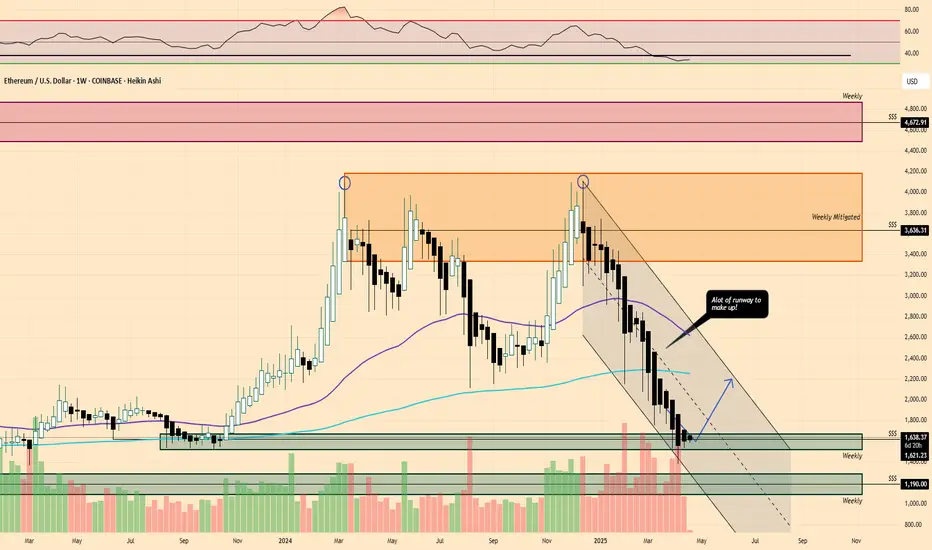
$ETH Next Move?Despite the FUD around Ethereum, I am focused on the charts and what they tell me.
I look at the downside that has brought us in this Weekly buying area. That downside was a clear move and looks great for a nice run back up.
I would still like to see a green candle present on this Weekly close to signify buyers but I think things are brewing for CRYPTOCAP:ETH
FXAN & Heikin Ashi Trade IdeaOANDA:AUDNZD
In this video, I’ll be sharing my analysis of AUDNZD, using FXAN's proprietary algo indicators with my unique Heikin Ashi strategy. I’ll walk you through the reasoning behind my trade setup and highlight key areas where I’m anticipating potential opportunities.
I’m always happy to receive any feedback.
Like, share and comment! ❤️
Thank you for watching my videos! 🙏

Ada strategic reserve idea Trump has single handedly turned Ada into a desirable digital asset, as he looks to add it to the U.S strategic reserve along side Bitcoin. Now if it actually happens I believe these fib levels and trend line are good targets. It's crazy how one man can turn vaporware into a desirable digital asset. All bets are off however if the strategic reserve does not get passed. Ada will most likely die then.

Testing Top range potential shortI'm looking at XLM as longer-term bearish, with a good short entry here as it has pulled back into resistance zone and started moving down again.

USDCAD SELLPrice consolidated for a while, and sellers pushed down breaking the previous low. Price has gone up to retest the previous support, which is now acting as resistance. Price is expected to continue downwards to the zone around 1.4120 as sellers prepare to push price further south.

Master the ORB using Heikin AshiBe simple in your trades,
Identify entry,
Enter a trade with stoploss,
Get green
Move stoploss to breakeven (optional)
Trail your profit (Optional)
Stay Green
Get Out
Simple. Rinse Lather Repeat!

Master Trading with Heiken Ashi Candles in 11.32 minutes Let’s talk about how to DOMINATE the market using Heiken Ashi candles for perfect entries and exits! This is where your trading game levels up.
First, when those candles start turning smooth and green with no wicks at the bottom, that's your entry signal! It’s like the market saying, "Hop on, this train is about to take off!" You ride those green candles as long as they stay strong and wick-free at the bottom.
Now, here’s the key – watch for red candles starting to form with wicks on top! That’s your signal to EXIT! Don’t get greedy, secure those gains, and get out before the market turns against you.
With Heiken Ashi, you get smoother trends, cleaner signals, and better trades! Enter with confidence, exit with precision, and OWN the market!
That's it, fast and powerful! Now go crush those trades!


SUIUSDT MOVING AS PLANNEDINTRO: congratulations to those of us who took this trade on SUI, went and still moving well as planned
follow me, so that you will be the first person to get a notified when ever i drop a new update, signal or idea

Mastering Market Trends: An Introduction to Heikin Ashi CandlesHeikin Ashi candles, originating from Japan, are a distinct type of candlestick chart used in technical analysis to identify market trends. The term "Heikin Ashi" translates to "average bar" in Japanese, which reflects their method of calculation
This video explains Heikin Ashi candles and how they can be used to improve entrances and exits.

Silver Bullet Strategy on US30 Wrap - up (Traded in profit)This is a wrap-up video to finalize the earlier setup on US30. The video is linked below.
Using this method, you can validate pivots and liquidity unmitigated in the market during phase 1 of the session.
This tells you where to trade to for phase two. You use the unmitigated levels found during phase one.
Phase 3 is the silver bullet momentum area where its telling you how the market will react and move for phase 4.
This tells you if you should be taking longs or shorts which helps you to understand which levels need to be taken out on either side of the market.
In the next few days ill put together a step by step tutorial on how to achieve the use of this setup to lock in your trades with more confidence.

My Silver Bullet Strategy analysis for US30Id be happy to teach this one to you guys.
Im working on a strategy specifically designed for Forex Markets.
There is a system i am creating called my version of a Silver Bullet Strategy that allows you mark out the phases of forex markets and as a result you can better plan your entries instead of having to sit there and wait for price action to play out the way youd like to.
This method is based on time and volatility of the market, and using just a session indicator with proper settings can help you get the information you need.
I cut the video early because i cant wait for the market to play out but ive already marked up the chart.
Ill post an image below of the completed days run of US30 so we can see how my mark ups coincide with the price action analysis.

4 hour 9 and trendline resistance As long as Btc etf outflow remains negative we are now in a down trend. I wouldn't be suprised if doge crashed to 6 cents again...

You don't need Heikin AshiHeikin Ashi is a popular trend indicator.
The open values of Heikin Ashi point out the potential trend reverse price level.
However, not all chart services privide Heikin Ashi.
In fact, there is an another way to estimate the open values of Heikin Ashi.
It is SMMA.
William Alligator uses 3 SMMA at a time.
We can set
Offset = 0
Lips = 2
Teeth = 8
Jaw = 32
Lips , also SMMA(2), estimate the open values of Heikin Ashi of the current timeframe.
Teeth and Jaw are the preview of the open values of Heikin Ashi in higher timeframes.

Doge 12hIf doge can still appreciate in value then anything is truely possible. 9 on the 12h and stoch at high. Also a sell the news event is very close.
