ASTUSDT ASTBTCHello my friends
This is a good opportunity to profit in a bull market
Buy and hold it
Don't need SL but you have to be patient
AST

ASTUSDT| Long position for countertrend retest!Hello trader! Today I have a new idea for you. Like and subscribe to the channel, there is a lot of useful information there.✅
The coin has confirmed a local countertrend on the reverse side, locally you can try to gain a long position with a short stop!
Deal plan:
Entry - 0.0844/0.0835$
Stop - 0.0802
Take - 0.0865 we fix 50-60% of stops and put them in used
Guys, try to be as careful as possible and monitor your risk management

AST/USDT - AirSwap: BBand_Breakout◳◱ A Bollinger Band breakout has been identified on the LSE:AST / CRYPTOCAP:USDT chart. The price has moved outside of the upper Bollinger Band, indicating a potential bullish trend. The next resistance key levels are located at 0.1365 | 0.1533 | 0.1808, and the major support zones can be found at 0.109 | 0.0983 | 0.0708. Consider buying at the current price zone of 0.1181 and targeting higher levels.BBand_Squeeze
◰◲ General info :
▣ Name: AirSwap
▣ Rank: 524
▣ Exchanges: Binance, Huobipro, Gateio
▣ Category/Sector: Financial - Decentralized Exchanges
▣ Overview: Airswap is a peer-to-peer, non-custodial exchange protocol and network for trading ERC20 tokens that allows traders to identify potential counterparties, negotiate directly (and privately), and execute on-chain.
◰◲ Technical Metrics :
▣ Mrkt Price: 0.1181 ₮
▣ 24HVol: 2,790,161.826 ₮
▣ 24H Chng: 4.606%
▣ 7-Days Chng: -2.60%
▣ 1-Month Chng: 18.87%
▣ 3-Months Chng: 37.73%
◲◰ Pivot Points - Levels :
◥ Resistance: 0.1365 | 0.1533 | 0.1808
◢ Support: 0.109 | 0.0983 | 0.0708
◱◳ Indicators recommendation :
▣ Oscillators: NEUTRAL
▣ Moving Averages: BUY
◰◲ Technical Indicators Summary : BUY
◲◰ Sharpe Ratios :
▣ Last 30D: 1.40
▣ Last 90D: 1.12
▣ Last 1-Y: 1.00
▣ Last 3-Y: 0.99
◲◰ Volatility :
▣ Last 30D: 2.27
▣ Last 90D: 1.74
▣ Last 1-Y: 1.79
▣ Last 3-Y: 2.03
◳◰ Market Sentiment Index :
▣ News sentiment score is N/A
▣ Twitter sentiment score is 0.58 - Bullish
▣ Reddit sentiment score is 0.25 - V. Bearish
▣ In-depth ASTUSDT technical analysis on Tradingview TA page
▣ What do you think of this analysis? Share your insights and let's discuss in the comments below. Your like, follow and support would be greatly appreciated!
◲ Disclaimer
Please note that the information and publications provided are for informational purposes only and should not be construed as financial, investment, trading, or any other type of advice or recommendation. We encourage you to conduct your own research and consult with a qualified professional before making any financial decisions. The use of the information provided is solely at your own risk.
▣ Welcome to the home of charting big: TradingView
Benefit from a ton of financial analysis features, instruments and data. Have a look around, and if you do choose to go with an upgraded plan, you'll get up to $30.
Discover it here - affiliate link -

AST BTC only, yet AST is one of the few in Binance now that are only in BTC pair.
These were pumped hard and then added multiple pairs by Binance and they sued to be only BTC:
NEBL - VIB - PHB - OAX
So what is left?
AST - PIVX
Pivx chart I posted it and still going according to the plan possible pump April. You will find it on my page: PIVX
VIB hit all my targets and pumped over 12x, next are PIVX and AST. I am patiently waiting.
Is there a danger of delisting?
According to the Binance rules, if the team is updating and working then less likely to delist.
And you can check these teams that they are working on Twitter. So the risk of delisting is very low compared to other coins that got delisted because there was no work or updates not even on their Twitter page.
So will they add USDT pair to AST and PIVX? highly possible but as we saw in others they add USDT pair during peak prices so they do a final pump and become exit liquidity to new joiners.
Good Luck!

Clean Set Up on #Airswap A macro non logarithminc look at AST before it rips.
My main driver is a line chart with a combination of 12 EMA's. This translates to any other time frame.
Below I have a precision sharp target on deviations from the RSI Moving average.
This will be an interesting one.


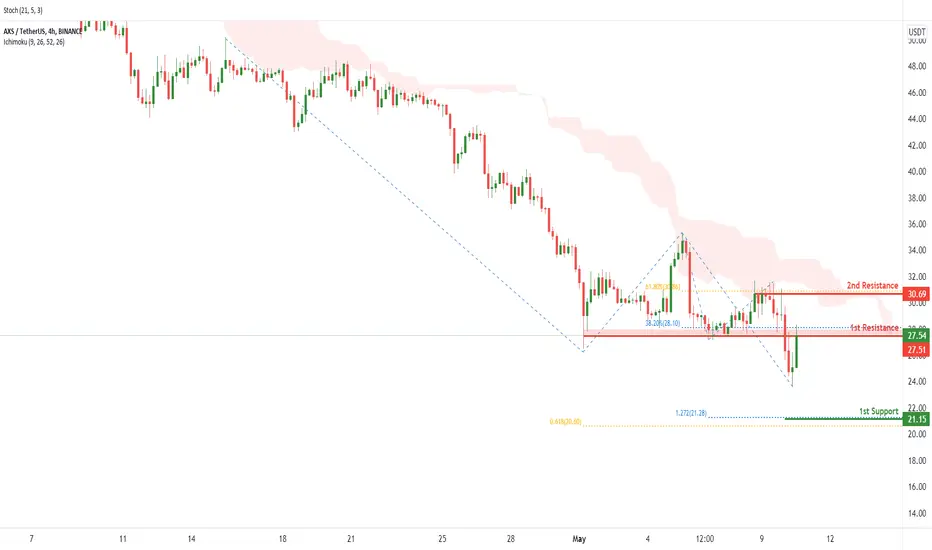
AXSUSDT potential for a drop! |10th May 2022On the H4, with price moving below the ichimoku cloud resistance, we have a bearish bias that price will drop to our 1st support at 21.15 where the127.2% Fibonacci projection and 61.8% Fibonacci projection is from our 1st resistance at 27.51 in line with the horizontal pullback resistance and 38.2% Fibonacci retracement. Alternatively, price may break 1st resistance structure and head for 2nd resistance at 30.69 where the 61.8% Fibonacci retracement and horizontal swing high resistance is.
Any opinions, news, research, analyses, prices, other information, or links to third-party sites contained on this website are provided on an "as-is" basis, as general market commentary, and do not constitute investment advice. The market commentary has not been prepared in accordance with legal requirements designed to promote the independence of investment research, and it is therefore not subject to any prohibition on dealing ahead of dissemination. Although this commentary is not produced by an independent source, FXCM takes all sufficient steps to eliminate or prevent any conflicts of interest arising out of the production and dissemination of this communication. The employees of FXCM commit to acting in the clients' best interests and represent their views without misleading, deceiving, or otherwise impairing the clients' ability to make informed investment decisions. For more information about the FXCM's internal organizational and administrative arrangements for the prevention of conflicts, please refer to the Firms' Managing Conflicts Policy. Please ensure that you read and understand our Full Disclaimer and Liability provision concerning the foregoing Information, which can be accessed on the website.
AST/BTC READY TO PUMP 200%!!Hello everyone, if you like the idea, do not forget to support with a like and follow.
Welcome to this AST/BTC TRADE setup. AST looks very promising here for the mid-term.
AST is making a bullish falling wedge pattern in the daily time frame. It already breaks out and a retest is also done.
Last time when it breaks the bullish falling channel and pumps 200% so I'm expecting it the same.
It's great to accumulate here. So buy some now and add more in dips.
Entry range:- 300-350 sats
Target1:- 440 sats
Target2:- 580 sats
Target3:- 740 sats
Target4:- 980 sats
SL:- 270 sats
If you like this idea then do support it with like and follow.
Also, share your views in the comment section.
Thank You!

AST/BTC Don't Miss This Big Opportunity AST/BTC Don't Miss This Big Opportunity
Big Opportunity AST/BTC 1W Chart
RSI Bullish Divergence
Target in Chart
HoooOdll

AST Long-term Analysis !AST broke the major trendline in weekly time frame. Now pull-back is in progress. EMA 200 is also supporting it in the daily time frame. I think it can be a good choice for mid-term to long-term hold.

$AST should be an easy 10 XRange plays are my favorite plays/ highest conviction. From current price of 0.00000970 sats its just under a 14 X to range highs. Buy, set a sell order for 0.00013564 and forget about it. It will most likely take until end of December to play out. Cheers!
Not financial advice :)

AST SUPER BULLISHHi,
I'm sharing some low cap and midcap setups in coming day. AST is one of them which I think getting ready for a blast. I see lot's momentum in it.
I'm buying this guy and expecting some firework in coming months.
be patient with these asset class. Higher low is enough for me to take an entry.
All the best!

AST potential breakout soonIf Ast breaks over resistance line we are gonna see HUGE gains against BTC pair. (conservative 300%) Support is 300-200 satish, goals are 800,1000,1300 and 1500 for starters. RSI 1D is low (almost oversold). Depends on Bitcoin movement in very near future.

AST to Swap trend! AST/BTCTMA: 50 line (Cyan), 100 line (Green), 200 line (Red).
MC ancor wave
MACD
Fib ret To the green lvl


AST / BTC (update because i was lazy with the last one)AST / BTC update because I was a bit lazy and posted the last chart a bit too hastily. Here is the proper analyzing for where we are at. I am not going to post these smaller scale analyzes much because of the error-margin. But here we have two scenarios that can play out. Hopefully this will help out some of you to pick entries.

AST/BTC updateCheck my previous larger scale chart for the big picture. This is just an update on a smaller scale. I think we completed one 5 wave structure with and extended 5th wave and we are going to correct now before continuing upwards.

AST/BTC buy opportunityHi followers,
ASTBTC looks ready for the next move up, after holding support area,
we now formed a new up trend defined by 2 higher lows since the end of June.
Expect continuation.
Don't forget to manage your risk! 👌
Good luck and trade with care 🙏
If you like my content - 👍 Like, 💬 comment, 👆 follow and 👉 share!
❗❗❗
Disclaimer: This information is not a recommendation to BUY or SELL. It is to be used for educational purposes only!

Rounded Rejection bottom on AST/BTC PairRounded double bottom with Higher lows put in for AST. Good for a 30% move to the upside if BTC cooperates

Airswap/btc (is it time for a decent bull-run finally?)Just an idea, everything is looking promising, expecting the biggest wave up.

AST/BTC { AIRSWAP } - BULLISH SETUPANALYSIS 🔎
- AST/BTC was bounded in a descending triangle pattern.
- Price brokeout above the descending triangle's inclined resistance.
- This is a bullish signal.
BUY ENTRY ⬆️
- Market entry: current market price.
- Stop limit entry: Breakout above the horizontal resistance level (@0.00000567).
- Limit entry: Retest of the descending triangle's resistance.
TARGETS 🎯
- Horizontal resistance level (@0.00001340).
- Horizontal resistance level (@0.00002748).
SETUP INVALIDATION ❌
- Breakdown below the descending triangle's horizontal support level.


AirswapAirswap is online with Metamask. Volum grow up of day in day.
So my trade aim 1200/1300 sat = 0.6$
Take profit and buybacj 0.5/0.618 fibo
