Gold could make 1948 as its peak. Buy in the dip!Hi, everyone!
Long time no see..
as i expected there's no severe recession ahead until 2026,
just a few banks and tech startup companies collapsed but not causing a crazy global economic fraud like in 2008...
this time is much more like 1999-2003 dotcom bubble, yes economic activity might be a little bit struggling, but not as insane as 1929 or 2008
I think gold could make its third top (2072) or double top (1948) before its going down to 1000s.
According to my Gann Angle and Gann Level - Fibonacci Combo, at least gold will reach 1948 in just a few days. Best advice i could give to you was BUY IN THE DIP!
Gold still pretty strong because it is still running at average of 2x1 angle or 200pips/daily bar.
Trend changes will only occur when it reaches horizontal SnR (fibo was the most accurate, so far..) and 1x1 angle or 100pips/daily bar (the yellow diagonal line)
I did a color coding on the gann angle to make a fast recognition, strong angle as light green to dark green -- mid level as yellow -- weak level as light red to dark red
Also on the fib/gann level combo, i color coded 61.8 and 38.2 with yellow as an important level that mostly cause a reversal
So, lets break it down..
17/21 March 2023 (Most Important) - I expect the first 1948 top will happen at this day before the news release
22 March 2023 (Most Important) - A 5 days down after the fed's hiking their dollar interest rates, i expect a bearish bias bottoming at 1893 or 1909 or 1917. But sometimes people getting greedy and this could inverted.
27 March 2023 (Important) - I expect Gold has reach 1948.2 level -- but since its weekly stochastic didn't crossover yet, i expect a continuation with a slight reaccumulation at around that area. But because fed rate hikes, i don't know what's gonna happen next
28 March 2023 - Some 2 days of bullish continuation
That's my current expectation for future weeks ahead, i don't give any responsibility in terms of capital loss or etc cuz i could be wrong
Trade safety, and Cheers!
H. Haidar
Astrologytrading

EUR/USD ShortWe are currently in a possible ABC pattern. We are at the end of the correction and possibly gearing up for the next impulse move down. 800+ Pips on the eurusd

BTC ASTROLOGICAL UPDATE MAY 2023Observe the key planetary sign progressions of Mars entering Virgo and Jupiter entering Taurus Heliocentric. Dates are not exact.

BTC IMPORTANT ASTROLOGICAL UPDATE NEXT 60 DAYS 2023We are heading towards a very important key pivotal confluence of bearish astrological alignments per historical cycle data heliocentric (specifically Mars influence).

BTC Planetary updatePay attention to April 4th - 7th especially for some hard aspects coming in strong marked by the 136 bars.

Nifty and Bank Nifty both Seems strongVedic Indicator Development by Najoomi Ji: Utilizing Deviation Band and Volatility of Market
Najoomi Ji, a renowned astrologer and financial analyst, has developed a powerful new trading indicator based on the principles of Vedic astrology. The indicator takes into account the deviation band and volatility of the market to generate highly accurate buy and sell signals.
The Deviation Band is a statistical tool that measures the dispersion of price from its moving average. Najoomi Ji has incorporated this concept into his indicator, which calculates the deviation band based on a specific time period and market conditions. By analyzing the deviation band, the indicator can identify whether the market is overbought or oversold, and provide signals for buying or selling.
In addition, the indicator takes into account the volatility of the market. Volatility is a measure of the degree of variation of price over time, and can be used to determine the risk associated with a particular investment. Najoomi Ji's indicator uses a proprietary algorithm to calculate the volatility of the market, and incorporates this information into its buy and sell signals.
Overall, the Vedic Indicator developed by Najoomi Ji is a powerful tool for traders looking to make informed investment decisions. By utilizing the principles of Vedic astrology, along with statistical analysis of market data, the indicator provides a comprehensive view of market conditions and generates accurate trading signals.

BTC ASTRO 30-MINUTEBTC is approaching Venus squared Earth and Mercury Squared Mars - Caution needed.

A 10 years experimental outlook for DOW JONES INDUSTRIAL AVERAGEHi, everyone.
Currently i'm learning Gann's method on annual forecasting. But, i'll tried it to make it 10 years further.
It's so hard to find his documentation on his techniques, so i may be wrong.
Everyone who see this post, live in a little bit more than 50% of major 60 years cycle like 1929 and 1869. So, the next cycle would be around 2049
But if this was correct, i can see that there is no crashes until January 2026. and you should thank me and Gann later for inventing this useful manual technique.
But if this was completely wrong or not correct at all, it's definitely my fault..cause i still know nothing...so please don't hate me.
I use a combination of machine learning algorithm named Learning Vector Quantization , this algo is supervised learning which i set the dataset from 2010 (after last crash), and EMA 21/34/90 to filter out the trend.
In combo with that, i also use a time series model based on financial astrology as how Gann's did in the past. In this case, i don't use Gann angle because it is very effortful, so there will be a 1 or 2 bars different each swing.
Using gann's angle provide more accuracy of how the price will go, but it took a lot of time.
So, because i'm predicting 10 years further i'm not gonna using it this time.
Yeah, so that's where all of my prediction comes from. Hope you explore more, so you'll realize how cyclical the market is.
Cheers, H. Haidar
PLEASE REMEMBER THAT I COULD BE WRONG, OKAY.
SO YOU DONT BLAME ME FOR YOUR TRADING DECISION

BTC Cluster Aspect Astro : February 17th - February 23rdWe can approach price astro zones as clusters, noticing that orange and red squares and conjunctions have a negative effect on markets generally while green trines and sexiles have a positive effect. When price is being manipulated - these planetary aspects are often invalidated.
The bold thick green line on February 14th provided the fuel to push the market up significantly, as it was a convergence of triple green aspects. Whenever there is a convergence, I make the lines thick/bold.

Ethereum Mercury Line ResistanceAs we can see Ethereum is facing major resistance upon the Mercury planetary speed line, and therefor having made lower highest and reversing, there is a high change that the reversal area is upon us.
If for some reason Ethereum manages to break through the Mercury resistance lines, then it will make its way to the higher planetary line eventually. As for now, the odds are for a reversal happening soon unless we see some crazy reversal price action.
We also observe the point in the rectangle upon which it touched resistance, as it happening late into the rectangle, that shows us the speed or velocity of price is weak, giving us a greater idea of what is likely to happen.
"Planetary Lines" Indicator by @NasserHumood

Ethereum 120 vibratory resonanceAll assets resonate to a number based on the earths rotation and master clock. Ethereum vibrates to the number 120 and so we can see when we add or subtract 120 from our base pivot, we arrive and key support and resistance levels.

Is BTC heavily affect by Mars? Where is the potential bottomIn 2021, BTC reach it's all time thigh range between $27401- $69198.7. Can we predict the the support and resistance based of Astrology?
To convert price to astrology angle:
- Interval = (69198.7 - 27401) / 360 = 116.1
- Price angle = 69198.7 / 116.1 = 596' => (596 - 360) = 236'
On 10/11/2021 at all time high both Mars and Mercury were on 217' and they are the closest planets to 236'. This makes both of them the candidate for the rise and fall of 2022. I decided to choose Mars for this study as Mercury is a more neutral planet.
Chart was based off 3rd and 4th Harmonics of Mars transit at major or minor swing day after season pivot. In the chart 3rd harmonics are represented by the green lines, 4th harmonics the red line. Orange lines are both 3rd and 4th harmonics
The transits are converted to price level based off the angle x interval.
So far BTC price action respect these support and resistance levels
The next few level down are:
15906
14745.3
14745.3
Question is have we reach the bottom? I think only Master Gann can answer that question.

NIFTY & BANKNIFTY INTRADAY VIEW FOR 10th Oct 2022NIFTY FUT Support - 17208/17140/17040 while Resistance - 17426/17472/17530. Nifty Fut closing price - 17328.85
BANKNIFTY FUT Support - 39060/38777/38606/38459 while Resistance- 39743/39925/40565 . BankNifty fut closing price- 39291.

GBPJPY. @168. Which? Uk/Japan which lead to “doom”? 29/Sep/22GBPJPY’s 168 or gold’s 1680? I have been studying #WD Gann trading methodology for >15 years from his early astrology trading to later GANN Square.. BUT “both” are very “subjective” even his later Work of Gann Square more “practical” than astronomy method. Back to my “origin” maybe I should study more about Chinese’s Ancient Wisdoms where I found Chinese metaphysic/ 5 elements yin/yang harmony trading are more “practical” even as simple 168 numbers “stored” “prosperous energy”...p/s..From net : It is a little known fact that W. D. Gann went to India and studied Indian Sidereal Astrology. In his notebooks we find sketches of astrological symbols on his charts; and in his memoirs, he discusses his journey to India. In fact, the famous Gann wheel was first used by tea merchants in seventeenth century India..

Astrology learning 1Venus flower and pink heart rose
There are interesting mathematical relationships between Venus, Earth and the Sun. For example, for every 5 synods of Venus, 8 Earth years and 13 Venus years pass (5 x 584 = 2,920; 8 x 365 = 2,920; 13 x 224 = 2,912 days): the first 7 numbers of the Fibonacci sequence are 1, 1 , 2, 3, 5, 8, and 13. (The total is 33, the number of the perfected initiates or Solar Christs.)
This relationship means that every 8 years Venus draws a fivefold flower pattern, or pentagram, in relation to Earth and the Sun (with each considered as the stationary center). Many argue that this agreement with the pentagram of Venus, such as the star and the rose, is purely coincidental, despite the fact that ancient astronomers literally based their study on the synods.
The five-pointed rose is a symbol of the Rosicrucians and Martin Luther, and the inverted star represents the evil pentagram. The Virgin Mary borrowed a title from Aphrodite, Stella Maris - star of the sea, referring to the planet Venus. Mary, of course, is the five-petalled rose at the heart of the cross. (See: Mary; Aphrodite Venus
The difference between the inverted pentagram and the flower of the Queen Mother is the position of Venus in the sky: the eastern star is "destined" while the western star is "fallen".
(See: Virgin Mary and Venus)

BTC Possible Bottom November 8th The date isn't meant to be precise, but rather a range of several weeks before and after when the bottom could fall. All cycles on this planet have been governed by very technical planetary data since the dawn of time.
We shouldn't assume the bottom is in until after November, but it's also risky to presume it isn't in until then. Make sure you trade safe!

Ethereum Pivot August 2022Pivot date August 20th, or perhaps just a pause on its way down. Expect crisis to happen September-November with the cycle low happening from October-November.

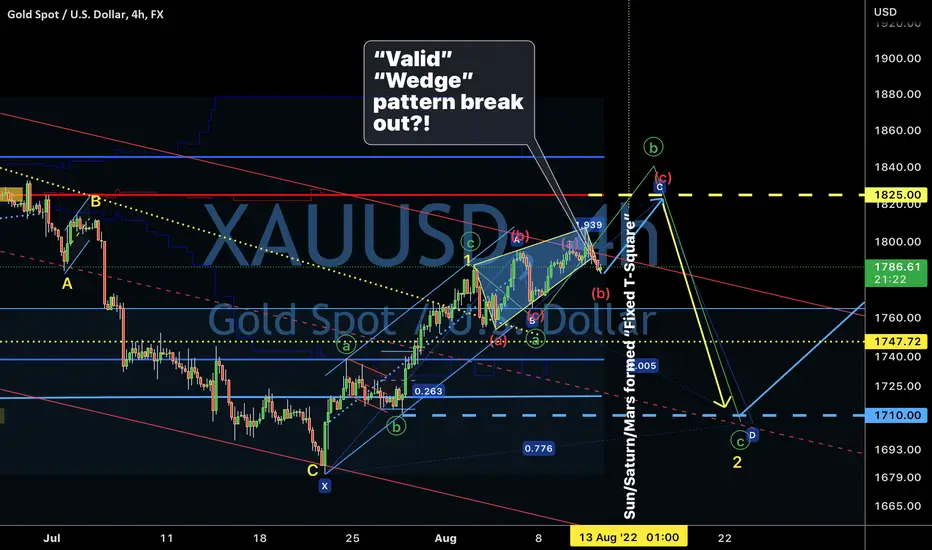
Gold. Statistically 40-60% chart pattern failed. 11/August/22Gold. It seem like we have a “breakout” on bearish “wedge” pattern on Gold Chart as shown. But.will it “failed” this t8me?..Or wait till 1825-1820 ... P/s Gold’s movement is governed by planets Jupiter/Mars/Sun..
Gold possible coming “itinerary”. 1/August/22.Gold. We just have Jupiter planet ( a major planet governed Gold’s movement beside Sun and Mars) retrograded on 28/ July /22 ..p/s the retrograding process will be end by 24/Nov/22..

BITCOIN SUN ENTERS LEOBITCOIN SUN ENTERS LEO - Get ready for a final leg down within the next few months. Low by November.

Ethereum Gann Square July 2022Ethereum is finding resistance at a key Gann level, as well as a series of malefic (red) bearish aspects approaching from the 20-25th and Moon at 0 timed pivot as well as time-squared.
so many confluences calling for a drop over the next 5 days. Not guaranteed but likely.


ETH MALEFIC (RED) PLANETARY ZONEEntering bearish MALEFIC (RED) planetary zone + hella 🐻 divergence from July 20th-25th so please plan and prepare accordingly.
📉🐻📉🐻📉🐻📉🐻📉🐻📉🐻📉🐻📉🐻📉🐻📉🐻📉🐻📉🐻📉🐻📉🐻📉🐻📉🐻📉🐻📉🐻📉🐻📉🐻📉🐻📉🐻📉🐻📉🐻📉🐻📉🐻📉🐻📉🐻📉🐻
