$AVH $1.87 Range tradeAVH looks to be moving out soonish, given were already above yesterdays volume, might provide sooner than later
Target in red
Holding from 1.835
ASX

$TPGTPG telecom LTD
Bullish Case
-Above the 2021 Yearly open. ( this is a weekly chart so need to view yearly chart to see 2021 YO)
-MACD Bull divergence
-MACD bullish crossover
-Above the bo line (Breakout line on daily)
Would like to see a pullback into the and below the breakout line to fake out all those who got long then starts the real breakout.
the FED meeting is on the 27th and anther rate hike while expected will drive another leg down in short term on Stonks imo.. watching closely.

$XLMUSDtXLM is currently trading around range low marked on the chart.
My Trigger plan for this is a breakout of the falling resistance and a relaim of the 2021 Low. This would mean a deviation of the 2021 low and would be bullish imo.
My targets are market o the chart are are essentially the Mid range and Range high.
If it dosent break out above the falling res and reclaim the 2021 low then i have no interest.
patience patience is the key here. size it right so it it fails you don't get wiped out or take heavy loss.

MPL.ASX_Bullish Breakout Trade_LongENTRY: 3.76
SL: 3.59
TP: 3.85
- ADX>25
- Daily RS +ve
- Daily FFI +ve
- Weekly RS +ve
- Weekly FFI +ve
- Moving averages are aligned.
- Breakout on 18 Aug 2022 and retraced to resistance-turned-support (3.61) before rebounding off today.
- Entry today based on breakout (from high on 11 Jan 2022) and >3% rebound off 10EMA with volume.

I am going long on GSN ... Great yearly support... Time divergence... Waiting for trendline break...
ASX:GSN

ASX BEARISHASX monthly chart with SMA 11, 13, 15. Price chart removed.
Looks like 2008 and 2020.
Sidenote Australia raised interest rates today.
Additionally, notice the double top.

$MHJ $1.55 leaning on freedomIts been a grind, but not much supply has turned up....(well so far) its decision time here
Its lil NZ sister MHJ:NZX looks the goods today imo
Buyback announced to start 19/09/22
Pretty skinny trader tho
Holding from lower

RSA RAGUSA Minerals possible break-outA great yearly support + Fibo level as support...
An eye-catching time divergence...

ASX:CXO Bull FlagWeekly Bull Flag breakout
Measured move lines up with the 100 fib ext + psychological level of $2

BTC long idea Plan and Triggerthis is also not a prediction but a plan for the long side of this trade.
BTC is currently holding the R2-H, if it gets above the and hold's that Green S/R level, breakout of falling resistance and gets above EMS on 30 min chart and 1 hour chart, That's will be the trigger for a Long to Range H, Target 1 and Target 2

$BTC short idea Plan and Trigger This is not a prediction this is a plan..
If this happens do this..
The plan here is IF BTC 1. breaks below PWO - Previous Week Open, 2.Breaks below rising Trendline, 3.Breaks below R2-H (Range 2 High(thats the trigger to go short with Targets marked on chart.
Target 1 = R1-L (Range 1 Low)
Target 2 = R2-Mid (Range 2 Mid)
Notice the inefficient and fast move up noted on the chart. these usually get filled so if we trade in to this candle range i suspect a fast down move to follow.

SPK.ASX_Bullish Retracement Trade_LongENTRY: 4.824 (average)
SL: 4.69
TP: 4.96
- ADX>25
- Daily RS +ve
- Daily FFI +ve
- Weekly RS +ve
- Weekly FFI +ve
- Moving averages are aligned.
- Breakout on 18 Aug 2022 and retraced to resistance-turned-support (3.04) before rebounding off today.
- Entry today based on breakout and >3% rebound off 10EMA with volume .

ES1!all notes on the chart.
Watch for a sharp reversal after a breakout sucking in retail traders..
If this reverses sharp say goodbye to BTC :/

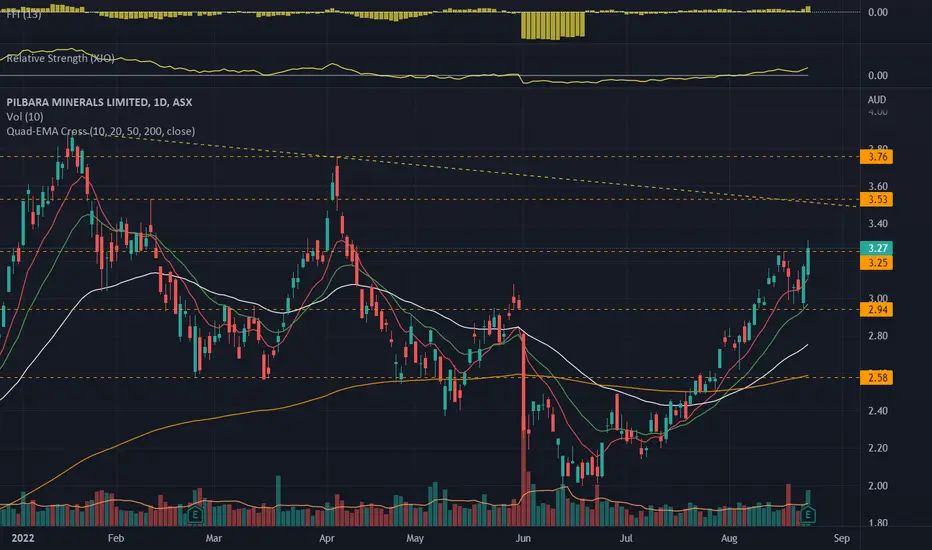
PLS.ASX_Bullish Retracement Trade_LongENTRY: 3.27
SL: 2.98
TP1: 3.53
TP2: 3.71
- ADX>25
- Daily RS +ve
- Daily FFI +ve
- Weekly RS +ve
- Weekly FFI -ve
- Moving averages are aligned.
- Breakout on 11 Aug 2022 and retraced to resistance-turned-support (3.04) before rebounding off with bullish engulfing candle yesterday.
- Entry today based on breakout and >3% rebound off 10EMA with volume .
ASX Ideas - BSL Long Idea, Elliot WaveDisclaimer: I am a new trader, practicing Elliot Wave Theory on the ASX. I aim to publish these ideas for my own journalling, as well as to accept feedback from the community in order to help me learn.
This is my analysis for BSL - Bluescope Steel Ltd. The ABC corrective wave seems to be over, so we can look forward to the 5-wave impulse move. Retracements (2) and (4) are likely to reach the 0.618 fib levels, while our target (5) is at the 0.618 fib extension of (1) to (3) and also the resistance level from previous highs.
This is a swing trade that could take between 1-3 months to play out.
Any thoughts and feedback are welcome!

$GAL $GAL.AXThis is how i would play GAL.
So much to explain could do with a video. But anyway il try explain.
Identified three ranges. R1 R2 and R3.. H=High, L=Low and Mid = Mid range.
Price rejected R2 High and is currently consolidating between R2 H and R2 Low...
Plan A looking for entry on retest of R3 H or deep to R3 Low. This level has not been retested yet. Will look for entry on 15 or 5 minute tf using the EMA cross and some sort of falling resistance break.
T1 = 1.255
T2 = 1.330
If it trades below the MID range and holds im not interested and will have to re-evaluate.

$92e Energy Limited92e currently trading below that important daily range low. Previously a move above this range low and re-claim saw the market move higher.
Bullish Scenario:
-Double Bottom
-RSI Small Bull Div
-MACD Big Bull Div
Plan:
looking for entry at @425 or below as i think it will be the backtest of this double bottom pattern that played out in the past.
If market does not give this backtest then P2an 2 will be to buy the re-claim of that important daily range low @ 485
Protection:
if market trade's below that double bottom @380 its time to jump ship and reevaluate the next plan.. A quick dip below 380 and re-claim of MAY 21 AYH level will give me a signal to enter again.
Hope this helps.

ASX buy-now-pay-later stocks enter regulatory spotlight From relative obscurity, buy-now-pay-later (BNPL) services have become instant superstars. As consumer preference shifts from credit cards to interest-free instalments, the market for BNPL providers also grows, attracting regulations that may curb their capabilities and the fast rate at which the sector is expanding.
It wasn't until 2015 that BNPL caught attention following the launch of Afterpay in Australia. At the height of the pandemic, the sector took off, with as many as 8.5 million customers shared between the three largest platforms — Afterpay, Zip (ASX: ZIP) and Humm (ASX: HUM), according to Savings.com.
Customer spending is also growing with A$11.9 billion recorded from Australian customers in the 2021-2022 financial year from A$5.6 billion three years earlier, according to ABC. Globally, spending is expected to further increase, with generous projections between US$650 billion and US$1 trillion by 2025, AJOT reported.
The players and coalitions
Currently, there are 19 BNPL providers in Australia that are catering to millions of customers. The largest in terms of market capitalization are Block (ASX: SQ2), Zip, Humm, Splitit (ASX: SPT), and Sezzle (ASX: SZL).
Block, formerly Square, entered Australia through its record $39 billion acquisition in 2021 of Afterpay. Now, the companies have a combined market capitalization of $59.36 billion, so much more than Afterpay's $100 million valuation when it listed on the Australian Securities Exchange in May 2016.
The company benefitted heavily from a niche it found during the pandemic. It saw its shares skyrocket, as did most of its peers. But as supply chain issues, inflation fears and worries about rising interest rates became more prevalent, confidence in BNPL companies dwindled and have their stock prices. From the chart below, we see that several of Australia's largest BNPL stocks all have fallen ~90% from their respective peaks.
From relative obscurity, buy-now-pay-later (BNPL) services have become instant superstars. As consumer preference shifts from credit cards to interest-free instalments, the market for BNPL providers also grows, attracting regulations that may curb their capabilities and the fast rate at which the sector is expanding.
It wasn't until 2015 that BNPL caught attention following the launch of Afterpay in Australia. At the height of the pandemic, the sector took off, with as many as 8.5 million customers shared between the three largest platforms — Afterpay, Zip (ASX: ZIP) and Humm (ASX: HUM), according to Savings.com.
Customer spending is also growing with A$11.9 billion recorded from Australian customers in the 2021-2022 financial year from A$5.6 billion three years earlier, according to ABC. Globally, spending is expected to further increase, with generous projections between US$650 billion and US$1 trillion by 2025, AJOT reported.
The players and coalitions
Currently, there are 19 BNPL providers in Australia that are catering to millions of customers. The largest in terms of market capitalization are Block (ASX: SQ2), Zip, Humm, Splitit (ASX: SPT), and Sezzle (ASX: SZL).
Block, formerly Square, entered Australia through its record $39 billion acquisition in 2021 of Afterpay. Now, the companies have a combined market capitalization of $59.36 billion, so much more than Afterpay's $100 million valuation when it listed on the Australian Securities Exchange in May 2016.
The company benefitted heavily from a niche it found during the pandemic. It saw its shares skyrocket, as did most of its peers. But as supply chain issues, inflation fears and worries about rising interest rates became more prevalent, confidence in BNPL companies dwindled and have their stock prices. From the chart below, we see that several of Australia's largest BNPL stocks all have fallen ~90% from their respective peaks.

MFG.ASX_Bullist Breakout Trade_LongENTRY: 15.38
SL: 14.38
TP1: 16.02-16.65
TP2: 17.46
- ADX>25
- Daily RS +ve
- Daily FFI +ve
- Weekly RS -ve
- Weekly FFI -ve
- Moving averages are aligned except 200EMA.
- Breakout of downtrend since 20 Dec 2021 and small consolidation zone since 29 Jul 2022 with volume.
- Possible change in trend on 20 Jul 2022
- Entry today based on breakout and >3% rebound off 10EMA with volume.
- Watch out for upcoming earnings.

COB.ASX_Breakout Trade_LongENTRY: 0.870
SL: 0.755
TP1: 0.955
TP2: 1.070
- ADX>25
- Daily RS +ve
- Daily FFI +ve
- Weekly RS +ve
- Weekly FFI -ve
- Moving averages are aligned.
- Retracing since ATH in Apr 2022.
- Consolidating between 14 Jun to 21 Jul 2022 near 200EMA before breakout from range with volume.
- Entry today based on breakout and >3% rebound off 10EMA with volume.

$LRS Latin ResourcesLRS is currently using the range high of that consolidation block weekly range marked on the chart. this range is important as this range was the last range before the market had a huge bull run march.
I have targets market on the chart, I will Cut if we get back and close below that weekly important range.
lets see.

BHP Group to explore new territory of $53 per share?This week is one of the busiest for the Australian Securities Exchange, with many of its biggest names delivering their respective earning reports. Among those reporting is the country’s largest mining company, BHP Group (ASX: BHP). BHP are expected to deliver their FY2022 results on 16 August 2022.
In addition to BHP’s results, the miner announced an AU $8.4 billion to acquire OZ Minerals (ASX: OZL) last week. As OZ Minerals have already rejected the take-over offer, additional rounds of bids will likely follow over the next week or two.
The monthly chart indicates that BHP is currently in a bullish trend and has tested a key resistance just above $48 a share twice in the past month and a half.
BHP is currently trading inside a parallel channel, and it looks like it might be about to bounce from the support, in confluence with the 50-DMA.
Fibonacci extension levels indicate that the price might reach an all-time high of $53, if bullish fundamentals continue.

PPS $0.675 leaning on the breakThis has been grinding along for long enough now....surely
This has a lot of potential if that volume keeps rolling in
Holding
