$TMZ the slaughter! The screams! The horror! The blood!Big bullflag, running down now. Getset to jetset.
Biug bullflag with multipele gradietns. RSI30 up there on the W./Hasn't tapped. But on the D it is. WIll it tap teh W FInal capitulation ?? ? WHo knows! Prob not. :Little tap [py tap to 6.6 possible though
ASX

$CHZ #chesser IH&S haven't seen this good an entry in wks. DYORCHesser
IH&S
Prob in rteh core channel of a bullflag forming the right shoulder.


ASX 200 @ 5 October 2021 5 Oct 2021 – Market Watch
The last time I did an analysis on the ASX 200 was on 27 September (red arrow). I mentioned as long as the index doesn’t experience a successful push to 7500 levels, I would likely trim positions instead of collecting new ones.
With uncertainties stemming from the twin events of the US debt ceiling and Evergrande, the ASX 200 has tested the lower boundary (7150 levels) of the support zone (highlighted in blue). Even though the index closed with a pin bar and on the upper boundary (7250 levels), I still think it’s too soon to say that this is the end of the bleed.
As I mentioned on Sunday’s FB livestream, I am expecting the next 2-3 months to be a difficult period to trade. US President Biden has voiced out his pessimism of being able to raise the debt ceiling. If that is unsuccessful, will the printing of money end? Whether you like it or not, the global equity markets have benefitted from this additional liquidity and the thoughts/fears of even turning off the tap can send markets crashing.
Evergrande finding a majority buyer for one of its subsidiaries has injected some confidence into the markets; at least for the near term. I still think more needs to be done to restructure the huge debt but I’m cautiously optimistic that the Chinese government will step in. As it is, there is already a directive to government-linked companies to do all they can to help out Evergrande. Reading between the lines, this usually means buying the distressed assets of Evergrande. To get more of my commentary on Evergrande, you can watch the livestream recording (text me for the link) starting from the 16-min mark.
I have exited almost all of my positions last week and I am only left with one stock. Will I buy more? I am evaluating 1 or 2 possible buying opportunities, but I am not anywhere close to pulling the trigger yet. I don’t subscribe to the diamond hands philosophy, especially when it comes to my trading portfolio. Thus, I prefer to be very selective in this uncertain period.
How about you? Are you collecting more stocks now? Or are you keeping your powder dry and buying in when the retracement has ended, and signs of market rebound has appeared?
If you find this market analysis helpful, let me know in the comments. May the markets continue to be with us!
Disclaimer:- I’m a mid-term trader and I hold my stocks between 1-3 months. I’m using Trend Following strategies and my analysis will be from a perspective as a Trend Follower. I’m sharing these analyses for learning purposes and as always, DYOR.

ACL.ASX_Range Breakout_LongENTRY: 4.63
SL: 4.25
TP: 5.53
- ADX>20
- RSI<50,RSI<70
- Daily RS N/A
- Daily FFI +ve
- Daily MACD +ve
- Weekly RS N/A
- Weekly FFI +ve
- Weekly MACD N/A
- Breakout of range on 26 Aug 2021 with high volume.
- Retraced with lower volume until 3 Sep 2021 showing possible buyers coming in.
- Breakout of range with high volume today. Would like for it to close above 4.63.

$NVX what TF happened?/ Well it made it's meas move guys!$NVX
a big ugly, abstract, but stiull conventional bullflag, jsut made it measured move. Now byebye

UNI @ 4 OCT 2021Text me if you have any questions/comments for me.
-----
UNI
- First time doing a written analysis on UNI
- Stock has had a good uptrend since IPO before hitting the psychological resistance (purple dotted line)
- Today’s price action looks like a successful breakout, but the lack of volume is odd
- Usually, a breakout is accompanied with strong trading volume
- R is borderline 10%
- Strategy-to-buy (DYOR) – Suggest entry around current levels if believe the breakout will continue

NVX @ 4 OCT 2021Text me if you have any questions/comments for me.
-----
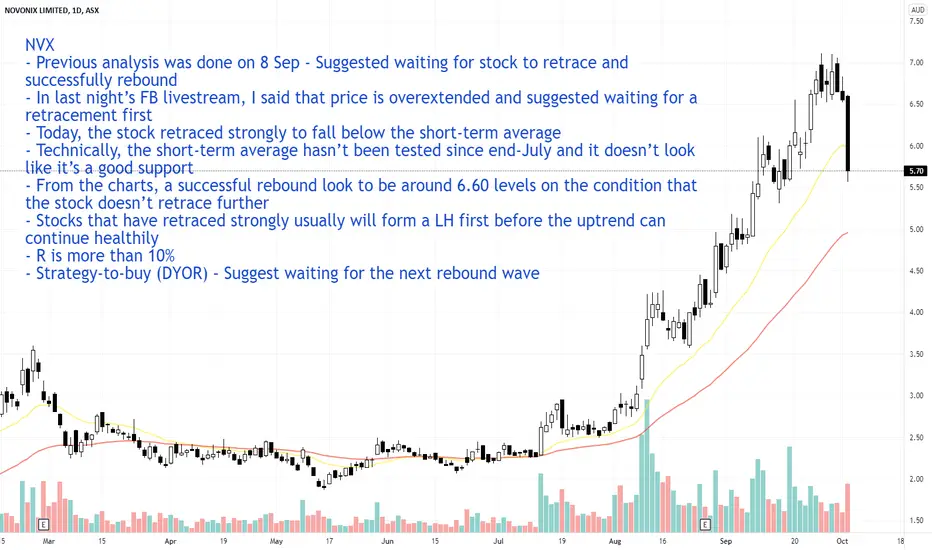
NVX
- Previous analysis was done on 8 Sep - Suggested waiting for stock to retrace and successfully rebound
- In last night’s FB livestream, I said that price is overextended and suggested waiting for a retracement first
- Today, the stock retraced strongly to fall below the short-term average
- Technically, the short-term average hasn’t been tested since end-July and it doesn’t look like it’s a good support
- From the charts, a successful rebound look to be around 6.60 levels on the condition that the stock doesn’t retrace further
- Stocks that have retraced strongly usually will form a LH first before the uptrend can continue healthily
- R is more than 10%
- Strategy-to-buy (DYOR) – Suggest waiting for the next rebound wave
LIC @ 4 Oct 2021Text me if you have any questions/comments for me.
-----
LIC
- Previous analysis was done on 21 Sep - Suggested waiting for the next rebound wave
- Since then, the stock has formed a LH, re-tested the short-term support for a mini retracement, and rebounded
- There might be some price resistance above $22 levels
- R is less than 10%
- Strategy-to-buy (DYOR) – Suggest entry above 22 levels if comfortable with the potential overhead resistances

IMU @ 4 OCT 2021Text me if you have any questions/comments for me.
-----
IMU
- First time doing a written analysis on IMU
- Stock is currently trading at previous strong resistance (created in 2007)
- A good rebound from here would form a strong support at current levels
- A successful rebound looks to be at 0.475 levels
- R is borderline 10%
- Strategy-to-buy (DYOR) – Suggest waiting for a successful rebound before plotting entry

GNC @ 4 Oct 2021Text me if you have any questions/comments for me.
-----
GNC
- First time doing a written analysis on GNC
- Stock is currently trading at a resistance that was formed during the height of last year’s pandemic crash (purple dotted line)
- Since then, the stock has had more sideways consolidation interspersed with uptrends that last for a few weeks
- Stock is bounding around the short-term support and a successful rebound from here will provide an opportunity for entry
- A successful rebound is around 6.60 levels
- R is less than 10%
- Strategy-to-buy (DYOR) – Suggest waiting for a successful rebound before plotting entry or waiting for a successful breakout of strong resistance

BST @ 4 OCT 2021Text me if you have any questions/comments for me.
-----
BST
- First time doing a written analysis on BST
- Stock re-started trading in late July
- Since then, has had a 50% increase with nice uptrends
- A nice test of the short-term average and a successful rebound will present a good entry opportunity
- Stock volume is roughly less than 100k -> Illiquid stocks could mean that the stock may have sudden strong movements
- Price action over the last 2 months shows quite healthy price volatility
- A successful rebound close to 3.45 levels would represent a successful rebound
- R is borderline 10%
- Strategy-to-buy (DYOR) – Suggest waiting for a successful rebound before plotting entry

ABB @ 4 Oct 2021Text me if you have any questions/comments for me.
-----
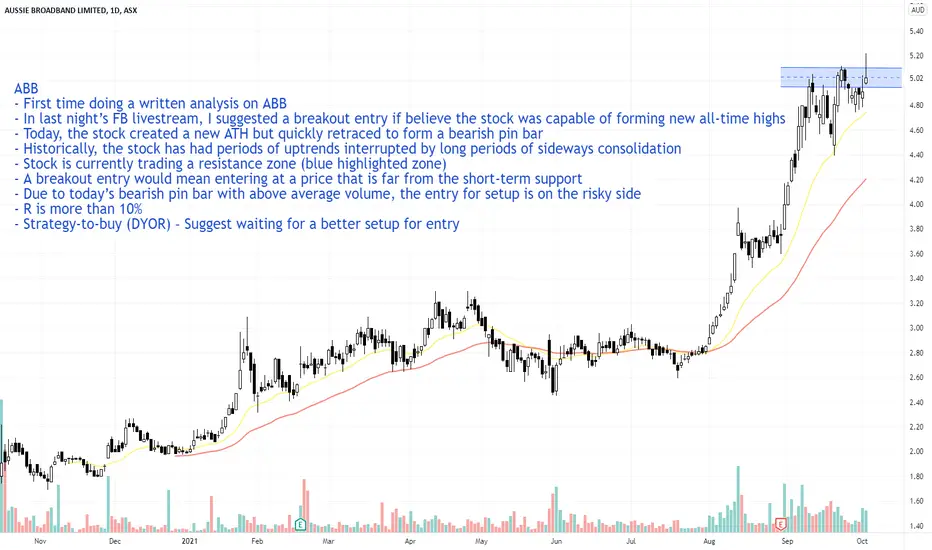
ABB
- First time doing a written analysis on ABB
- In last night’s FB livestream, I suggested a breakout entry if believe the stock was capable of forming new all-time highs
- Today, the stock created a new ATH but quickly retraced to form a bearish pin bar
- Historically, the stock has had periods of uptrends interrupted by long periods of sideways consolidation
- Stock is currently trading a resistance zone (blue highlighted zone)
- A breakout entry would mean entering at a price that is far from the short-term support
- Due to today’s bearish pin bar with above average volume, the entry for setup is on the risky side
- R is more than 10%
- Strategy-to-buy (DYOR) – Suggest waiting for a better setup for entry
$DXN timne to rise and shine?? I think so! DOM gradient nearby$DXN hs BEEN THE SH1TCOIN OF SH1TCOINS
UNPROFITABLE DATA CENTRES
BUT 1 RAY OF LIGHT - SERVICING THE MINING INDIUSTRY WITH MOBILE DATA....
NOw chart-wise, it loks like it may be ready to go... tapping the gradient. Also a nice burst of volume. Watch closely . Also like $CRO $IBX and #9SP

#S32 solved. THre you are. One last ray of bullflag then boom!S32
LONDON version
see the text book rotation of gradients in the bullflag. One left to clear and boom!

$AGI $1.24 Leaning on the breakTheyve been grinding this one along for a VERY long time now
3rd push on the Pnf60, should move out relatively soon imo.
Holding
Target in red

XJO Short (ASX200)Clear head and shoulders and in line with cycle count on SPX500. December target zone identified.

FMG x Iron ore Price x DXY to adjust for currency singsSo the Fe ore price hasn't caught up to FMG yet, with sentiment being LOW LOW LOW LOW
a big skew IH&S is what I reckon shoudl happen... let's see the next few weeks.

ANNSaid this before and I'll say it again. 30$ $ANN sounds like a steal. Zoom out and you'll see why.But let's see. Nice megaphone there, crawlingin down a MM froma bearflag.

DXYBearflag structure buty not a bearflag becuase no flagpole
comig up for 3x top? I think so.
ONLy 3x because of teh fat-finger wick from Friday
See RSI70 - outta gas on the 1h, 2h etc
BYe byre RSI
Expect a little stab north to overbuy and down she goes!
Of course I may be wrong so DYOR

GOLD - SIlver RATIOGSR here
Looks like a bullflag... but stinks like a failure.
RSI is not being charged, it's being dragged south. Not funcitoning well. Sharp stabs north defuse a bullflag.
Down the lift and up the stairs
jacks the bulls and scares the bears
So in keepign with a bullish BO on gold adn silver
TRICKY little SUCKER - hiding bullishbearish candles n a bullish structure.
RSI BANDS! the truth-tellers.

SIlverThat does not look bearish.
Yes upchannel, but steep for a bullflag, aacctually runnin asn arc with a inverse head and shoulders.
Let's see. IT may fail, but I'm not sold on it being bearish and I'll def HODL

$GOLDin USD
Looks like a queeze up to COMEX open time is possible... Let's see. As I said last night.. there are enough features here to sow doubt in me that it's a bearish chart. I think could go either way, but I'm leaning 51/49 to go up.
As @lukeytrags has been quite upset about, the goldies are capitulating today. I think that's the last scream of capitulation as theyr race to hit RI30 and lows on charts for FBOs etc before they go up. GOtta break the back of hodlers so they're too scared to re-enter, until they aren't and they chase it all of the way up.
