DSK - Could we see a pullback?DSK has rallied nicely, but the recent price action indicates that maybe price has gotten top heavy. It looks very overbought currently and may need a breather and a decent pull back, as it has printed a double top, coupled with MACD Bearish Divergence. It has also broken its trendline, which makes me believe that it may run out of steam and pull back lower. There is strong support at $3.30, which should hold and I believe if broken, we might see acceleration in price drop.
I have two buy zones (1st Buy Zone between $2.80 - $2.95) and (2nd Buy Zone between $2.50 - $2.70), where I think price may come to test as these are previous Resistance zones or congestion zones and also Fibonacci 50% and Fibonacci 61.8% zones (confluence). I would monitor price action at either of the two levels and would buy after bullish price action confirmation.
Please note these are my own notes, by no means trading advice. Please do your own research before entering into any trade.
ASX

RBL - A potential Buying OpportunityRBL has pulled back strongly in 2021 and has potentially found support at the Fibonacci 61.8% level, from where it has bounced off and currently has pulled back again towards the same level. The recent price action suggests that it is a good support level and any bullish price action may be a good sign that price may swing to the upside. I may take a long position once bullish price action is confirmed and will aim for the recent Resistance level of $4.25 as TP1 and $4.70 as TP2.
Please note these are my own notes, by no means trading advice. Please do your own research before entering into any trade.

LBY - Trade PlanLBY has shown strong bullish price action by breaking the descending wedge to the upside with very high volume indicating a potential change in the downward trend. It seems that price wants to move higher now. We may be facing initial resistance now but I will be monitoring price action closely and will buy once it shows bullish price action. There is bullish divergence on the MACD which validates the bullish view. I will be targeting the recent Resistance level which is also the 23.6 Fibonacci level which is at $0.845 ( a potential 55% gain on the trade).
Please note these are my own notes, by no means trading advice. Please do your own research before entering into any trade.

SPT - Trade PlanSPT has clearly broken out of its descending wedge with very high volume indicating that the downward trend may have changed. The current price action shows that price is pulling back and any bullish price action may get me involved. I would be a buyer after it prints bullish price action and I will be targeting the Resistance level of $0.850, a good potential reward of 45-50%.
Please note these are my own notes, by no means trading advice. Please do your own research before entering into any trade.

DSK, DUSK chart interpretationDSK share price has had an immediate rebound from the bottom support zone marked with the ascending wedge, and is likely to start a bull run towards resistance. If the market continues strong before the 27th of August when they release the 2021 financial year results, it is possible for the share price to reach $4, or even a new all time high.

Australian stocks looking pretty goodAfter more than a decade of poor performance relative to other markets, the Australian stock market has clearly broken out. At least it has broken out in AUD terms, not USD terms (not yet). It's looking pretty strong and in my opinion it could continue much higher. Definitely one market that makes me have a more bullish outlook on stocks in general.
At some point it could return to 6300, but for now I can easily see it go to 10000 over the next 12-18 months.

Property versus equities in Australian marketsThere is a lot of talk about housing prices here in Australia at the moment and the affordability for new entrants to the market.
It is always a trade off between investing in property and investing in equities or other asset classes. There are benefits to owning both property and stock.
This graph is a ratio of the market capitalization of two ETFs, one in property, and one tracking ASX 200 equities.
If the graph is going up, then that indicates that property is currently outpacing the ASX 200, and vice versa for going down.

IBX Possible future trend...ASX:IBX
Imagion Biosystems Ltd
Just wait for trendline break for taking a long...

ASX:GAP - Gale Pacific - Post 2009 turnaround? $GAP - Gale Pacific Ltd
Tracking position #ASX
Thumbs up
Breakout after 2009
Company in technical fibre
Profitable first time after 2005
Expanding in US
Growth expected
reduction in debt
Crossed fingers ~ Company guidance has been superb

OGC - Trade PlanOGC is in a confirmed uptrend as it has been make higher highs and higher lows. I believe that the current pull back is complete as it has bounced off the 200 SMA and looks like its preparing to move higher. MACD has aslo given bullish cross indicating that it is expected to move higher. I am targeting the Resistance point at $3.20 which could provide a 20% gain with a stop below the 200 SMA.
Please note these are my own notes, by no means trading advice. Please do your own research before entering into any trade.

VGL - Trade PlanVGL is looking strong after break of its downward sloping trendline and very high volume. It looks like it wants to move higher. I am aiming for a push to the upside at $2.70, its Resistance point which could provide a potential 20% gain.
Please note these are my own notes, by no means trading advice. Please do your own research before entering into any trade.

Go Long on Graincorp $GNC #gnc #asx #asx200 #ausbizI like the chart pattern here,
technical indicators such as TD Sequential, RSI, MACD are showing signs that bulls are still in control and more upside to come in the coming days/weeks.

Time to add Coles to the watchlist $COLI like the chart pattern here, and it looks like a cup and handle are forming as well.

Go Long on Seven Group Holdings $SVW #asx #asx #ausbizSimilar to Graincorp,
I like the chart pattern here,
technical indicators such as TD Sequential, RSI, MACD are showing signs that bulls are still in control and more upside to come in the coming days/weeks.


BVS - Trade PlanBVS looks strong after its break of the downtrend line with High Volume. The recent price action confirms that the bearish trend has come to an end. Currently it is pulling back and I have two Buy Zones where I will wait for bullish price action to take a long position. My 1st Buy Zone is near the 200SMA around $3.10 - $3.20 region and the second Buy Zone is between $2.80 - $2.95 region (trendline support). I will take a long position if it prints bullish price action in either of my two Buy Zones.
Please note these are my own notes, by no means trading advice. Please do your own research before entering into any trade.

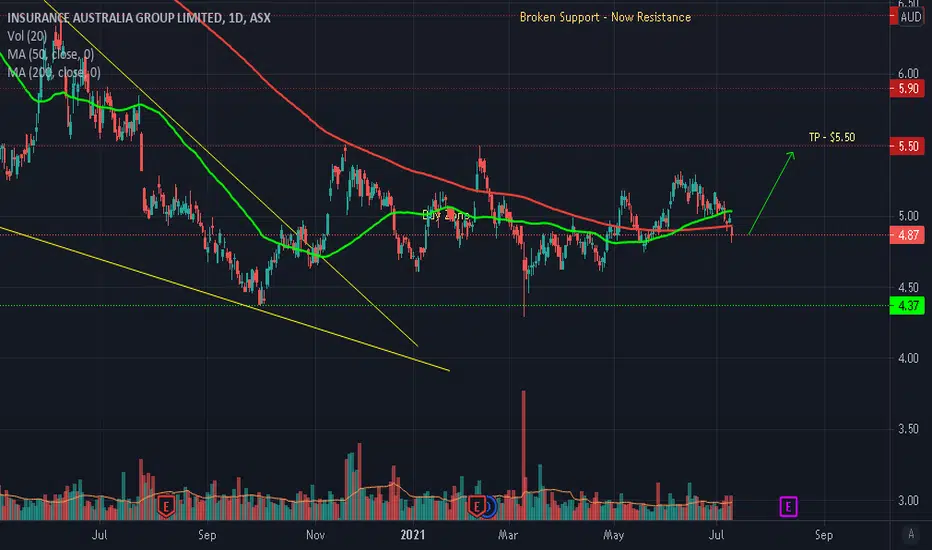
IAG - Trade PlanIAG is currently pulling back and I expect that this pull back may provide a good buying opportunity. I will take a long position once it prints bullish price action and targeting the recent highs around $5.50. My stoploss will be below the current swing low.
Please note these are my own notes, by no means trading advice. Please do your own research before entering into any trade.
ORG - Potential Buying OpportunityORG has pulled back and is showing support at the current support level. This could be a sign that this pullback may be over and it could potentially move higher. I am targeting the Resistance level of $5.30 with a tight stop below the swing low (potential 22% gain).
Please note these are my own notes, by no means trading advice. Please do your own research before entering into any trade.

BET - Bullish Trade PlanBET has pulled back lower but has shown good support at the 200 SMA so far. Currently it is consolidating but i would be a buyer if it manages to hold at the current levels and show bullish price action. My target would be $1.140 level, its first Resistance level for a potential gain of 22%.
Please note these are my own notes, by no means trading advice. Please do your own research before entering into any trade.

AMA - Trade PlanAMA is looking strong after breaking its downward sloping trendline and now backtesting it. I expect a thrust higher towards the previous highs and a continuation to the upside towards $0.645, its previous Resistane level for a potential 20% gain.
Please note these are my own notes, by no means trading advice. Please do your own research before entering into any trade.

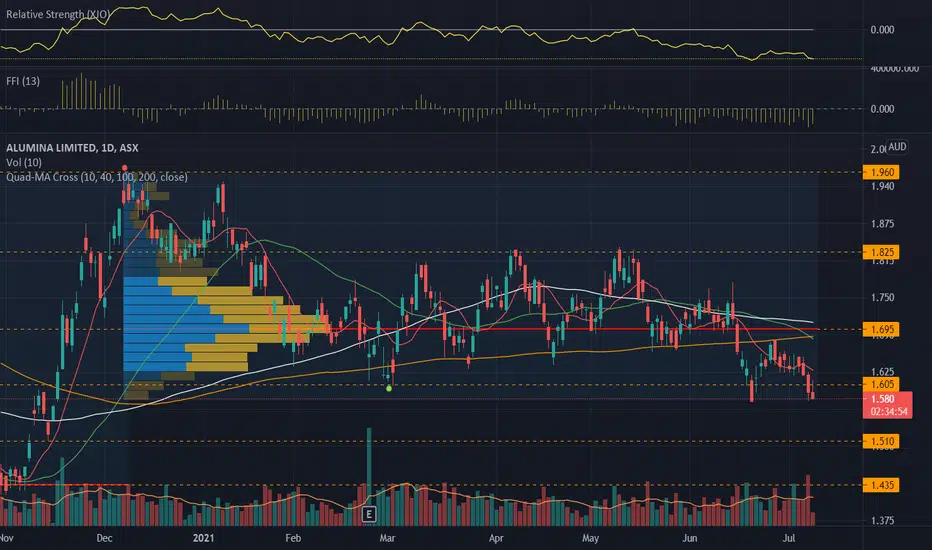
AWC.ASX_Range Breakout Trade and Retrace_ShortENTRY: 1.595
SL: 1.690
TP1: 1.510
TP2: 1.435
- ADX<20
- RSI<50,RSI>30
- Daily RS -ve
- Daily FFI -ve
- Daily MACD -ve
- Weekly RS -ve
- Weekly FFI -ve
- Weekly MACD -ve
- Broke out from triangle on 16 Jun 2021.
- Retraced and rejected trendline on 28 Jun 2021.
- Possible hidden selling on 2 Jul 2021.
- Breakout with good volume on 7 Jul 2021.
Time to add CSL to the watchlist $CSL #asx #asx200 CSL is forming an inverse head and shoulders pattern.
Technical indicators MACD and RSI are looking good for an uptrend breakout in the coming days or weeks.
