AVH - Could provide a Buying Opportunity!AVH has bounced off strongly off support and the break lower could be a false break of Support. My Buy Zone is between $4.75 and $5.00 where I may be buying the pullback once price action confirms it, with a potential target of the previous highs. Price is currently showing resistance at the 200SMA and could pullback lower to provide a new buying opportunity.
Please note these are my own notes, by no means trading advice. Please do your own research before entering into any trade.
ASX

VEA - Buy the Pullback?VEA has strongly moved to the upside, breaking the downtrend line suggesting that the downtrend may have finished. Currently price is pulling back to backtest the broken trendline which may act as a Support Zone. This may provide a very good opportunity to buy the dip around the Buy Zone of $1.850 - $1.920, with a target of the next Resistance Zone between $2.175 - $2.275. I will be buying once bullish price action confirms it with a stop below this swing.
Please note these are my own notes, by no means trading advice. Please do your own research before entering into any trade.

NVX - Buying Opportunity!!NVX has broken out of the bearish trendline with High Volume and a MACD Bullish Cross, showing conviction of the Bulls. This price action suggests it may go higher towards the next Resistance levels. My Tp1 is $2.75 with a potential gain of 16% and TP2 at 3.00 with a potential gain of 27%. My stoploss on this trade will be below this swing low at $2.00.
Please note these are my own notes, by no means trading advice. Please do your own research before entering into any trade.

ASX:CBACommonwealth Bank, one of my safer stocks to watch.
With an uptrend that felt like it would never end, we finally have a good buying opportunity on our hands.
Uptrend and downtrend are both coming to a squeeze on a support/resistance line.
Looking to buy in around the $98 support if price holds.
Otherwise letting it drop and hoping to get in at the $87 support line.
DYOR
I hope this helps someone

ASX:SUV - Primed for jumpI am yet to own any stocks in this company. I stumbled across it by chance and thought I would share what I found.
What we are looking at here is a solid uptrend, which then turned into a consolidation period.
After which, it tested its (0.210) resistance line twice. Before dropping back down to test its (0.125) support line again.
I am thinking this could be a good opportunity to buy in around (0.125) and sell at next peak (0.210).
If price falls a fair amount below (0.125) I wont be interested in the trade.
As always DYOR.
I hope this helps someone :)

ASX: VXRI have been building a line on VXR for a while now with a descent avg weighted entry using my DCA method around buying opportunities on large deviations from the mean.
We had a considerable sell off start of June which saw the beginning of bearish market structure forming on the 4h and 1d time frames.
We started to build a bear flag with an elliot wave 5 touch with in the channel and a clear break out over the last few days and price is still above the 100 ema
But we arnt out of the woods yet.....
Firstly the break in the flag wasn't really met with much conviction on the volume side, so could simply just be a low liquid volatile move whilst still in a bearish trend.
Secondly there is an EQ zone and supply block created through previous break in market structure around .72
This is the level I'm paying close attention to today, I'm not expecting a blast through but wanting to see price consolidate and move above this level reclaiming it as support to confirm the bullish trend continuation and will start in my position for now.
I have stopped buying for now until we angle that 100ema back up and continue on the mean and look for more buying ops with in an ideal deviation.
Breaking the local high at .81 should see volatility to the upside


TLX - Bullish Flag Pattern!Bullish candle in the TLX chart today has got me interested in it again. The chart has a high probability bullish flag that looks a high probability opportunity. ATR is erratic the only concern.
Entry: bullish candle break of flag with above average volume.

ASX:BET- could it be so simple?One of my favorite ASX stocks, which had an extremely bullish run at the start of this year (2021).
Once an offer was made public buy ASX:TAH(Tabcorp) on 28/05/2021, stock prices plummeted.
It appears that we have found a bottom of that massive price decent, and are starting to look bullish again (higher highs and lower lows).
Could this run be as strong as the last? I hope so!
DYOR


WES.ASX_Range Breakout Trade_LongENTRY: 15.48
SL: 54.90
TP1: 57.63
TP2: 59.30
- ADX<20
- RSI>50, RSI<70
- Daily RS -ve
- Daily FFI +ve
- Daily MACD +ve
- Weekly RS +ve
- Weekly FFI +ve
- Weekly MACD -ve
- Breakout with high volume above previous high and HVN, but prefer a better closing

Stocks to watch for March (Buy) SCG ScentreThe chart pattern is showing a "cup n handle", go long if we can breakout of this resistance $10.
More on cup n handle pattern.
www.investopedia.com

BXB - Another Buying OpportunityBXB has clearly broken its downtrend and has made a swing high. Price is expected to pull back and I am expecting it to reach towards my Buy Zone between $10.70 - $10.80, which is also trendline support. I will be looking at price action in that zone for a long opportunity and my targets will be the previous highs and above with a stoploss below the new swing low.
Please note these are my own notes, by no means trading advice. Please do your own research before entering into any trade.

CEN.ASX_Range Breakout Trade_LongENTRY: 7.61
SL: 6.95
TP1: 7.91-8.12
TP2: 8.45
- ADX>20
- RSI>50, RSI<70
- Daily RS -ve
- Daily FFI -ve
- Daily MACD +ve
- Weekly RS -ve
- Weekly FFI +ve
- Weekly MACD +ve
- Breakout with high volume but not good closing

ASX:PPK - PPK Group Limit - Innovative Battery technology stock.PPK Group (ASX:PPK)
~ Manufacture BNNT at 99% purity and in commercial quantities
~ What is BNNT ?
Boron Nitride Nanotubes or BNNT's are considered the world's strongest and most ... Faster charging, superior battery life, next generation batteries for mobile .
~ Supply BNNT to select parties as the manufacturers of products with which BNNT may be blended or infused.
~Partner with application or industry leaders to blend or infuse BNNT into their products to enhance or create new products.
Hit ATH with some good volume.
Is company fortune changing?
Company's net loss decreased.
Keep a watch 🤞
Disc: No position - educational purposes only and does not constitute financial advice or financial product advice.

CIM - Buying opportunityCIM has pulled back nicely from resistance as expected, furthermore is expected to provide another great buying opportunity. This pullback could turn around soon, ideally form my Buying Zone between $19.30 - $19.60 for an upside target of TP1 at $21.40 and TP2 at 23.70. My stoploss shall be the low below the current swing low.
Please note these are my own notes, by no means trading advice. Please do your own research before entering into any trade.

TPG - Bullish Trade PlanTPG broke out of the Bearish trendline with very High Volume. This makes me bullish TPG with an upside target of broken Support level of $6.60. Any retracement lower could be a very good buying opportunity to get long.
Please note these are my own notes, by no means trading advice. Please do your own research before entering into any trade.

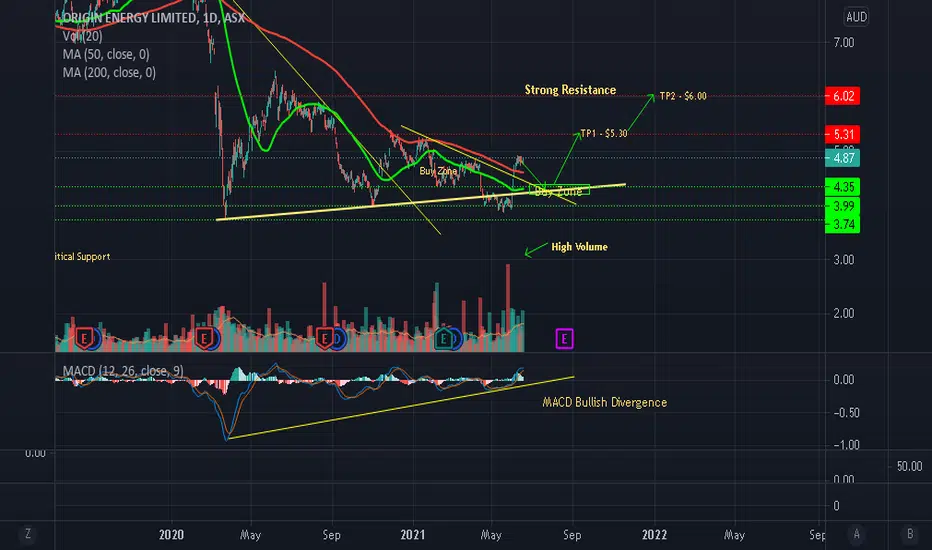
ORG - Bullish Trade PlanORG has bounced off strongly off Support with very High Volume, confirming its Bullish reversal. I expect a little correction to the downside as it looks like it is currently facing some resistance. There is also MACD Bullish Divergence on the Daily Timeframe and I expect a small correction or maybe a backtest of support near $4.20 - $4.35 zone which could give a fantastic opportunity to get long with a target towards TP1 - $5.30 and TP2 - $6.00.
Please note these are my own notes, by no means trading advice. Please do your own research before entering into any trade.
AGL - Trade PlanAGL looks like it has broken out of its long term downtrend and is expected to head higher. The break of the Bearish trendline coupled with High Volume and huge MACD Bullish Divergence confirms that it is expected to move higher. I am bullish AGL with a target of $10.70 and it may even go much higher towards the strong Resistance level of $12.00.
Please note these are my own notes, by no means trading advice. Please do your own research before entering into any trade.

Bega - a long cup & handle formation 2 1/2 years to have formed this pattern. looking to breakout to the upside, after a minor pull back to trend support.
Easy move here with 5-6% risk.
Entry if you've already missed it will be somewhat difficult, either wait for pull back or slowly sizing in or either take the confrimation of handle top.
potential 15-50% move depending on your TP targets and term length.
________
*Multiple Bull Divs
*2 1/2 Cup formation.
*Currently in handle
*Strong company growth and earnings beats.
*Recent acquisition of Lion group.
_______________
- Slow mover
- Potential fake out and heavy resistance above 6.40
- Best entry required for good R:R (as of writing its around 2.5/3.5)

IMD.ASX_Range Breakout and Retrace Trade_LongENTRY: 2.05
SL: 1.905
TP: 2.51
- ADX>20
- RSI>50, RSI<70
- Daily RS +ve
- Daily FFI +ve
- Daily MACD +ve
- Weekly RS -ve
- Weekly FFI +ve
- Weekly MACD +ve
- Breakout with high volume on 26 May 2021 and retraced with lower volume. Showing bullish candle today with high volume.

IDX.ASX_Range Breakout Trade_LongENTRY: 5.07
SL: 4.83
TP: 5.30
- ADX>20
- RSI>50, RSI>70
- Daily RS +ve
- Daily FFI +ve
- Daily MACD +ve
- Weekly RS +ve
- Weekly FFI +ve
- Weekly MACD +ve
- Breakout ATH with decent volume and out from double bottom pattern. Prefer for it to be higher.

SM1 - Possible Change in trend?SM1 had been falling real hard until recently the price action showing that the Bulls may have stepped in. The break of the down trendline coupled with High Volume may be a sign that there has been a possible change in trend. There is also Bullish Divergence in MACD which makes me a Bull. Any retracement lower may be a very good buying opportunity with an initial target of $3.80. I would be watching price and wait for it to get into my Buy Zone of $2.85 - $3.05.
Please note these are my own notes, by no means trading advice. Please do your own research before entering into any trade.
