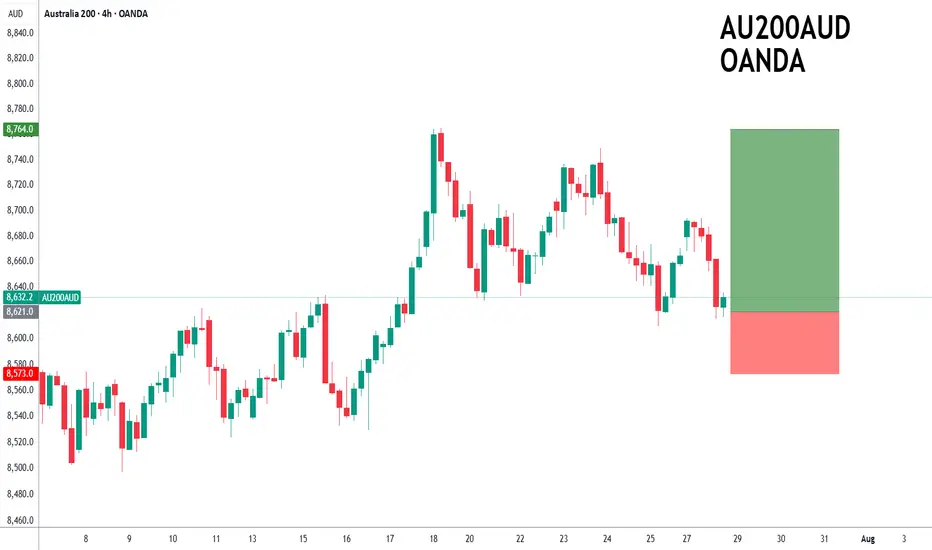
ASX200 to find support at current market price?ASX200 - 24h expiry
The primary trend remains bullish.
Price action continues to trade around the all-time highs.
20 1day EMA is at 8619.
Offers ample risk/reward to buy at the market.
Our outlook is bullish.
We look to Buy at 8621 (stop at 8573)
Our profit targets will be 8764 and 8794
Resistance: 8670 / 8694 / 8749
Support: 8610 / 8570 / 8524
Risk Disclaimer
The trade ideas beyond this page are for informational purposes only and do not constitute investment advice or a solicitation to trade. This information is provided by Signal Centre, a third-party unaffiliated with OANDA, and is intended for general circulation only. OANDA does not guarantee the accuracy of this information and assumes no responsibilities for the information provided by the third party. The information does not take into account the specific investment objectives, financial situation, or particular needs of any particular person. You should take into account your specific investment objectives, financial situation, and particular needs before making a commitment to trade, including seeking, under a separate engagement, as you deem fit.
You accept that you assume all risks in independently viewing the contents and selecting a chosen strategy.
Where the research is distributed in Singapore to a person who is not an Accredited Investor, Expert Investor or an Institutional Investor, Oanda Asia Pacific Pte Ltd (“OAP“) accepts legal responsibility for the contents of the report to such persons only to the extent required by law. Singapore customers should contact OAP at 6579 8289 for matters arising from, or in connection with, the information/research distributed.
Asx200
Bullish potential detected for WDSEntry conditions:
(i) higher share price for ASX:WDS along with swing up of the DMI indicators and swing up of the RSI indicator, and
(ii) observation of market reaction at the support/resistance level at $24.87 (from the open of 14th February).
Stop loss for the trade would be, dependent of risk tolerance (once the trade is activated):
(i) below the support level from the open of 15th July (i.e.: below $23.95), or
(ii) below the recent swing low of 30th June (i.e.: below $23.24).
NOTE: Positive momentum move on 23rd July already in play (suggested not to chase this initial move and await a retracement back towards the support/resistance level of $24.87 and observe the market reaction - potentially overbought with resistance above current price area of $26.20 as at 25th July). If the move keeps going, let it go.

Bearish potential detected for SDFEntry conditions:
(i) lower share price for ASX:SDF along with swing of DMI indicator towards bearishness and RSI downwards, and
(ii) observing market reaction around the share price of $5.89 (open of 20th June).
Stop loss for the trade would be:
(i) above the potential prior resistance of $6.08 from the open of 4th December 2024, or
(i) above the potential prior resistance of $6.19 from the open of 3rd July 2024, depending on risk tolerance.

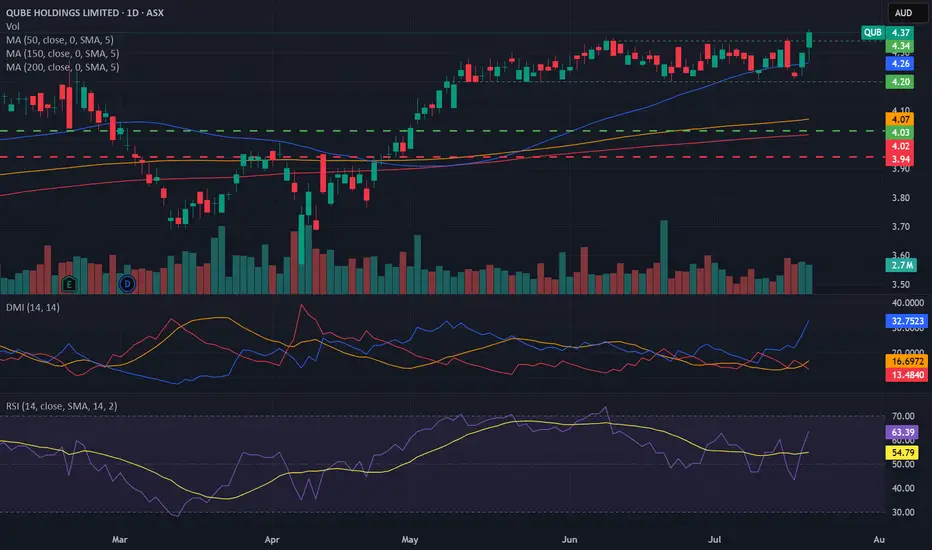
Bullish potential detected for QUBEntry conditions:
(i) higher share price for ASX:QUB along with swing up of indicators such as DMI/RSI.
Depending on risk tolerance, the stop loss for the trade would be:
(i) a close below the bottom of the formed channel (i.e.: below $4.20), or
(ii) below previous support of $4.11 from the open of 9th May, or
(iii) below the rising 150 day moving average (currently $4.07).
Bullish potential detected for BOQEntry conditions:
(i) higher share price for ASX:BOQ along with swing up of indicators such as DMI/RSI.
Depending on risk tolerance, the stop loss for the trade would be:
(i) a close below the 50 day moving average (currently $7.83), or
(ii) below previous swing low of $7.69 from the low of 23rd June, or
(iii) below previous support of $7.60 from the open of 12th May.

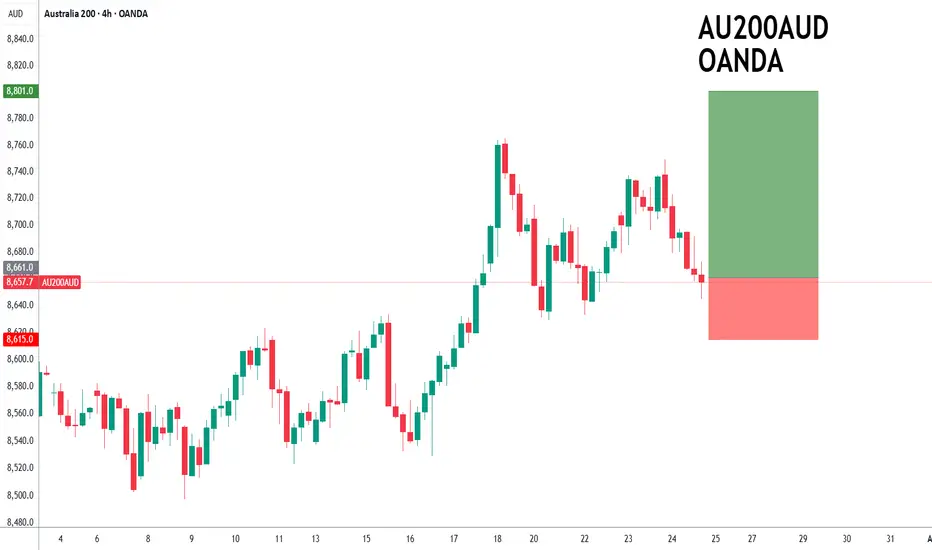
ASX200 to find buyers at current market price?ASX200 - 24h expiry
Price action resulted in a new all-time high at 8765.
Price action continues to trade around the all-time highs.
The bullish engulfing candle on the 4 hour chart the positive for sentiment.
50 4hour EMA is at 8658.
We look for a temporary move lower.
We look to Buy at 8661 (stop at 8615)
Our profit targets will be 8801 and 8831
Resistance: 8700 / 8749 / 8765
Support: 8658 / 8629 / 8600
Risk Disclaimer
The trade ideas beyond this page are for informational purposes only and do not constitute investment advice or a solicitation to trade. This information is provided by Signal Centre, a third-party unaffiliated with OANDA, and is intended for general circulation only. OANDA does not guarantee the accuracy of this information and assumes no responsibilities for the information provided by the third party. The information does not take into account the specific investment objectives, financial situation, or particular needs of any particular person. You should take into account your specific investment objectives, financial situation, and particular needs before making a commitment to trade, including seeking, under a separate engagement, as you deem fit.
You accept that you assume all risks in independently viewing the contents and selecting a chosen strategy.
Where the research is distributed in Singapore to a person who is not an Accredited Investor, Expert Investor or an Institutional Investor, Oanda Asia Pacific Pte Ltd (“OAP“) accepts legal responsibility for the contents of the report to such persons only to the extent required by law. Singapore customers should contact OAP at 6579 8289 for matters arising from, or in connection with, the information/research distributed.
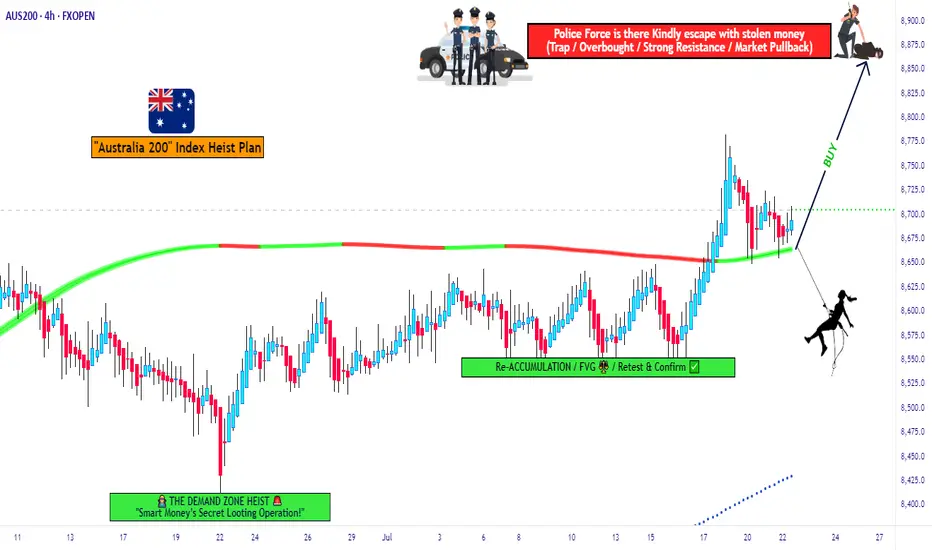
ASX200 Heist Blueprint – Entry, Exit, Escape Mapped Out!💼💣 The ASX200 Heist Blueprint: Bullish Loot Incoming! 🔥💰
🌍 Hi! Hola! Ola! Bonjour! Hallo! Marhaba! 👋
Welcome back, Money Makers & Market Robbers! 🤑💸✈️
It's time for another high-stakes heist, this time targeting the ASX200 / AUS200 “Australia 200” Index. Get your trading toolkit ready – we're planning a strategic, stealthy bullish operation based on Thief Trader’s signature blend of technical setups + macro fundamental analysis.
💹 ENTRY STRATEGY – "The Vault Is Open!"
The bullish loot is ripe for the taking. Watch for pullbacks on the 15M to 30M charts – layer in limit buy orders near recent swing lows or key levels.
🧠 Use DCA-style (Dollar Cost Averaging) layering to maximize your position like a smart thief scaling walls.
Every entry counts – but precision matters. Time your move, rob the dip, and don’t get caught by the bears. 🐂💥
🛡 STOP LOSS – "Don’t Trip the Alarm!"
Protect your capital like it’s the last stack of bills in the vault.
📉 Suggested SL: Near 4H swing low/high (e.g., 8620.0)
Always adjust based on:
Your risk tolerance
Position size
Number of open entries
Risk smart. The getaway must be clean. 🚁💨
🎯 TARGET – "8880.0 & Beyond!"
That’s the main exit point for our current job.
Expect tough resistance ahead – the police barricade zone where supply, exhaustion, and reversal pressure builds.
Book profits and treat yourself like a boss – your hustle deserves celebration! 💪🎉🍾
📊 Market Condition Overview
The ASX200 is currently in a bullish trend, supported by:
Risk-on sentiment globally 🌐
Aussie economic data strength 📈
Global indices correlation 🧩
Technical confirmations from Thief Trader tools 🔧
📌 Important Note – Stay Informed!
📢 Fundamentals Matter!
Tap into macro analysis, COT reports, geopolitical news, sentiment indicators, and intermarket flows. These are the real gears behind the charts.
📡 Always stay sharp and analyze what’s behind the candles.
⚠️ NEWS TRAP WARNING
🚨 Big news = big volatility. Don’t get caught during releases.
✔️ Avoid opening new positions around high-impact events
✔️ Use trailing SLs to protect open profits
✔️ Manage leverage like a pro thief manages their escape route
💖 Support the Thief Gang!
If this heist plan helped you, hit that Boost 💥 & Follow – it fuels our mission to help more traders rob the market cleanly and smartly.
Together we earn. Together we learn.
🧠💼 Stay tuned for more heist blueprints and tactical break-ins into global markets with the Thief Trading Style™.
🔥 Until next time, rob responsibly. 🕶💸🎯
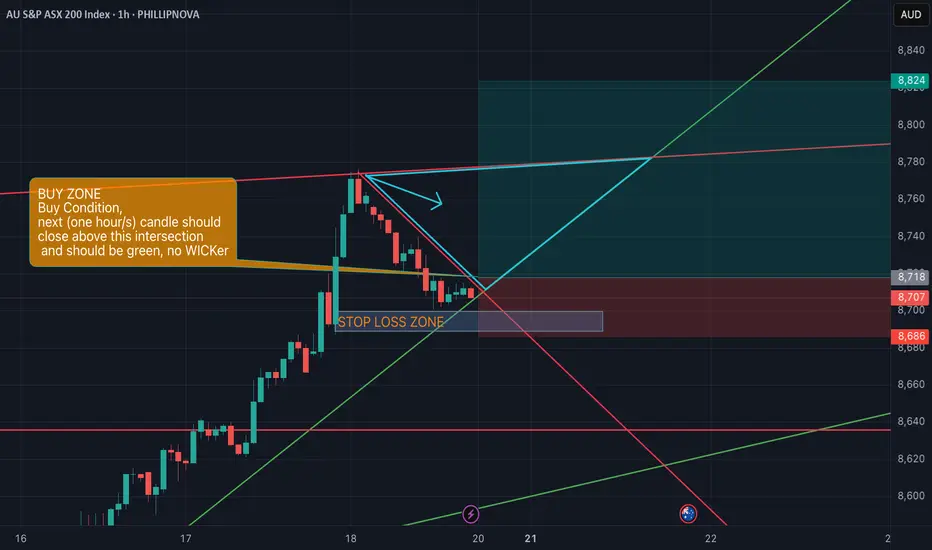
AUS200 Breakout or Fakeout? I Say Breakout – Here's Why🔍 Technical Overview:
After monitoring the recent movement in AUS200, I believe we are in the early phase of a bullish breakout continuation rather than a fakeout.
Uptrend Structure: Price has been consistently respecting higher lows and trending above the green trendline.
Break of Descending Resistance: The downtrend line has now been pierced with momentum candles — a bullish sign.
Buy Condition Set:
Next 1-hour/s candle should close above the intersection (highlighted zone).
Candle should be green, and preferably no wick on the top (indicating strength).
Volume analysis to be considered on confirmation.
✅ Trade Plan:
Buy Zone marked.
Stop Loss Zone clearly defined – I plan to exit the trade if price closes back below the shaded red/gray zone.
Upside Potential: Initial target around 8,820–8,840, with extension toward 8,900+ if momentum sustains.
Risk/Reward ratio looks favorable based on current structure.
📰 Fundamentals:
I have not yet identified any bearish macro or news catalyst that contradicts the current technical picture. If you know of any relevant developments (e.g., RBA policy, earnings, CPI releases), feel free to comment.
🔄 Validation Request:
Would love the community’s take:
Do you see this as a valid breakout?
Any hidden divergence or bearish signals I might have missed?
Let me know if you're tracking the same structure or see something different.
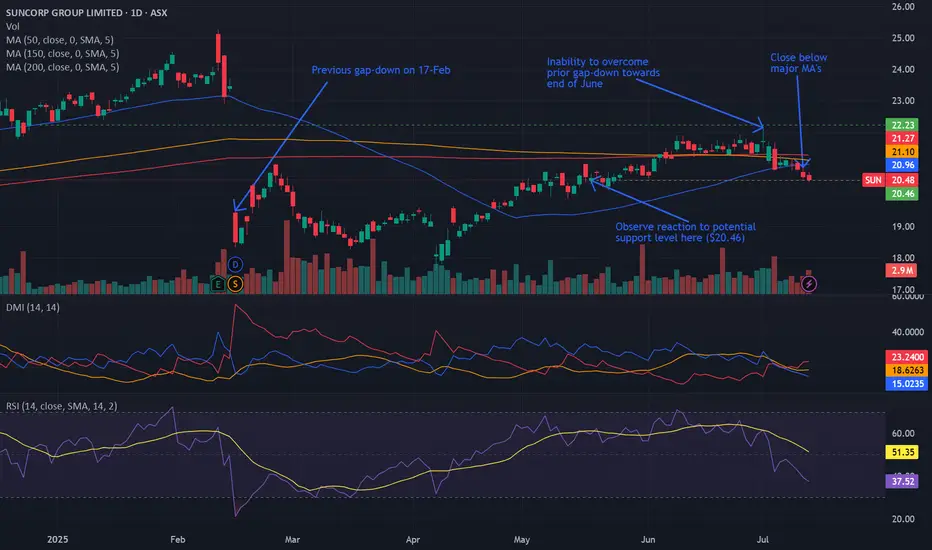
Bearish potential detected for SUNEntry conditions:
(i) lower share price for ASX:SUN along with swing of DMI indicator towards bearishness and RSI downwards, and
(ii) observing market reaction around the share price of $20.46 (open of 19th May).
Stop loss for the trade would be:
(i) above the potential prior resistance of $21.36 from the open of 5th June, or
(i) above the high of the recent swing high once the trade is activated (currently $22.14 from the high of 1st July), depending on risk tolerance.
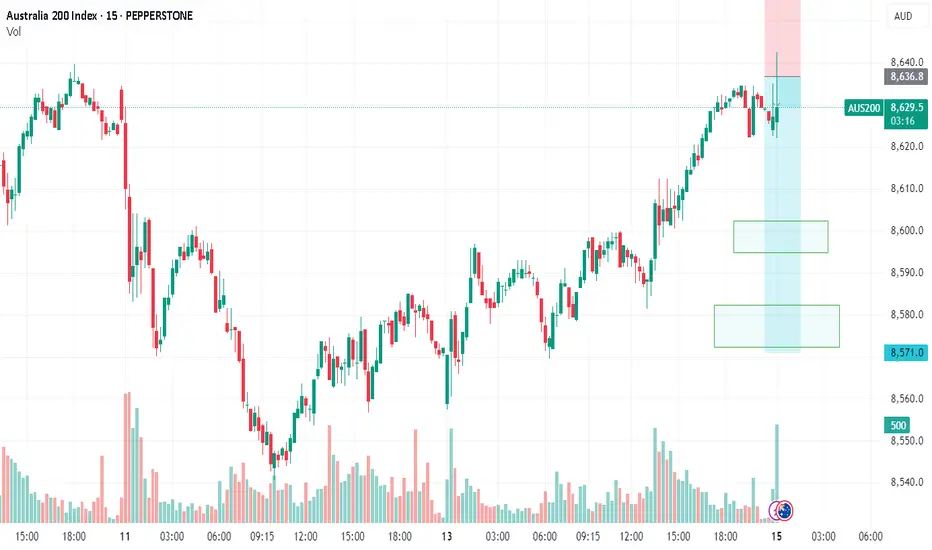
AUS200/ASX200 - OPPORTUNITY KNOCKING OUR DOORTeam, time to SHORT the hell out of AUS200 at 8632 to 8645 ranges
Taking 50-60% target at 8606-8592
ensure bring stop loss to BE once it hit our first target
then second target at 8585-8572
LET'S GO AND KILL THEM.
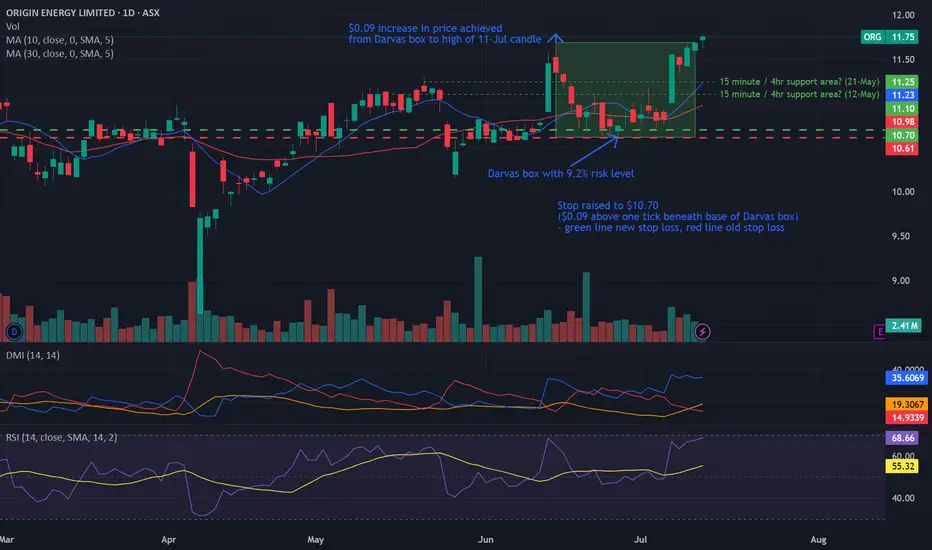
Bullish potential detected for ORGEntry conditions:
(i) breach of the upper confines of the Darvas box formation for ASX:ORG
- i.e.: above high of $11.69 of 16th June (most conservative entry), and
(ii) swing up of indicators such as DMI/RSI.
Stop loss for the trade (based upon the Darvas box formation) would be:
(i) below the support level from the low of 26th June (i.e.: below $10.62).
SHORT AUS200/ASX200 - TIME TO SHORT THE AUSSIETeam, over the last few days, we have been successfully SHORT BOTH UK100/AUS200, but I did not post the chart
Today is a good time to post.
Ensure you understand your RISK - can always discuss with us in the room
Let's SHORT UK100/FTSE100, I still expect the market to be volatile even though the US expect a rate cut. on the 9th JULY, there will be a tariff announcement, and it could also extend towards September
We are SHORTING AUS200 at 8586 toward 8616 - SLOWLY
with target at 8562-47
DOUBLE THE SHORT AT 8632-56
Target at 8608-8592

Bearish potential detected for AGLEntry conditions:
(i) breach of the lower confines of the Darvas box formation for ASX:AGL
- i.e.: below low of $9.84 of 7th April, and
(ii) swing increased bearishness of indicators such as DMI/RSI along with a test of prior level of support of $10.02 from 11th March.
Stop loss for the trade (based upon the Darvas box formation) would be:
(i) above the high of 10th April (i.e.: above $10.89), or
(ii) above the prior support level from the open of 10th January (i.e.: above $11.15), depending on risk tolerance.

ASX200 short term bias has turned negative.ASX200 - 24h expiry
Short term bias has turned negative.
A shooting star has been posted on the weekly charts.
Bearish divergence is expected to cap gains.
Previous resistance located at 8550.
50 4hour EMA is at 8528.
We look to Sell at 8529 (stop at 8581)
Our profit targets will be 8375 and 8355
Resistance: 8543 / 8574 / 8594
Support: 8476 / 8400 / 8335
Risk Disclaimer
The trade ideas beyond this page are for informational purposes only and do not constitute investment advice or a solicitation to trade. This information is provided by Signal Centre, a third-party unaffiliated with OANDA, and is intended for general circulation only. OANDA does not guarantee the accuracy of this information and assumes no responsibilities for the information provided by the third party. The information does not take into account the specific investment objectives, financial situation, or particular needs of any particular person. You should take into account your specific investment objectives, financial situation, and particular needs before making a commitment to trade, including seeking advice from an independent financial adviser regarding the suitability of the investment, under a separate engagement, as you deem fit.
You accept that you assume all risks in independently viewing the contents and selecting a chosen strategy.
Where the research is distributed in Singapore to a person who is not an Accredited Investor, Expert Investor or an Institutional Investor, Oanda Asia Pacific Pte Ltd (“OAP“) accepts legal responsibility for the contents of the report to such persons only to the extent required by law. Singapore customers should contact OAP at 6579 8289 for matters arising from, or in connection with, the information/research distributed.

ASX 200 Looks Set to BounceThe ASX 200 has drifted lower since its latest record high was set six days ago. 8500 held as support before doji formed on Tuesday to mark a false break of this key level. ASX 200 futures also tried but failed to break beneath it overnight.
Given the bullish divergence on the 1-hour RSI (14) and RSI (2), the bias is to seek dips towards 8500 for a cheeky long towards the December high.
Matt Simpson, Market Analyst at City Index and Forexc.com

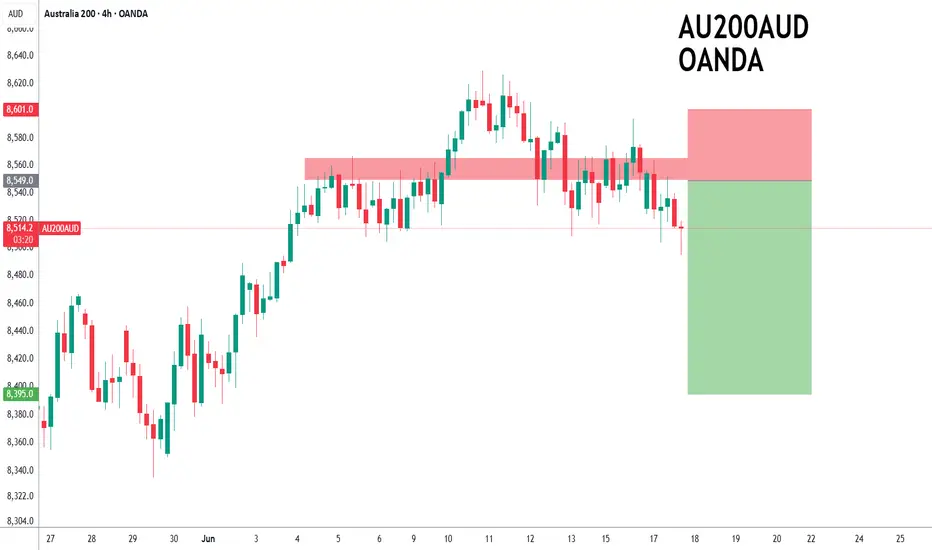
ASX200 forming a top?ASX200 - 24h expiry
Price action looks to be forming a top. A shooting star has been posted on the weekly charts.
Bearish divergence is expected to cap gains.
Previous resistance located at 8550.
Although the bulls are in control, the stalling positive momentum indicates a turnaround is possible.
We look to Sell at 8549 (stop at 8601)
Our profit targets will be 8395 and 8365
Resistance: 8552 / 8594 / 8629
Support: 8504 / 8450 / 8400
Risk Disclaimer
The trade ideas beyond this page are for informational purposes only and do not constitute investment advice or a solicitation to trade. This information is provided by Signal Centre, a third-party unaffiliated with OANDA, and is intended for general circulation only. OANDA does not guarantee the accuracy of this information and assumes no responsibilities for the information provided by the third party. The information does not take into account the specific investment objectives, financial situation, or particular needs of any particular person. You should take into account your specific investment objectives, financial situation, and particular needs before making a commitment to trade, including seeking advice from an independent financial adviser regarding the suitability of the investment, under a separate engagement, as you deem fit.
You accept that you assume all risks in independently viewing the contents and selecting a chosen strategy.
Where the research is distributed in Singapore to a person who is not an Accredited Investor, Expert Investor or an Institutional Investor, Oanda Asia Pacific Pte Ltd (“OAP“) accepts legal responsibility for the contents of the report to such persons only to the extent required by law. Singapore customers should contact OAP at 6579 8289 for matters arising from, or in connection with, the information/research distributed.
Bearish potential detected for NHCEntry conditions:
(i) lower share price for ASX:NHC along with swing of DMI indicator towards bearishness and RSI downwards, and
(ii) observing market reaction around the share price of $3.57 (open of 11th April).
Stop loss for the trade would be:
(i) above the high of the recent swing high once the trade is activated (currently $3.75 from the high of 19th May).

AUS200/ASX200 - TIME FOR A KILLTeam, another successful trading at ActiveTraderCommunity - we have hit 4/4 trades again today with target hit.
AUS200/ASX200 has been one of my favorite, but it moves like a snail. However I have all the time in the world to be patience and that what I am good at when it comes in term of trading. Be patience until the PRICE IS RIGHT
Please carefully look at two TARGET price ranges
Target 1 at 8478-8473 - please take 70% profit once it hit here and bring stop loss to BE
Target 2 at 8467-8458 - close our chapter
PLEASE NOTE: These two prices are also taking into consideration base on my statistic and probability of highly chance the target will hit.
Make sure you follow my channel for further trade. As we have not losing a trade for a very long long time. Also click on video above and you will see all my trade are accurate.

Bullish potential detected for RIOEntry conditions:
(i) higher share price for ASX:RIO along with swing up of indicators such as DMI/RSI.
Depending on risk tolerance, the stop loss for the trade would be:
(i) below the recent swing low of 14th May (i.e. $118.63), or
(ii) a close below the 200 day moving average (currently $116.88), or
(iii) a close below the 50 day moving average (currently $115.66).

ASX short term bias remains positive.ASX200 - 24h expiry
Our short term bias remains positive.
Intraday dips continue to attract buyers and there is no clear indication that this sequence for trading is coming to an end.
Buying continued from the 78.6% pullback level of 8321.
We look to buy dips.
50 4hour EMA is at 8331.
We look to Buy at 8330 (stop at 8275)
Our profit targets will be 8495 and 8545
Resistance: 8386 / 8426 / 8500
Support: 8343 / 8300 / 8249
Risk Disclaimer
The trade ideas beyond this page are for informational purposes only and do not constitute investment advice or a solicitation to trade. This information is provided by Signal Centre, a third-party unaffiliated with OANDA, and is intended for general circulation only. OANDA does not guarantee the accuracy of this information and assumes no responsibilities for the information provided by the third party. The information does not take into account the specific investment objectives, financial situation, or particular needs of any particular person. You should take into account your specific investment objectives, financial situation, and particular needs before making a commitment to trade, including seeking advice from an independent financial adviser regarding the suitability of the investment, under a separate engagement, as you deem fit.
You accept that you assume all risks in independently viewing the contents and selecting a chosen strategy.
Where the research is distributed in Singapore to a person who is not an Accredited Investor, Expert Investor or an Institutional Investor, Oanda Asia Pacific Pte Ltd (“OAP“) accepts legal responsibility for the contents of the report to such persons only to the extent required by law. Singapore customers should contact OAP at 6579 8289 for matters arising from, or in connection with, the information/research distributed.

Bullish potential detected for WOWEntry conditions:
(i) higher share price for ASX:WOW along with swing up of indicators such as DMI/RSI, and
(ii) observation of market reaction at the resistance level / volume profile area at $32.32 after closing above 200 day MA.
Stop loss for the trade would be, dependent on risk tolerance:
(i) a close below the 200 day moving average (currently $31.63), or
(ii) a close below the 50 day moving average (currently $30.17).

ASX looking ripe for the picking after C&H -Target 9,163Looks like the next international index that is ready to rally is the Australian 200.
It seems like the American presidency is having a domino effect which is resonating with down under including the following:
📉 Tariff Truce Sparks Global Optimism
A 90-day pause and significant reduction in U.S.-China tariffs have alleviated trade war fears, boosting investor confidence worldwide.
📈 Wall Street Surge Sets Positive Tone
Major U.S. indices, including the S&P 500 and Nasdaq, have rallied on trade deal hopes, providing a strong lead for the ASX.
Market Index
🛢️ Commodity Prices Climb with Trade Hopes
Anticipation of increased demand from China has driven up iron ore and oil prices, benefiting Australia's resource-heavy market.
💰 Australia Attracts Global Investors
With a stable economy and low exposure to U.S. tariffs, Australia is becoming a preferred destination for investors seeking alternatives to U.S. markets.
Reuters
And technically, we have the text book Cup and Handle showing upside to come.
Cup and Handle
Price> 20 and 200MA
Target 9,163
Disclosure: I am part of Trade Nation's Influencer program and receive a monthly fee for using their TradingView charts in my analysis.

With Dow at Resistance, it Could be Make or Break for ASX 200The Dow Jones tends to share the strongest correlation with the ASX 200, out of the three Wall Street indices. It is therefore worth noting that Dow futures formed a bearish pinbar at trend resistance on Thursday, following an intraday false break of the March low. The daily RSI (2) was also overbought by the day’s close. The March 31 low also hovers nearby for additional resistance.
Given futures volumes were declining while Dow futures rose, I suspect a pullback is due.
ASX 200 futures formed a hanging man candle beneath the January high, near a weekly VPOC (volume point of control). The 200-day SMA also hovers nearby. A bearish divergence has also formed on the daily RSI (2). And like the Dow, volumes were declining while ASX prices rose.
Bears could fade into moves around the Jan low or 2000-day SMA with an initial target at the March high, a break beneath which assumes aa deeper pullback towards the 7939 VPOC and 7900 handle.
Matt Simpson, Market Analyst at City Index and Forex.com
