IEL @ 9 NOV 2021Text me if you have any questions/comments for me.
-----
IEL
- Previous analysis was done on 19 Oct (red arrow) -> suggested waiting for a retracement and a successful rebound
- On 8 Oct (blue arrow), suggested entry at 35.75 levels -> If followed suggestion, would be getting 9% returns in roughly 3 weeks
- Stock created new all-time high before retracing to a weak test of the short-term support
- Today’s price action is technically a successful rebound
- R is less than 10%
- Strategy-to-buy (DYOR) – Suggest entry at current levels if believe the stock can create new all-time high
Asx200

LIC @ 9 NOV 2021Text me if you have any questions/comments for me.
-----
LIC
- Previous analysis was done on 27 Oct (red arrow) - Suggested waiting for a successful rebound to 23.50 levels before plotting entry
- Since then, the stock is stuck in No Man’s Land with the short-term average proving to be a resistance while the mid-term average is a strong support
- A strong break of the mid-term support would likely be a Structure Break
- A successful recovery looks to be around 22.60 levels
- R is borderline 10%
- Strategy-to-buy (DYOR) – Suggest waiting for a successful rebound before plotting entry

CVW @ 9 NOV 2021Text me if you have any questions/comments for me.
-----
CVW
- First time doing a written analysis on CVW
- Stock has some history of erratic uptrends followed by a 90% drop from the All-time High on 2018 till the Covid pandemic crash
- From March 2020 till Sep 2021, the recovery has been slow with a plenty of sideways movement
- Over the last 2.5 months, the stock is showing promising signs of an uptrend
- Last week’s strong test of the short-term average is proving that the stock is respects the strong support
- Strong resistance at $0.80 levels that has been around as far back as mid-2014
- Successful breakout looks to be at 0.815 levels
- R is above 10%
- Strategy-to-buy (DYOR) – Suggest waiting for a successful breakout before plotting entry if comfortable with a strict 10% Stop Loss

ACL @ 9 NOV 2021Text me if you have any questions/comments for me.
-----
ACL
- Previous analysis was done on 6 Oct (red arrow) - Suggested waiting for HH and HL formation before plotting entry
- Since then, the stock is forming a series of HHs and HLs
- A rebound of the short-term support would create a new Higher Low and provide a good setup for entry
- A successful rebound look to be around 4.55 levels
- R is less than 10%
- Strategy-to-buy (DYOR) – Suggest waiting for a successful rebound before plotting entry

29M @ 9 NOV 2021Text me if you have any questions/comments for me.
-----
29M
- First time doing a written analysis on 29M
- Since IPO, the stock has had a nice uptrend except during the September slump that affected the overall ASX market too
- The short-term average is starting to be a strong support
- Today’s Bearish Pin Bar with average volume can be a concern
- Technically, the rebound is considered successful
- R is borderline 10%
- Strategy-to-buy (DYOR) – Suggest entry at current levels if comfortable with potential strong retracements

Good Risk Reward - Learn it. Hi all,
Look at this chart.
I do understand that the sentiment is bearish.
But the RR is good. It is a long term consolidation.
Just think about these scenarios on your trading.
Thanks

REA - Cup and Handle PatternKey Technicals - High probability trade here with the REA chart showing a Cup & handle pattern. Looking to buy on breakout (top of cup) with above average volume or on the breakout retest as resistance becomes support.
Key Fundamentals - Governments likely make sure housing recovery keeps on keeping on.

RDY @ 4 NOV 2021Text me if you have any questions/comments for me.
-----
RDY
- Previous analysis was done on 26 Oct (red arrow) -> suggested waiting for a retracement and a successful rebound
- Since then, the stock did not have a strong retracement but instead has broken through the psychological resistance at $4 levels
- On 12 Oct (blue arrow), I also suggested entry at 3.50 levels which has seen the stock increase almost 20% since
- Price is currently too far from the short-term support
- R is more than 10%
- Strategy-to-buy (DYOR) – Suggest waiting for a retracement and successful rebound

MQG @ 4 NOV 2021Text me if you have any questions/comments for me.
-----
MQG
- Previous analysis was done on 23 Sep (red arrow) -> Suggested entry around $178 levels if believe the stock can create new all-time highs
- Since then, the stock tested the $182 resistance for 2 weeks before breaking out strongly
- The stock has also had a weak test of the short-term support and has successfully rebounded
- If you have taken the recommendation, you would in profit of around 13% after 6 weeks -> the returns strengthen the previous analysis that the stock fits investors/traders with a more conservative risk appetite
- Currently, a good setup for entry has presented itself
- R is less than 10%
- Strategy-to-buy (DYOR) – Suggest entry at current levels if believe the stock can create new all-time highs

LKE @ 4 NOV 2021Text me if you have any questions/comments for me.
-----
LKE
- Previous analysis was done on 21 Oct (red arrow) -> Suggested waiting for a retracement and a successful rebound
- Since then, the stock has strapped on rockets to comfortable close above the psychological resistance at $1 levels
- On 14 Oct (blue arrow), I suggested entry around 62 cents levels and following that recommendation would mean getting almost 77% gains
- A retracement or sideways price consolidation would be good for the mid-term health of the uptrend
- A strong pullback could still take place
- R is more than 10%
- Strategy-to-buy (DYOR) – Suggest waiting for a retracement and a successful rebound

DMP @ 4 NOV 2021Text me if you have any questions/comments for me.
-----
DMP
- Previous analysis was done on 12 Oct (red arrow) -> Suggested waiting for a series of HHs and HLs due to Structure Break
- Since then, it tested $132 levels as a support before trying to break the short- and mid-term resistances
- Today’s huge gap down to the strong support at $115 levels proves that the Structure broke in early Oct
- Trend Followers buy stocks that are in an uptrend and DMP hasn’t been up-trending for a few weeks
- Strategy-to-buy (DYOR) – Suggest waiting for a series of HHs and HLs

ARB @ 4 NOV 2021Text me if you have any questions/comments for me.
-----
ARB
- Previous analysis was done on 15 Oct (red arrow) - Suggested waiting for retracement and successful rebound before plotting entry
- Since then, the stock retraced back to the support zone at $46-48 levels and have successfully rebounded
- Today’s gap up and above average volume is a very good sign for the stock
- If you didn’t entry before this, the share price is currently quite far from the short-term support
- R is borderline 10%
- Strategy-to-buy (DYOR) – Suggest entry at current price if comfortable with potential retracement

QPM @ 2 NOV 2021Text me if you have any questions/comments for me.
-----
QPM
- Previous analysis was done on 15 Oct (red arrow) - Suggested entry at current levels if comfortable with the setup and the stock’s price volatility
- Since then, the stock created a LH and quickly fell back below the mid-term support
- Short-term average no longer offers a strong support -> not a good sign
- Today’s price action has broken through the 22.5 cents support level
- The mid-term average is now a resistance
- Immediate support looks to be around the 20-21 cents zone
- Strategy-to-buy (DYOR) – Suggest waiting for the stock to recover to around $0.27 levels

JLG @ 2 NOV 2021Text me if you have any questions/comments for me.
-----
JLG
- First time doing a written analysis on JLG
- During the 17 Oct Facebook livestream, I suggested waiting for the stock to successfully breakout
- Stock has since broken out, but the price action is not accompanied with high trading volume
- If you didn’t catch the stock before this, there isn’t any good setup for entry
- Price is far from the short-term support
- R is more than 10%
- Strategy-to-buy (DYOR) – Suggest waiting for a retracement and successful rebound

CMM @ 2 NOV 2021Text me if you have any questions/comments for me.
-----
CMM
- First time doing a written analysis on CMM
- Stock has a history of volatile uptrends
- The price volatility may not suit some investors/traders
- Stock recently rebounded off the short-term support
- R is borderline 10%
- Strategy-to-buy (DYOR) – Suggest entry at current levels if believe that stock can create new all-time highs

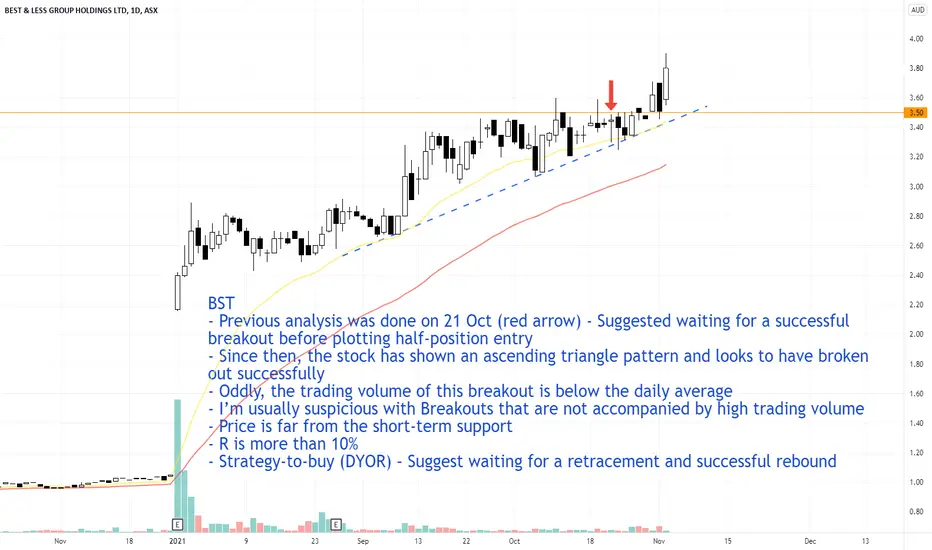
BST @ 21 OCT 2021Text me if you have any questions/comments for me.
-----
BST
- Previous analysis was done on 14 Oct (red arrow) - Suggested waiting for a successful breakout before plotting half-position entry
- Since then, the stock has shown an ascending triangle pattern and looks to have broken out successfully
- Oddly, the trading volume of this breakout is below the daily average
- I’m usually suspicious with Breakouts that are not accompanied by high trading volume
- Price is far from the short-term support
- R is more than 10%
- Strategy-to-buy (DYOR) – Suggest waiting for a retracement and successful rebound
ALL @ 2 NOV 2021Text me if you have any questions/comments for me.
-----
ALL
- First time doing a written analysis on ALL
- Stock has a nice history of uptrends
- Recent price action shows that it tends to re-test the mid-term support -> suggests weakness of the short-term support
- Stock looks to have successfully rebounded off the short-term support
- Potential psychological support at $50 levels
- R is less than 10%
- Strategy-to-buy (DYOR) – Suggest entry at current levels if believe that stock can break $50 levels

ASX 200 @ 2 NOV 20212 November 2021 – Market Watch
The last time I did an analysis on the S&P/ASX 200 was on 26 October (red arrow). I said that it was good that Blue Arrow No. 4 didn’t look likely to take place and that’s a good sign for the short-term. How wrong I was as the ASX 200 quickly retraced to fall below the (i) 7400 psychological support, (ii) short-term support, and (iii) mid-term support.
In last Sunday’s FB livestream, I was lamenting that the US indices continue to create new all-time highs but the ASX 200 tries to find every opportunity to disappoint. A head-and-shoulder chart pattern is forming and a break at the neckline (7250 levels) could spell trouble for the short- to mid-term.
With last week’s inflation numbers coming in higher than expected, investors are pricing in an early interest rate hike. Today, the Reserve Bank of Australia’s (RBA) Governor did nothing to calm investors’ nerves by not reiterating that official interest rates will not be increased until 2024.
Interest hikes are a tool to counter the rise on inflation. Inflation is usually a sign of the broader market recovering more people re-joining the workforce, increase in wages, increase in spending, etc. At the same time, interest hikes also mean that the cost of borrowings will increase and thus, temper any potential spending sprees like properties, quick business expansions, etc.
As seen in the US in late September, any talk of bond tapering can spook the markets as that is a precursor to interest rate hikes. With no confirmation that the RBA will wait till 2024 to increase rates, there is a potential that the ASX 200 will see more downwards pressure in the coming days.
The US markets recovered from their September scare to create new all-time highs. How about the ASX 200? Will it recover above 7600? Or are we looking at a re-test of the 7150-7250 support zone again?
I’m personally avoiding the big caps while being more selective with my purchases. How about you? Is this another opportunity to average down? Or are you waiting for more signs of recovery?
If you find this market analysis helpful, let me know in the comments. May the markets continue to be with us!

Asx200 to challenge ATH?After reaching a new ATH in mid-August, Asx200 started to correct and found support in 7100 zone.
At this moment we are in a correction following the first leg up since the recent low and the index can continue higher to challenge the ATH.
This scenario is negated if we have a drop under 7150

ASX: EOS - AnalysisUltimately bullish on EOS, potential double bottom imminent. Could we potentially see a break to the upside after the last 1.5 years of consolidation? Fundamentally, the company is positioned well to do well in the mid-long term.
Let me know what you think!

Z1P @ 28 OCT 2021 Text me if you have any questions/comments for me.
-----
Z1P
- First time doing a written analysis on Z1P
- During the video analysis on 30 Sep (red arrow), I suggested waiting for a successful breakout of the counter-trendline (purple dash line) before plotting entry
- Since then, the stock hasn’t broken through the resistance while continuing to test the strong support at 6.50 levels (orange line)
- Short- and mid-term averages are not in bullish sequence
- R is more than 10%
- Strategy-to-buy (DYOR) – Suggest waiting for a successful breakout before plotting entry

WTC @ 28 OCT 2021Text me if you have any questions/comments for me.
-----
WTC
- First time doing a written analysis on LRK
- Has a nice history of uptrend in the first few years since IPO
- Long sideways movement that lasted for almost a year (blue highlighted area)
- After breaking out of that sideways, the stock again facing another resistance at 54.50 levels (orange line)
- A successful breakout looks to be around 56.50 levels
- R is borderline 10%
- Strategy-to-buy (DYOR) – Suggest waiting for a successful breakout before plotting entry

LRK @ 28 OCT 2021Text me if you have any questions/comments for me.
-----
LRK
- First time doing a written analysis on LRK
- Since IPO, stock has had a long history of downtrend
- The Covid crash in March 2020 seems to have woken the stock from its slumber -> Nice uptrend
- In mid-Oct, the stock successfully broke through the $5 resistance (orange line)
- It has now retraced back to the resistance-turned-support and the short-term average
- A successful rebound from here would be good for the stock’s trend
- A successful rebound look to be above 5.35 levels if stock doesn’t retrace further
- R is borderline 10%
- Strategy-to-buy (DYOR) – If $5 support holds, suggest waiting for a successful rebound before plotting entry
