DGL @ 28 OCT 2021Text me if you have any questions/comments for me.
-----
DGL
- First time doing a written analysis on DGL
- During the FB livestream on 3 Oct, I suggested the stock is worth a look if it recovers above the $3 psychological resistance (orange line)
- Since then, the stock tested the short-term support and slowly rebounded to close at $3 today
- A successful breakout looks to be close to 3.20 levels
- R is more than 10%
- Strategy-to-buy (DYOR) – Suggest waiting for a better setup for entry
Asx200

CBA @ 28 OCT 2021Text me if you have any questions/comments for me.
-----
CBA
- First time doing a written analysis on CBA
- During the FB livestream on 24 Oct, I suggested the stock is worth a look if there is a successful breakout of the strong resistance (orange line)
- Stock has some history of uptrends but also suffers from sudden strong pullbacks
- Today’s close is above the strong resistance but was no accompanied with above average volume
- A successful breakout is above 107.50 levels
- R is less than 10%
- Strategy-to-buy (DYOR) – Suggest waiting for a successful breakout before plotting entry if believe the stock is capable of forming new all-time highs

ALQ @ 28 OCT 2021Text me if you have any questions/comments for me.
-----
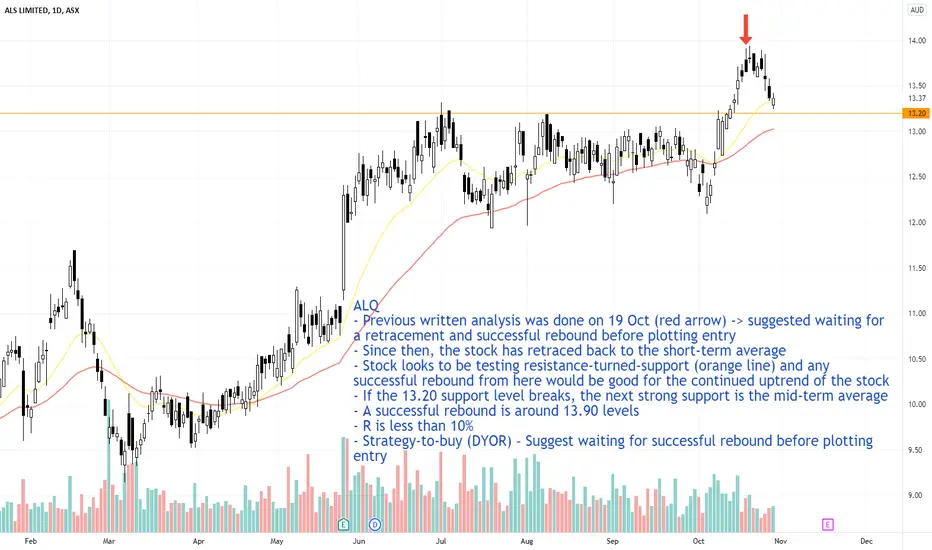
ALQ
- Previous written analysis was done on 19 Oct (red arrow) -> suggested waiting for a retracement and successful rebound before plotting entry
- Since then, the stock has retraced back to the short-term average
- Stock looks to be testing resistance-turned-support (orange line) and any successful rebound from here would be good for the continued uptrend of the stock
- If the 13.20 support level breaks, the next strong support is the mid-term average
- A successful rebound is around 13.90 levels
- R is less than 10%
- Strategy-to-buy (DYOR) – Suggest waiting for successful rebound before plotting entry
XRF @ 27 OCT 2021Text me if you have any questions/comments for me.
-----
XRF
- Previous analysis was done on 23 Sep (red arrow) -> suggested waiting for stock to retrace and rebound successfully
- Since then, the stock retraced strongly to test the mid-term support
- The subsequent rebound was not successful and formed a LH
- Stock tested the short-term support again and today closed at the 0.67 resistance levels (orange line)
- A counter-trendline (blue dash line) shows that today’s price action has closed above
- A successful breakout looks to be around 0.69 levels
- R is borderline 10%
- Strategy-to-buy (DYOR) – Suggest waiting for stock to successfully breakout before plotting entry

PLS @ 27 OCT 2021Text me if you have any questions/comments for me.
-----
PLS
- Previous analysis was done on 20 Sep (red arrow) - Suggested waiting for a series of Higher Highs and Higher Lows
- Since then, the stock dropped below the mid-term support and have had a V-shape recovery
- A retracement to test the short-term support and a successful rebound will be good for the mid-term trend of the stock
- Strong overhead resistance zone at 2.40-2.50 levels
- R is more than 10%
- Strategy-to-buy (DYOR) – Suggest waiting for a retracement and successful rebound

JHX @ 27 OCT 2021Text me if you have any questions/comments for me.
-----
JHX
- Previous analysis was done on 16 Sep (red arrow) - Suggested entry around 54.90 levels if believe the stock can create new all-time highs
- Since then, the stock did not rebound to $54.90 but instead broke through the short- and mid-term supports and tested the resistance-turned-support at $47 levels (orange line)
- Stock looks to be rebounding with most indicators showing positive signs
- Today, the stock retraced to test the short-term support
- A successful rebound look to be around 52.50 levels
- Overhead resistance zone at 54-55 levels (blue highlighted zone) -> Any entry below this strong resistance will be on the belief that the resistance can be broken
- R is less than 10%
- Strategy-to-buy (DYOR) – Suggest half entry after successful rebound if believe the stock is capable of breakout of strong resistance zone

LIC @ 27 OCT 2021Text me if you have any questions/comments for me.
-----
LIC
- Previous analysis was done on 14 Oct (red arrow) - Suggested waiting for a retracement and successful rebound
- Since then, the stock has retraced to closed at the short-term support
- A successful rebound look to be around 23.50 levels
- If the stock continues to break below the short-term support and test the mid-term support, setup for entry will no longer be good
- R is less than 10%
- Strategy-to-buy (DYOR) – Suggest waiting for a successful rebound before plotting entry

360 @ 27 OCT 2021Text me if you have any questions/comments for me.
-----
360
- Previous written analysis was done on 19 Oct (red arrow) -> suggested waiting for successful rebound breakout around 9.90 levels before plotting entry
- Stock successfully broke out yesterday and today, it gapped up to almost 5% gains from suggested entry level
- Stock created new all-time high today
- Price is now too far from short-term support
- R is more than 10%
- Strategy-to-buy (DYOR) – Suggest waiting for a retracement and successful rebound

RDY @ 26 OCT 2021Text me if you have any questions/comments for me.
-----
RDY
- Previous analysis was done on 21 Oct (red arrow) -> suggested waiting for a successful rebound around 3.80 levels before plotting entry
- If you have taken the suggestion, today’s price action would have provided gains of almost 4%
- On 12 Oct, I also suggested entry at 3.50 levels which has seen the stock increase almost 13% since
- Price is currently too far from the short-term support
- Potential psychological resistance at $4 levels
- R is more than 10%
- Strategy-to-buy (DYOR) – Suggest waiting for a retracement and successful rebound

QAN @ 26 OCT 2021Text me if you have any questions/comments for me.
-----
QAN
- Previous analysis was done on 26 Aug (red arrow) - Suggested waiting for a series of HHs and HLs to form before plotting entry
- Since then, the stock has created a series of HHs and HLs
- A support zone is forming at 5.50 levels –> a successful rebound to around 5.80 levels would strengthen the support zone
- R is less than 10%
- Strategy-to-buy (DYOR) – Suggest waiting for a successful rebound before plotting entry

NWF @ 26 OCT 2021Text me if you have any questions/comments for me.
-----
NWF
- Previous analysis was done on 15 Sep (red arrow) - Suggested waiting for a series of Higher Highs (HHs) and Higher Lows (HLs)
- Since then, the stock has gradually created 2 HHs and 1 HL
- Another retracement and successful rebound would be good for the health of the uptrend
- R is more than 10%
- Strategy-to-buy (DYOR) – Suggest waiting for a retracement and successful rebound

NVX @ 26 OCT 2021Text me if you have any questions/comments for me.
-----
NVX
- Previous analysis was done on 4 Oct - Suggested waiting for the next rebound wave
- Since then, the stock has tested the mid-term support and successfully rebounded above 6.60 levels
- Potential psychological resistance at $7 levels -> a test and retracement would form a double top formation
- Stock doesn’t respond to the short-term average
- R is more than 10%
- Strategy-to-buy (DYOR) – Suggest waiting for the next rebound wave

AMS @ 26 OCT 2021Text me if you have any questions/comments for me.
-----
AMS
- Previous analysis was done on 12 Oct (red arrow) -> suggested waiting for successful breakout of counter-trendline (blue dash line) before plotting entry especially if comfortable with overhead strong resistance (purple dotted line)
- Since then, the stock has had a failed breakout of the counter-trendline and fallen below the mid-term support
- Recent price action is not good and would constitute a structure break
- Strategy-to-buy (DYOR) – Suggest waiting for a series of HHs and HLs

ASX 200 @ 26 OCT 2021Text me if you have any questions/comments for me.
-----
The last time I did an analysis on the S&P/ASX 200 was on 12 October (red arrow). Since then, the ASX 200 has broken through four resistances: - (i) counter-trendline (purple dotted line), (ii) short-term average, (iii) mid-term average, and (iv) the 7400 psychological resistance (orange line). Within 2 weeks, the ASX 200 has recovered almost 2.3%. During the same time, the S&P 500 has rebounded by almost 5%.
In last Sunday’s FB livestream, I compared the ASX 200 and the S&P 500. I’m sure quite a lot of us have wondered why the ASX 200 retraces faster but rebounds slower than its US counterpart. This is a clear sign that the ASX 200 index is weaker. I covered more ground during the livestream, so I suggest checking that out.
However, I do want to address the issue of bond buying (ie. printing money) being “financial doping”, “unsustainable”, “bubble creation”, and “impending major crash.” Economics 101 has taught us that printing of money is bad as it would greatly depreciate the country’s currency. Comparing the USD/AUD on 1 Feb 2020 till today, the USD has depreciated by around 10% during these months of heavy printing of money. At the same time, the US stock markets’ post-Covid crash recovery have almost doubled Australia’s recovery.
Combining these two things (ie. currency depreciation and market recovery) would see a net gain for the US markets. I infer that the wider benefits to the economy (ie. global financial market stabilisation, job creation, etc) outweighs the currency depreciation factor. Personally, I would take my hats off and say that the bond buying exercise has achieved its intended objectives.
At the same time, I’m also pretty sure there will still be a shock to the market once the financial teat is pulled out of investors’ mouth. When that happens, it’s likely that the ASX will retrace faster and recover slower than the S&P 500 again.
Besides that, during the livestream, I also shared about the 4 potential directions that the ASX 200 could take over the next few weeks and what each direction would mean to the market. After 2 days of trading, it’s starting to look like Direction No. 4 (ie. Blue arrow = immediate retracement) is unlikely to take place and that’s obviously good news in the short-term. An immediate retracement would have spelt trouble as it would have heightened the importance and strengthened the resistance of the 7400 psychological zone.
The US Federal Reserve’s FOMC meeting is taking place next week and we will have more clarity as to when the Feds will start tapering their bond buying exercise. With the Dow and the S&P 500 continuing their strong recovery and creating new all-time highs every day, I am expecting a strong pullback to happen soon.
It’s important to make a distinction between feelings and facts. I have been expecting a pullback since mid-October but if I had gotten out of the market early by “predicting” certain directions, I would not have made continued gains. As a Trend Follower, if the stocks or index is still in an uptrend, I will continue to stay in the game until the uptrend breaks. Being trigger happy and selling too soon will cause a lot of heartache in trading.

LKE @ 21 OCT 2021Text me if you have any questions/comments for me.
-----
LKE
- Previous analysis was done on 14 Oct (red arrow) -> Recommended waiting for a successful rebound before plotting entry
- Since then, not only has the stock rebounded, it has also broken out above the 65 cents resistance level with above average volume
- Stock is proving that the mid-term average is a strong support
- R is more than 10%
- Strategy-to-buy (DYOR) – Suggest waiting for a retracement and a successful rebound

RDY - 21 OCT 2021Text me if you have any questions/comments for me.
-----
RDY
- Previous analysis was done on 12 Oct (red arrow) -> suggested entry at 3.50 levels is believe the stock can form a new all-time high
- Since then, the stock rose 10% to create a new all-time high before retracing to the 3.60 resistance-turned-support (orange line)
- A successful rebound would be around 3.80 levels
- Personally, I feel another test of the short-term average would be better for the health of the trend
- R is less than 10%
- Strategy-to-buy (DYOR) – Suggest waiting for a successful rebound before plotting entry

PAC @ 21 OCT 2021Text me if you have any questions/comments for me.
-----
PAC
- First time doing a written analysis on PAC
- Stock has a history of slow uptrends which seems to have picked up speed since late August 2021
- It’s currently trading at a resistance zone at 7.90-8.10 levels (orange lines) that have been tested at least 5 times in the past
- A successful breakout would be around the 8.35 levels
- Another price rejection could see the stock re-test the short-term support
- R is more than 10%
- Strategy-to-buy (DYOR) – Suggest waiting for a successful breakout and a good setup before plotting entry

LOT @ 21 OCT 2021Text me if you have any questions/comments for me.
-----
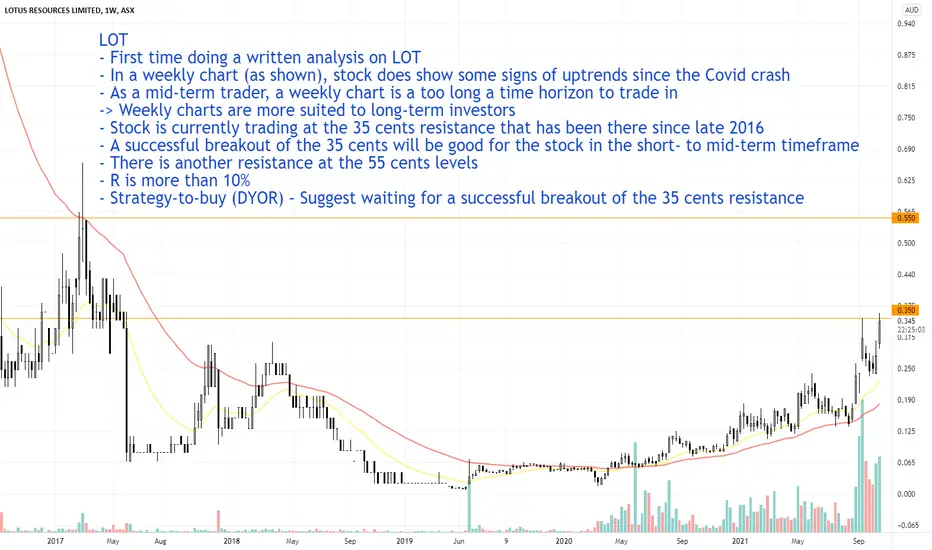
LOT
- First time doing a written analysis on LOT
- In a weekly chart (as shown), stock does show some signs of uptrends since the Covid crash
- As a mid-term trader, a weekly chart is a too long a time horizon to trade in -> Weekly charts are more suited to long-term investors
- Stock is currently trading at the 35 cents resistance that has been there since late 2016
- A successful breakout of the 35 cents will be good for the stock in the short- to mid-term timeframe
- There is another resistance at the 55 cents levels
- R is more than 10%
- Strategy-to-buy (DYOR) – Suggest waiting for a successful breakout of the 35 cents resistance
JAN @ 21 OCT 2021Text me if you have any questions/comments for me.
-----
JAN
- Previous analysis was done on 16 Sep (red arrow) -> Recommended waiting for successful breakout before plotting entry
- Since then, the stock drifted towards the mid-term support before breaking out yesterday
- The long tail above yesterday’s candle can be a concern but if the stock doesn’t fall below the $1 level (orange line), it’s too early to call it a false breakout
- R is more than 10%
- Strategy-to-buy (DYOR) – Suggest waiting for a test of the $1 support and a successful rebound

BST @ 21 OCT 2021Text me if you have any questions/comments for me.
-----
BST
- Previous analysis was done on 14 Oct - Suggested waiting for a successful rebound around 3.42 levels before plotting half-position entry
- Stock tested both the resistance (blue dash line), trendline support (purple dotted line), and the short-term moving average
- Typically, an ascending triangle points towards a strong breakout but I’ve seen my fair share of broken supports too
- With low daily average volume, a strong breakout would be very sudden and may be difficult to catch
- R is borderline 10%
- Strategy-to-buy (DYOR) – Suggest waiting for a successful breakout before plotting half-position entry

HLS @ 21 OCT 2021Text me if you have any questions/comments for me.
-----
HLS
- Previous analysis was done on 19 Sep (red arrow) -> recommended waiting for successful breakout of counter-trendline (purple dotted line) at around 4.90 levels before plotting entry if comfortable with strong overhead resistance zone
- Since then, the stock flirted with the support (blue dash line) before today gapping up and tried to breakout
- Stock briefly hit a high of 4.91 before quickly retracing below the resistance with above average volume
- Stock doesn’t have a history of long tails above the candle -> Today’s False Breakout is unusual
- If the stock can rise above today’s high (4.92 or above), it would present a better buying opportunity
- R is borderline 10%
- Strategy-to-buy (DYOR) – Suggest waiting for successful breakout of counter-trendline before plotting entry if comfortable with strong overhead resistance zone

RLT @ 19 Oct 2021Text me if you have any questions/comments for me.
-----
RLT
- First time doing a written analysis on RLT
- Stock has a history of sharp and sudden price movements that are usually reserved for penny stocks
- It’s super volatile and may not be a right fit for some investors’/traders’ risk appetite
- Uptrends are not well-established with only 1-2 waves of HHs and HLs before a strong retracement takes place -> Trend will be difficult to trade as a Trend Follower
- R is more than 10%
- Strategy-to-buy (DYOR) – Suggest waiting for a series of HHs and HLs to properly establish itself

INR @ 19 Oct 2021Text me if you have any questions/comments for me.
-----
INR
- Previous analysis was done on 16 Sep (red arrow) -> suggested waiting for a successful rebound
- Since then, the stock created a LH and LL
- Stock rebounded off the mid-term support and successfully break out from the counter-trendline (blue dotted line) with above average volume
- Stock is currently near Previous High
- Price is far from the short- or mid-term supports
- R is more than 10%
- Strategy-to-buy (DYOR) – Suggest waiting for a successful retracement and successful rebound
