NCM - Bullish Trade PlanNCM - After breaking its uptrend, it has pulled back to its Fibonacci 61.8% zone and is showing good support. I will be watching price action at the current levels to see if it shows bullish price action to get long for a target of $28.00 and above (potential gain of 10%), and a tight stop below the current swing low.
Please note these are my own notes, by no means trading advice. Please do your own research before entering into any trade.
Asx200

NST - Trade PlanNST has pulled back to it's Fibonacci 61.8% zone and is showing signs of support and bullish price action. I am bullish NST targeting the previous highs of $11.80.
Please note these are my own notes, by no means trading advice. Please do your own research before entering into any trade.

Risk Management - Tom DeMark TD 9 Still in Play ASX200 $XJO Was 7406 the top for the short term?
Was the breakout this week a bull trap?
Technical indicators such as the MACD and RSI are still with the bears.
If we close below the 21 daily moving average, time to reduce position size and risk until we can close above 7406 again.

API - Trade PlanAPI had moved up strongly breaking the bearish trendline but has pulled back lower again. It could be backtesting the breakout zone for price to move higher. I will be taking a long position if price action confirms with a stop below the low and targeting the recent highs.
Please note these are my own notes, by no means trading advice. Please do your own research before entering into any trade.

Go Long on Mining Stocks $BHPBHP breaking out to the upside soon?
The chart pattern is showing an uptrend bull flag.

ZEL - Trade PlanZEL dropped hard but bounced off strongly off its Strong Support Zone and it could be a false break. The current price action looks bullish and I am targeting the recent highs of $2.68 (potential gain 7%) with a tight stop at $2.38.
Please note these are my own notes, by no means trading advice. Please do your own research before entering into any trade.

SIQ - Trade PlanSIQ may have changed its bearish trend after the break of the downtrend line so any pullback lower may provide a buying opportunity. It could backtest lower towards my Buy Zone between $6.80 - $7.00, where I may take a long position once bullish price action is confirmed.
Please note these are my own notes, by no means trading advice. Please do your own research before entering into any trade.

SXL - Trade PlanSXL has managed to close back inside the Parallel Channel with the lower end of the channel as strong support. The recent bounce off and High Volume suggests it may move higher. I am targeting the POC of the Volume Profile at $2.35 as my TP (potential 10% gain) with a tight stop below the recent swing low.
Please note these are my own notes, by no means trading advice. Please do your own research before entering into any trade.

AVH - Could provide a Buying Opportunity!AVH has bounced off strongly off support and the break lower could be a false break of Support. My Buy Zone is between $4.75 and $5.00 where I may be buying the pullback once price action confirms it, with a potential target of the previous highs. Price is currently showing resistance at the 200SMA and could pullback lower to provide a new buying opportunity.
Please note these are my own notes, by no means trading advice. Please do your own research before entering into any trade.

VEA - Buy the Pullback?VEA has strongly moved to the upside, breaking the downtrend line suggesting that the downtrend may have finished. Currently price is pulling back to backtest the broken trendline which may act as a Support Zone. This may provide a very good opportunity to buy the dip around the Buy Zone of $1.850 - $1.920, with a target of the next Resistance Zone between $2.175 - $2.275. I will be buying once bullish price action confirms it with a stop below this swing.
Please note these are my own notes, by no means trading advice. Please do your own research before entering into any trade.

NVX - Buying Opportunity!!NVX has broken out of the bearish trendline with High Volume and a MACD Bullish Cross, showing conviction of the Bulls. This price action suggests it may go higher towards the next Resistance levels. My Tp1 is $2.75 with a potential gain of 16% and TP2 at 3.00 with a potential gain of 27%. My stoploss on this trade will be below this swing low at $2.00.
Please note these are my own notes, by no means trading advice. Please do your own research before entering into any trade.

Still bearish on ASXXJO looking to tumble soon. Lagging diagonal in white is complete, married with decreasing momentum on RSI, tells me we are due for one. It is unclear for how long roughly though. Lagging diagonals usually herald an intense drop and a complex correction. We shall see, as we live in unprecedented times financially. Goals in purple.
None of the above is financial advice, please do your own research - your trades are your trades.

Stocks to watch for March (Buy) SCG ScentreThe chart pattern is showing a "cup n handle", go long if we can breakout of this resistance $10.
More on cup n handle pattern.
www.investopedia.com

BXB - Another Buying OpportunityBXB has clearly broken its downtrend and has made a swing high. Price is expected to pull back and I am expecting it to reach towards my Buy Zone between $10.70 - $10.80, which is also trendline support. I will be looking at price action in that zone for a long opportunity and my targets will be the previous highs and above with a stoploss below the new swing low.
Please note these are my own notes, by no means trading advice. Please do your own research before entering into any trade.

CIM - Buying opportunityCIM has pulled back nicely from resistance as expected, furthermore is expected to provide another great buying opportunity. This pullback could turn around soon, ideally form my Buying Zone between $19.30 - $19.60 for an upside target of TP1 at $21.40 and TP2 at 23.70. My stoploss shall be the low below the current swing low.
Please note these are my own notes, by no means trading advice. Please do your own research before entering into any trade.

TPG - Bullish Trade PlanTPG broke out of the Bearish trendline with very High Volume. This makes me bullish TPG with an upside target of broken Support level of $6.60. Any retracement lower could be a very good buying opportunity to get long.
Please note these are my own notes, by no means trading advice. Please do your own research before entering into any trade.

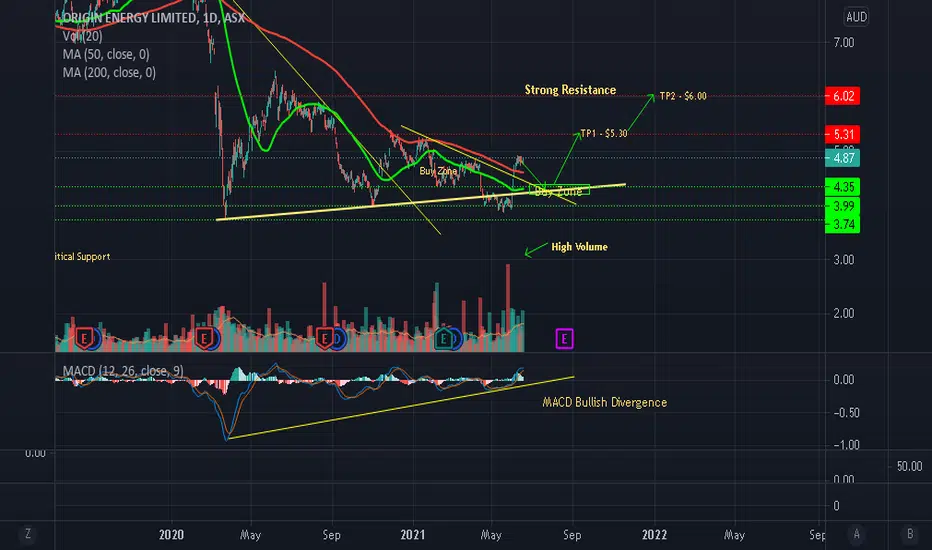
ORG - Bullish Trade PlanORG has bounced off strongly off Support with very High Volume, confirming its Bullish reversal. I expect a little correction to the downside as it looks like it is currently facing some resistance. There is also MACD Bullish Divergence on the Daily Timeframe and I expect a small correction or maybe a backtest of support near $4.20 - $4.35 zone which could give a fantastic opportunity to get long with a target towards TP1 - $5.30 and TP2 - $6.00.
Please note these are my own notes, by no means trading advice. Please do your own research before entering into any trade.
AGL - Trade PlanAGL looks like it has broken out of its long term downtrend and is expected to head higher. The break of the Bearish trendline coupled with High Volume and huge MACD Bullish Divergence confirms that it is expected to move higher. I am bullish AGL with a target of $10.70 and it may even go much higher towards the strong Resistance level of $12.00.
Please note these are my own notes, by no means trading advice. Please do your own research before entering into any trade.

SM1 - Possible Change in trend?SM1 had been falling real hard until recently the price action showing that the Bulls may have stepped in. The break of the down trendline coupled with High Volume may be a sign that there has been a possible change in trend. There is also Bullish Divergence in MACD which makes me a Bull. Any retracement lower may be a very good buying opportunity with an initial target of $3.80. I would be watching price and wait for it to get into my Buy Zone of $2.85 - $3.05.
Please note these are my own notes, by no means trading advice. Please do your own research before entering into any trade.

A2M - Has the Bearish trend changed finally?A2M had been falling in a strong downtrend until recently when it managed to break its downtrend line with very high volume. This price action suggests that the Bulls may have stepped in finally and want to take price higher. It could consolidate for a while before taking off. I am bullish A2M and targeting the recent Resistance level of $7.80 which could provide a potential 30% gain on the trade.
Please note these are my own notes, by no means trading advice. Please do your own research before entering into any trade.


Bapcor - Ascending Triangle 20% UPSIDETechnically Bap looks to have 20% upside. Plus solid fundamentals to add to the story.
Key Technicals - looking to buy on breakout of ascending triangle with above average volume. Or throw back of breakout.
Key Fundamentals - Growth internationally (TYE SOON aquisition) + New & used car demand remains strong, we are moving around differently than pre covid.
Note: Commbanks household spending intentions series suggests the wealth effect from rising dwellings should be bulllish for motor vehicles moving forward.
With that in mind, i'm watching closely, particularly, the BAP investor day that was postponned from june to July.
We may see a BAP upgrade at some point much like BKW who had/has a very similar chart and is benefiting from the same sort of economic tail winds.
www.commbank.com.au

MEZ - Looks Bullish?MEZ has been consolidating for quite sometime now and has unable to break support. The price action suggests that it could hit the Resistance level of $5.50 (a potential 8% move) on the upside. My Stoploss will be $4.50, below the previous swing low.
Please note these are my own notes, by no means trading advice. Please do your own research before entering into any trade.
