CGF - Another Buying OpportunityBullish Confirmation Indications
Recent price action has confirmed a reversal by pumping upwards and forming a higher high.
1. Price has formed a higher high
2. It has formed a Golden Cross
3. Recent session's price action, ( Bearish Candle) indicates that the stock price is facing a hard time continuing up
4. The price is at 50% Fib Retracement level of $6.60 and which is also a Resistance Zone
5. MACD is suggesting that Bullish Momentum is exhausting
6. I will be confident to buy in the $5.10 - $6.10 region (Buy Zone).
Please note these are my own notes, by no means trading advice. Please do your own research before entering into any trade.
Asx200

S32 - Next Pullback may give a Buying OpportunityBullish Confirmation Indications
Recent price action has confirmed a reversal by pumping upwards and forming a higher high.
1. Price has formed a higher high
2. It has formed a Golden Cross
3. Recent consolidation at Resistance indicates that the stock price is facing a hard time continuing up
4. The price is at 78.6% Fib Retracement level of $2.45 and @2.60 range, which is also a Resistance Zone
5. OBV suggesting Bullish Volume may be fading
6. I will be confident to buy in the $2.20 - $2.35 region (Buy Zone).
Please note these are my own notes, by no means trading advice. Please do your own research before entering into any trade.

SCP - Good Buying OpportunityBullish Confirmation Indications
Recent price action has confirmed a reversal by pumping upwards and forming a higher high.
1. Price has formed a higher high
2. It has formed a Golden Cross
3. After forming a Higher High, price failed to continue upwards and is now pulling back
4. This pull back has come down and has entered in the Buy Zone and Fib retracement zone of 50% - 78.6% of $2.20 - 2.35
5. There is also a trendline support and price may bounce at the lower end of the channel support of $2.20
6. There is a High Volume Profile Zone at $2.20 (another confluence)
7. I will be confident to buy in the $2.20 - $2.35 region (Buy Zone).
Please note these are my own notes, by no means trading advice. Please do your own research before entering into any trade.

EML - May provide a Buying Opportunity SoonBullish Confirmation Indications
Recent price action has confirmed a reversal by forming a higher highs.
1. Price has formed higher highs
2. It has formed a Golden Cross
3. After forming a Higher High, price failed to continue upwards and is now pulling back
4. This pull back has come down and has entered in the Buy Zone and Fib retracement zone of( 50% - 61.86%) of $3.40 - 3.70
5. There is also a trendline support (confluence) which may also be a bouncing spot at $3.50
6. I will be confident to buy in the $3.40 - $3.70 region (Buy Zone).
Please note these are my own notes, by no means trading advice. Please do your own research before entering into any trade.

APT - Getting Very RiskyAPT has been forming Higher Highs and has been in a superb uptrend but now it looks very risky at such elevated levels. As we can see that it has been supported by the upward trendline, we should also notice a Bearish Divergent MACD Cross which indicates that the Bullish Momentum may be running out of steam for now.
I believe that if we see the trendline break, we might see a follow through and price to plummet all the way down to Support at the $70.00 - $72.00 range. This could be a 35% move from current price level of $110.00. APT has been in a Long Term Uptrend and I think we might see a shift in the Medium Term Trend soon, which is fine and healthy for the Long Term Uptrend to continue.
Please note these are my own notes, by no means trading advise. Please do your own research before entering into any trade.

SZL - Is it time to get Bullish?Bullish Confirmation Indications
Recent price action may have confirmed a reversal as we can see that price came down to the trendline and has since moved up.
Price has also moved out of the downtrend line (triangle) which indicates that Buyers are strong.
1. Price has been supportive at the support level of $5.20 level twice which is a Bullish Sign.
2. There also lies a trendline which has acted as good support
3. There also lies 200 day Moving Average trending upward and has provided Dynamic Support (Confluence)
4. Price has been failing to continue up because of the Resistance Zone of $6.80 level
5. I believe that price may come down again to give a buying opportunity and backtest the trendline and continue up
6. I will be confident to buy in the $5.80 - $6.000 region after proving some Bullish Price Action
Please note these are my own notes, by no means trading advice. Please do your own research before entering into any trade.

RZI - A Pull Back may provide a Buying OpprtunityRZI has been strong lately and is now facing resistance at $1.130 zone. It has formed consecutive Higher Highs and any pull back towards Support at $0.890 - $0.900 range should be a good Buying Opportunity in my opinion.
Please note these are my own notes, by no means trading advice. Please do your own research before entering into any trade.

TLS - We may be getting a Buying Opportunity Right Away...TLS seems to be a buy right away, as it has pumped up higher with a massive Bullish Candle above the downtrend line, with High Volume and simultaneously giving a Bullish MACD Cross. It has been falling off like a rock since June 2015 all the way down from $7.00 to around $2.60 ( Support Zone ), but I think we may have seen a Medium and Long Term Term Low as it has bounced off strongly.
We can also see as price was forming lower lows, MACD has been moving up developing a massive Bullish MACD Divergence suggesting a big shift in the Bearish Momentum.
I believe that TLS should continue to move higher until it finds resistance at the R1 zone around $3.30 at TP1, giving a potential gain of70% on the position and move even higher to $3.550 region where my TP2 lies, to give a further 7% gain (or 14-15% gain in total position).
Please note these are my own notes, by no means trading advice. Please do your own research before entering into any trade.

COH - Are we getting a Buying Opportunity Right Away?COH seems to be a buy right away, as it has bounced off with a massive Bullish Candle, with above average High Volume and simultaneously giving a Bullish MACD Cross. It has been falling off like a rock since the 19th of November High of roughly $240.00 all the way down to around $177.00 (Support Zone), shedding almost 26%, but I think we may have seen a Medium Term Low as it has bounced off strongly.
I believe that COH should continue to move higher until it finds resistance at the R1 zone between $205.00 - $210.00 range at TP1, giving a potential gain of 20% on the position and move even higher to $220.00 region where my TP2 lies, to give a further 12% gain (or 32% gain in total position).
Please note these are my own notes, by no means trading advice. Please do your own research before entering into any trade.

ZEL - Buying OpportunityUptrend Confirmed due to recent price action which has confirmed a reversal by pumping upwards and forming a higher high.
1. Price has formed a higher high
2. It has formed a Golden Cross
3. Recent sessions' price action, ( Bearish Candles) indicate that the stock price is pulling back
4. I will be confident to buy in the $2.72 - $2.82 region (Buy Zone) as it is in the 50%-61.8% Fib Retracement Zone (Golden pocket)
5. There is a gap window between $2.73 - $2.96 region (another confluence of Support)
Please note these are my own notes, by no means trading advice. Please do your own research before entering into any trade.

WEB - Giving a Buying OpportunityBullish trend confirmation indications:
1. Made a Higher High
2. Made a Golden Cross
3. Impulsive price action with High Volume
4. After the impulsive break, price is correcting and consolidating.
5. I would be a confident buyer within the Buy Zone which is the Fib Retracement Level Zone of
50-61.8 % and the Gap Window Zone. The ideal level zone is between $4.30 - $4.70. That will be a trade with confluence.
6. Good Buying Opportunity if it closes positive or prints Bullish candlestick patterns in the Buy Zone area
with bullish price action follow through with a potential gain of 120%.
Please note these are my own notes, by no means trading advise. Please do your own research before entering into any trade.

SPT - Looks very InterestingBullish Confirmation Indications
Recent price action may have confirmed a reversal as we can see that price came down to the trendline and has since moved up.
Price has also moved out of the downtrend line (triangle) which indicates that Buyers are strong.
1. Price has been supportive at the support level of $1.00 - $1.30 zone
2. There also lies a trendline which has acted as good support
3. There also lies 200 day Moving Average trending upward and has provided Dynamic Support (Confluence)
4. Price has been failing to continue up because of the Resistance Zone of $1.430 - $1.470 range
5. I believe that price may come down again to give a buying opportunity and backtest the trendline and continue up
6. I will be confident to buy in the $1.120 - $1.20 region (Buy Zone) after proving some Bullish Price Action
Please note these are my own notes, by no means trading advice. Please do your own research before entering into any trade.

Uptrend Confirmed - Next Buying OppurtunityRecent price action has confirmed a reversal by pumping upwards and forming a higher high.
1. Price has formed a higher high
2. It has formed a Golden Cross
3. Recent sessions' price action, ( Bearish Candles) indicate that the stock price is pulling back
4. I will be confident to buy in the $4.15 - $4.30 region (Buy Zone) as it is in the 50%-61.8% Fib Retracement Zone (Golden pocket)
5. There is a gap window between $4.30 - $4.50 region (another confluence of Support)
6. There is a trendline support in the same region which is the third confluence.
Please note these are my own notes, by no means trading advice. Please do your own research before entering into any trade.

ASX - Wave Revision - Ending Diagonal Wave VMapping out the exact waves in this ending diagonal in the Australian Stock Exchange.
Wave v is breaking back into the AriasWave pitchfork channel and will soon retest in Wave E of Wave (B) of this Expanding Type-2 Zig-Zag.
Once the final high is made just above the purple line and then dips back below it this should indicate a top.
Once it breaks back down and out of the AriasWave pitchfork channel this should confirm a top is in place.
Please LIKE and FOLLOW to get notification of updates and future posts.

BOQ - Nice upside leading into earnings - Bullish Flag!!!Technicals - Nice breakout of bullish flag.
Fundamentals - QLD property is forecast to rise.

$RML.AX it may bottomed out - $RML #ASX #GOLD
RESOLUTION MINERALS
Resolution Minerals Ltd (formerly Northern Cobalt) is a mining company engaged in the acquisition, exploration and development of precious and battery metals - such as gold, copper, cobalt, and vanadium.
The company is led by Managing Director Duncan Chessell and an experienced team with proven success in corporate finance, marketing, metallurgy and geoscience. This equips Resolution Minerals with the tools to meet the changing demands of the mining markets.
Resolution Minerals Ltd Listed on the ASX in 2017 with a focus on the exploration of the Wollogorang Copper Cobalt Project. It has since aquired the Snettisham Vanadium Project and entered into a binding agreement with Millrock Resources to earn up to 80% of the highly prospective 64North Gold Project.
The company has strong lines of communication above the normal ASX requirements such as webinars, video explainers and regular newsletters to "take the shareholders on the journey" with the company.

ORG - Potential Buying OpportunityBullish trend confirmation indications:
1. Impulsive price action at the break of the Downtrend line.
2. Price Broke out of the Downtrend Line with High Volume .
3. Price is retracing to the Buy Zone (Fib Retracement Level of 38.2% - 61.8%) between $4.50 - $4.85 Zone
4. MACD Histogram showing a potential shift from Selling Momentum to Buying Momentum.
5. Good Buying Opportunity when it confirms Bullish Price Action.
Please note these are my own notes, by no means trading advise. Please do your own research before entering into any trade.


SLR - Bullish Trend ContinuationBullish Trend Continuation indications:
1. Support Zone Held after Price decline.
2. Trendline Support held after price decline.
3. Price is consolidating above the Support Zone and Trendline.
4. Price Action shows Bears are exhausted.
5. Good Buying Opportunity after Bullish Price Action.
I would be interested to buy after I will see Bullish Price Action and would target the next downward sloping trendline or next Resistance Zone (High Volume Profile Zone) between $2.10 - $2.30) Zone.
Please note these are my own notes, by no means trading advice. Please do your own research before entering into any trade.

ASX - Australian Stock Exchange - The Final Wave Is In ProgressIt is the clear that this final move in the ASX is an Expanded Type-2 Zig-Zag Wave v.
I have linked the bigger picture below in related ideas.
White Wave 4 ended at 6,644 and is critical support for a long trade.
White Wave 5 will likely terminate at the highs marked in the green area.
White Wave 5 must make one final all-time-high in order to complete the move.
Please LIKE and FOLLOW to get notification of updates and future posts.

$FOD.AX on Friday broke out from Long-term FW #ASX $FOD$FOD.AX on Friday broke out from Long-term FW #ASX $FOD

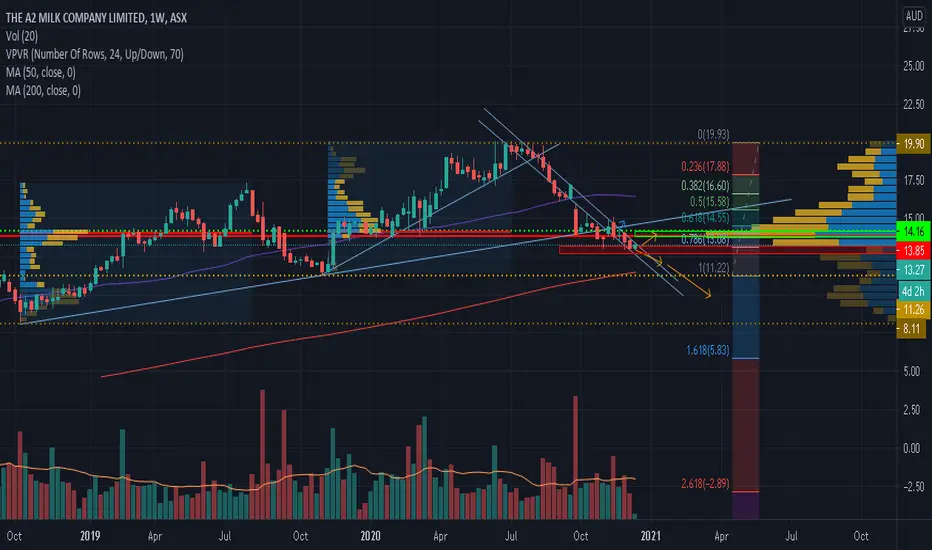
A2M - Bearish (May have more room to the Downside)Bearish Confirmation Indications according to Volume Profile Strategy
As the trend line is apparently broken, the price is now below the heavy volume zone between $13.80 - @14.20 (which may now act as resistance and hence may get selling pressure to the next volume profile zone between $9.60 - @10.20. There are two bearish scenarios that may be possibly in development.
Scenario 1
Either price finds support at the current price level of $13.00 and goes up to hit the High Volume Profile Zone of $13.80 - @14.20 and heads lower to the next lower High Volume Profile Support Zone of $9.60 - @10.20.
Scenario 2
The price continues lower and finds significant support at the next High Profile Support Zone of $9.60 - @10.20.The Volume Profile Zone of $9.60 - @10.20 is expected to be a very strong support zone where I would be interested to buy for medium term.
Please note these are my own notes, by no means trading advice. Please do your own research before entering into any trade.
NEA - Bullish Pennant in Formation I believe that there is a great buying opportunity in NEA, as it has been forming a clear Bullish Pennant since the end of August. It is clearly a continuation pattern and has been consolidating within this pennant. If Price Breaks this pennant with High Volume, this may be a sign that Price may continue pumping up with force and reach the (Resistance 2 - Zone) nearly $3.10 with a potential gain of nearly 32%. Price may even hit the Strong Resistance Zone of nearly $3.90, which may provide a gain of 62%. I believe this is a great medium term buying buying opportunity.
Please note these are my own notes, by no means trading advice. Please do your own research before entering into any trade.
