$CVV $CVV.ASX low supply , Exploration for copper and gold,$CVV $CVV.ASX CARAVEL MINERALS LIMITED
Adding to Watch list
low supply , Exploration for copper and gold,
Number of shares 223,422,691
Asx200

$CDM $CDM.ASX not very long to break out$CDM $CDM.ASX not very long to break out
CADENCE CAPITAL LIMITED
Number of shares 304,963,121

$OTW $OTW.ASX Moving higher $OTW $OTW.ASX
Over the Wire Holdings Ltd - The provision of telecommunications, cloud and IT solutions to business clients.
Moving higher from the Symmetrical Continuation Triangle
Target around $4.31
Directors/Senior management
Mr Michael Nictarios Omeros Managing Director
Mr Mike Stabb CFO

waiting for $67.70 rangeIt's still in bearish trend, though on daily chart touching 200 days moving average.
It's one of the favourites and stable asset to hold, but overbought and overvalued.
I will probably wait for $67.00 to $68.00 range.
P.S: Please note these are my own notes for future reference and by no means trading advise to anyone. Please do your own research before entering into any trade.

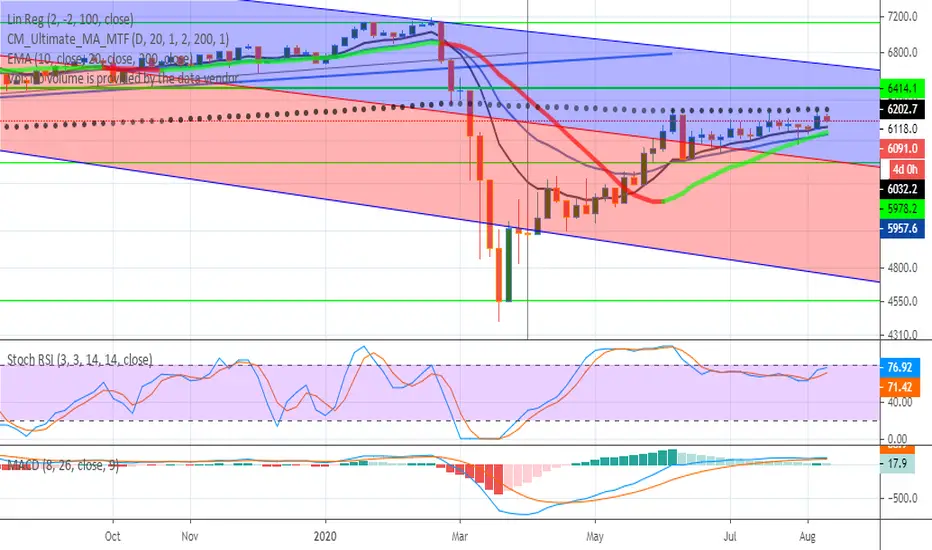
ASX200 up at highs as bulls keep the momentum goingIt seems that the ASX bulls are feeling left out as the US pushes to all time highs. Price is hovering just below the 6200 zone and continues to hold higher lows suggesting that a move up through the level is on the cards in the near term. If we see sellers start to get active up at current levels then watching for a lower high and move back down to clean out some weak buyers.
-------------------------------------------------------------
WE TRADE WHAT WE TEACH
Check out our recent Live Streams from our profile page!!
-------------------------------------------------------------
** If you enjoy our free content, please support and follow our profile, by hitting the Follow button to get further high quality ideas. **
** If you are following our ideas any comments and likes are most welcome and will be greatly appreciated **
** With quality alerts and correct Risk Management, you can learn consistency and grow your account **
** With quality portfolio management and defined risk levels to help your account grow and achieve steady profit targets while increasing your trading edge. **

$EHL $EHL.ASX its shaping and may go higher from here$EHL $EHL.ASX its shaping and may go higher from here
Added to Watch list
Emeco grows on diversification
Emeco Holdings (ASX: EHL) increased its 2020 financial year revenue 16 per cent to $540m, and boosted its net profit 39 per cent to $87.5m, it said in its results presentation.
“Iron ore revenue more than tripled and gold revenue more than doubled,” said the company, which is seeking to diversify its business that was mostly focused on coal.
Coal mining companies provided 49 per cent of Emeco’s group revenue in the June quarter, down from 65 per cent in the 2019 financial year, it said.
Growth for Emeco is coming through new iron ore and gold projects in WA to replace legacy mines, while in eastern Australia customers are looking for cost effective services amid lower coal prices.
The company recently expanded its range of services with the acquisition of WA-based underground mining equipment provider Pit N Portal and is using data analytics to increase equipment efficiency.

Trade with Caution Rising Wedge Pattern Northern Star $NST$NST retested the weekly trendline and 20 moving average,
however, I would trade with caution because a rising wedge pattern is forming on the weekly chart.
Because of the recent run and bearish divergence with DMI and RSI,
I think it is more likely we go down from here due to profit-taking.

Adding more CSL on breakout $CSLI'm planning to add more CSL to my portfolio if price can break and close above this downtrend line + the 20-week moving averages + 50-week moving average.

Cimic Group's 3rd crack at breaking it's Downtrend.Been Following this one for a while now. Monday (17thAug) Cimic will try to breakout of the downtrend it's been stuck in since mid 2019. From the chart we can see that it's had 2 unsuccessful attempts in Jan20 and Jun20.
The difference i spot here is the much lower Stotastic and MACD. These indicators have just turned to buy where previously in Jan & Jun they were reaching exhaustion.

ASX200 / Corrective structure and target on the next ResistanceMain items we can see on the chart:
a) The price is above the ascending channel
b) There we can see a small correction after the new higher highs
c) If the price breaks above the corrective Structure we will assume a continuation movement
d) The target will be the next Resistance zone


TWE - Is it ready to breakout?Ascending triangle formation in the TWE chart. High probabilty trade on the back of the market anticipating a positive close out of their class action dispute and potential market tailwinds with lockdowns easing. Waiting for the break out with bullish candle confirmation.

$MAH $MAH.ASX that Volume trying to say something$MAH $MAH.ASX that Volume
Macmahon Holdings Limited (MAH) is an Australian company providing mining services to clients throughout Australia, New Zealand, South East Asia and Africa. Mining services range from mine development to materials delivery, design, construction and on-site services for mining companies, across a variety of base and precious metals and commodities. MAH provides surface mining, underground mining, engineering, and plant and maintenance.

ASX about to dropisn't it funny when data comes out while technicals provide same story at the same time.
Job numbers came out today and the market didn't like it while hitting the 200 day moving average as resistance
This is the 3rd time since june the ASX has been weighing down by the 200 day MA.
The following time frames show similiar structure
2, 3 days
The 5 day (1week) shows we have popped over it, but will see tomorrow 1 and 2 hour showing still more downtrend.

XJO aka ASX200 attempting to break the 200MA XJO aka ASX200 is trying to reach one milestone that has been thing of the past since the last plunge in early March 2020. is it gonna succeed and fly higher to the moon or this is gonna be a rejection and send us back to the abyss. As TA lets dive deep into the charts and analyze.
From last few days XJO has come up with strength trying to defy the bears traps that wanted to push down down into the abyss. But at the moment the price is at a critical point: 200MA which has been historically the separation line between bull and bear market. Does XJO has strength to break that magic line and go up towards the 7k levels? I have been keeping an eye on this index to know the directions of the whole Australia stock market as we know it. Below are the highlight of the bulls strength vs Bears strength:
- 50MA acting as support: we saw last time price bounced on this magic line
- PSAR flipped to the upside which is inherently bullish
- Price above the Golden Fibonacci. Hopefully it will act as support
- Price above historic resistance/support at 5969
- Price attempting to break 200MA this is bullish if and only if the price rips up that 200MA.
- Bears have one point too, the uptrend line has been broken few days back and it may be hard to reclaim it probably we will have to draw a new uptrend line.
For those late to the party and who want to go long better wait for the price to close above the 200MA at least 1 day then try to get in with tight stop loss.
I will keep you informed as this market keeps swinging up and down.
Stay safe and dont forget to smash the liked. I am scanning the market for the next stock of the week as I have been giving you the best of the bests so far.
XTF.

sit tight & get ready to ride upi think currently market is trying to consolidate and soon it will resume up trend and bulls will take control of market, because:
1. price is continuously above 200 days moving average.
2. during last three weeks for 5 days price gone above 50 days moving average.
3. most of the volume is in the range of $70.80 - $72.20 range which is above 200 days moving average and pretty close to 50 days moving average.
4. based on last one year volume price comparison next targets should be:
4.1. $77.00 - $78.50 range
4.2. $78.50 - 80.00 range
I think we are not to far from upwars breakout.
if you like my ideas please give me thumbs up or leave comments. i think not may people are sharing their idea on this asset. i would really appreicate and incouraging if you consider donating some Tradingview coins.
P.S: These are my own notes for future refernce, by no means trading advise to anyone. please do your own research before entring into any trade.


Prive Volume Analysis - $77 - $78.50 range is possibleif we have price /volume comparison, it's pretty obvious that market likes the price between following ranges based on volume:
1. 67-69 range
2. 70 - 71 range (current range)
3. 70 - 72 range
based on last one year data,I think 77 to 78.50 range is actually where more trades took place than 70 - 72 range.
given this scenario, I think if we get some decent volume and some good news price will easily touch 77 - 78.50 range.
I am still pretty bullish on this asset, as it's holding it's position very well.
p.s: please note these are my own notes and by no means trading advise to anyone. please do your own research before entering into any trade.

Room for Aussie shares to catch up after RBAThe RBA will restart buying Australia bonds as of tomorrow. With new curfew rules keep virus under bay in Melbourne - could be enough....

$NAC $NAC.ASX heading up to fill the Gap$NAC $NAC.ASX
it appears that it is heading up to fill the Gap at $0.970c

The trend is your friend, Go long until this breaks. It did $XJOWe closed below the trend line last week,
can we get above it this week???
If we fail to do so, more selling will come and this could go for several days or weeks.
The RSI indicator is still showing a downtrend and if we close below last week's low this week, (5893)
it will trigger a sell signal with the TD sequential indicator.
Furthermore, the MACD indicator is about to fire a sell signal...
Therefore, be careful trading this week.
Maybe, it is a good time to take some profits ...
