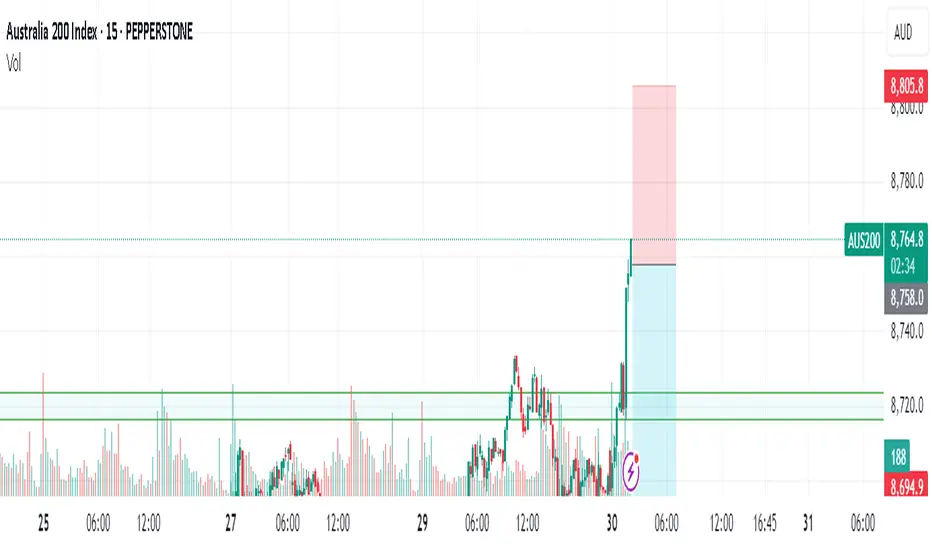
AUS200/ASX200 - ANOTHER OPPORTUNITY TO SHORT AUS200Team, today, good data came out from the AUS200
The market has given some steroids
Time to put an end to this
SHORTING AUS200 at 8761 toward 8772 with stop loss at 8810
Target 1 at 8732-8726 - take 50% volume and bring stop loss to BE
TARGET 2 at 8712-8696
ENJOY YOUR DAY!
Asx200short
Bearish potential detected for SDFEntry conditions:
(i) lower share price for ASX:SDF along with swing of DMI indicator towards bearishness and RSI downwards, and
(ii) observing market reaction around the share price of $5.89 (open of 20th June).
Stop loss for the trade would be:
(i) above the potential prior resistance of $6.08 from the open of 4th December 2024, or
(i) above the potential prior resistance of $6.19 from the open of 3rd July 2024, depending on risk tolerance.

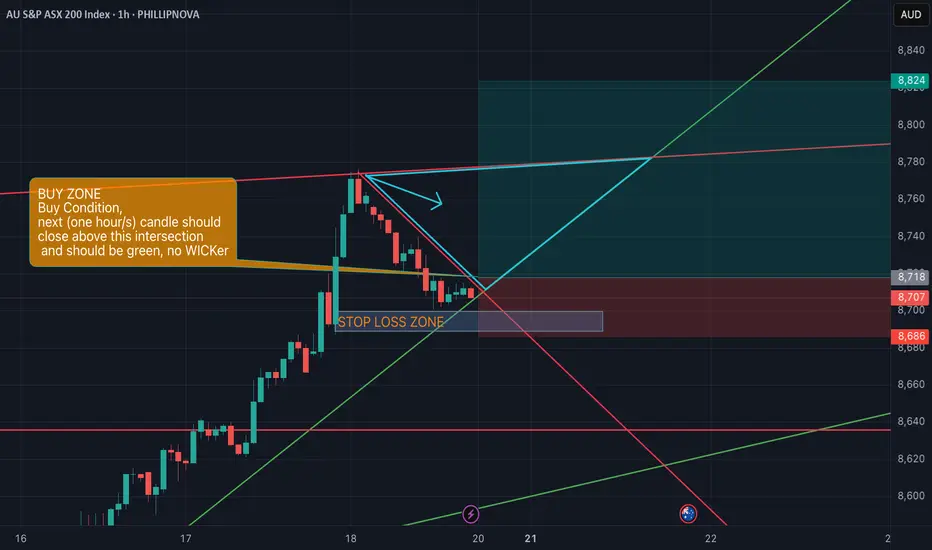
AUS200 Breakout or Fakeout? I Say Breakout – Here's Why🔍 Technical Overview:
After monitoring the recent movement in AUS200, I believe we are in the early phase of a bullish breakout continuation rather than a fakeout.
Uptrend Structure: Price has been consistently respecting higher lows and trending above the green trendline.
Break of Descending Resistance: The downtrend line has now been pierced with momentum candles — a bullish sign.
Buy Condition Set:
Next 1-hour/s candle should close above the intersection (highlighted zone).
Candle should be green, and preferably no wick on the top (indicating strength).
Volume analysis to be considered on confirmation.
✅ Trade Plan:
Buy Zone marked.
Stop Loss Zone clearly defined – I plan to exit the trade if price closes back below the shaded red/gray zone.
Upside Potential: Initial target around 8,820–8,840, with extension toward 8,900+ if momentum sustains.
Risk/Reward ratio looks favorable based on current structure.
📰 Fundamentals:
I have not yet identified any bearish macro or news catalyst that contradicts the current technical picture. If you know of any relevant developments (e.g., RBA policy, earnings, CPI releases), feel free to comment.
🔄 Validation Request:
Would love the community’s take:
Do you see this as a valid breakout?
Any hidden divergence or bearish signals I might have missed?
Let me know if you're tracking the same structure or see something different.
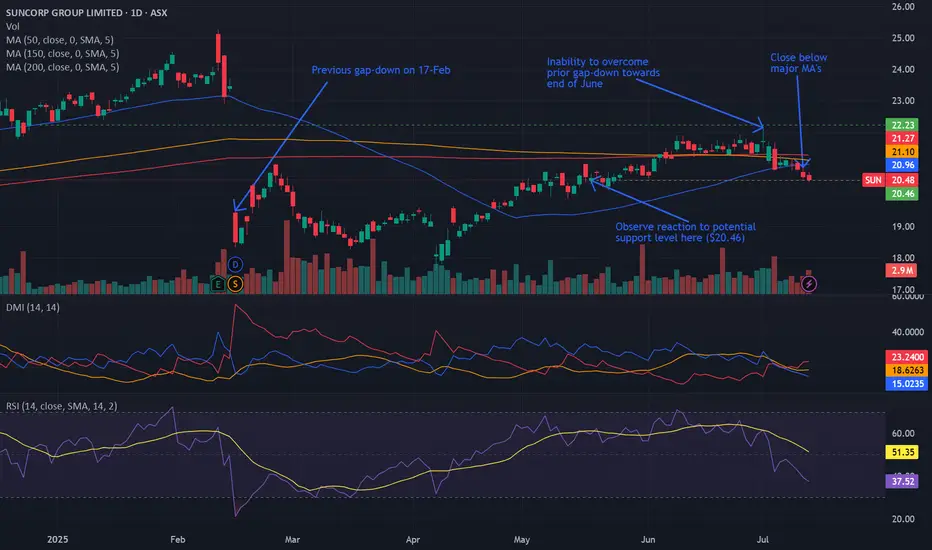
Bearish potential detected for SUNEntry conditions:
(i) lower share price for ASX:SUN along with swing of DMI indicator towards bearishness and RSI downwards, and
(ii) observing market reaction around the share price of $20.46 (open of 19th May).
Stop loss for the trade would be:
(i) above the potential prior resistance of $21.36 from the open of 5th June, or
(i) above the high of the recent swing high once the trade is activated (currently $22.14 from the high of 1st July), depending on risk tolerance.
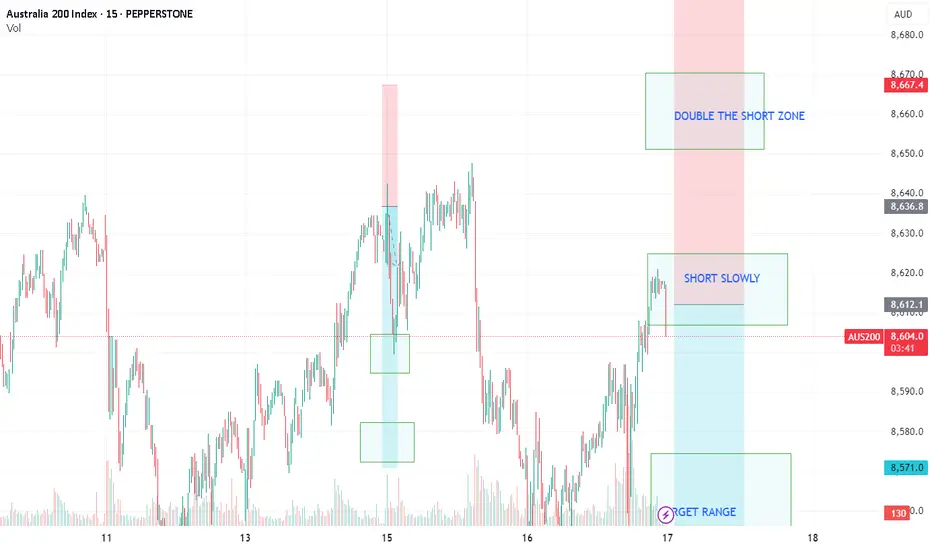
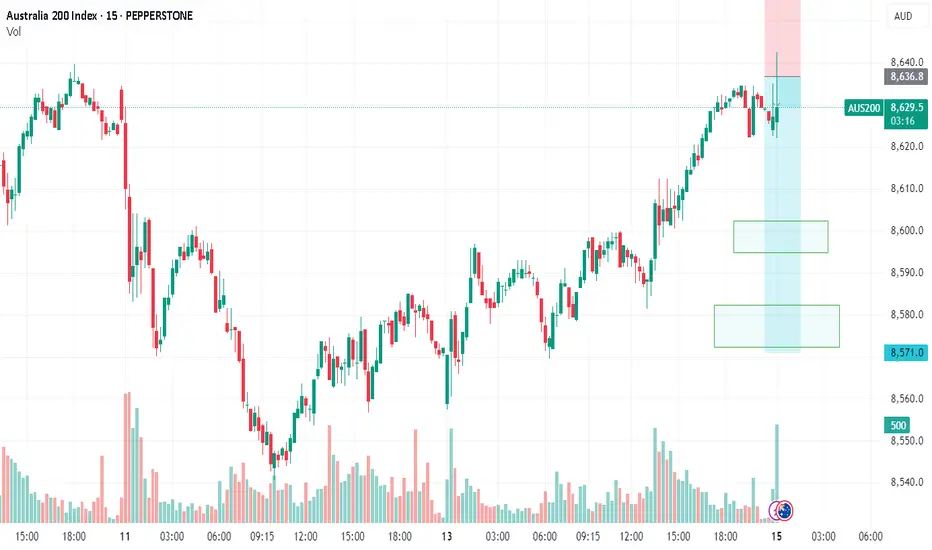
AUS200/ASX200 - ANOTHER DAY TO MAKE THEM PAYTeam, we have successfully SHORT AUS200 last week and kill them with our ACTIVE TRADER COMMUNITY.
Time to have another short at this current price level 8609-8626 ranges
DO NOT FEAR - DOUBLE THE SHORT AT 8642-56 - KILL them
Our first target range at 8586-72 - take 60% profit and bring stop loss to BE
2nd target at 8562-45
NOTE: Next week, we expect the market to be volatile, so be careful with your trade.
AUS200/ASX200 - OPPORTUNITY KNOCKING OUR DOORTeam, time to SHORT the hell out of AUS200 at 8632 to 8645 ranges
Taking 50-60% target at 8606-8592
ensure bring stop loss to BE once it hit our first target
then second target at 8585-8572
LET'S GO AND KILL THEM.
SHORT AUS200/ASX200 - TIME TO SHORT THE AUSSIETeam, over the last few days, we have been successfully SHORT BOTH UK100/AUS200, but I did not post the chart
Today is a good time to post.
Ensure you understand your RISK - can always discuss with us in the room
Let's SHORT UK100/FTSE100, I still expect the market to be volatile even though the US expect a rate cut. on the 9th JULY, there will be a tariff announcement, and it could also extend towards September
We are SHORTING AUS200 at 8586 toward 8616 - SLOWLY
with target at 8562-47
DOUBLE THE SHORT AT 8632-56
Target at 8608-8592

Bearish potential detected for AGLEntry conditions:
(i) breach of the lower confines of the Darvas box formation for ASX:AGL
- i.e.: below low of $9.84 of 7th April, and
(ii) swing increased bearishness of indicators such as DMI/RSI along with a test of prior level of support of $10.02 from 11th March.
Stop loss for the trade (based upon the Darvas box formation) would be:
(i) above the high of 10th April (i.e.: above $10.89), or
(ii) above the prior support level from the open of 10th January (i.e.: above $11.15), depending on risk tolerance.

AUS200/ASX200 - MASTERMIND FOR SUCCESS STRATEGY Team, last night we did another successful trade on DOW/US30 AND NAS30
If you have time, watch my video how i made 1.5k turn into 20k per month and expect 6 months to hit 100k
so far 2 and half month reached 80k
We are shorting slowly at 8572-8586 range
With target at 8545-36
Now, this is another READY set up order if AUS200 hit above 8618-36 - This is where we kill them with DOUBLE UP the volume as per chart
With the target at 8586 -67
LET'S GO.

Bearish potential detected for NHCEntry conditions:
(i) lower share price for ASX:NHC along with swing of DMI indicator towards bearishness and RSI downwards, and
(ii) observing market reaction around the share price of $3.57 (open of 11th April).
Stop loss for the trade would be:
(i) above the high of the recent swing high once the trade is activated (currently $3.75 from the high of 19th May).

AUS200/ASX200 - TIME FOR A KILLTeam, another successful trading at ActiveTraderCommunity - we have hit 4/4 trades again today with target hit.
AUS200/ASX200 has been one of my favorite, but it moves like a snail. However I have all the time in the world to be patience and that what I am good at when it comes in term of trading. Be patience until the PRICE IS RIGHT
Please carefully look at two TARGET price ranges
Target 1 at 8478-8473 - please take 70% profit once it hit here and bring stop loss to BE
Target 2 at 8467-8458 - close our chapter
PLEASE NOTE: These two prices are also taking into consideration base on my statistic and probability of highly chance the target will hit.
Make sure you follow my channel for further trade. As we have not losing a trade for a very long long time. Also click on video above and you will see all my trade are accurate.

Bearish potential detected for WHCEntry conditions:
(i) lower share price for ASX:WHC along with swing up of the DMI indicators and swing down of the RSI indicator, and
(ii) observation of market reaction at the support level at $5.55.
Stop loss for the trade would be, dependent of risk tolerance:
(i) above the resistance level from the open of 21st February (i.e.: above $5.80),
(ii) above the resistance level from the open of 13th January (i.e.: above $5.91), or
(iii) above the resistance level from the open of 30th December (i.e.: above $6.00).

Potential key reversal top detected for GMGLevel of interest: $36.67 area level of interest proved problematic on 22nd July (key support/resistance area to observe). Observe market reaction around this level of interest.
Stop loss for the trade involving ASX:GMG (and indication that this trade is an absolute 'no-go') is any trade above the high of the signal day of 10th December (i.e.: any trade above $39.43).

ASX 200 futures could tease bears at these highsThe ASX 200 futures market has struggled to retest 8500, after a brief and uninspiring spell above it. Overnight gains on Tuesday were seen on low volumes, and Wall Street indices have provided a weak lead today. A bearish divergence has also formed on the daily and 1-hour chart.
While prices have rebounded from the weekly pivot point, price action looks corrective. Hence the bias for it being a corrective channel that could break to the downside.
If we see prices rise at the open, I am on guard for it being a 'last hurrah", which could make it a suitable market to fade into with a stop above the record high. The weekly pivot (8390), weekly VPOC (8348) and weekly S1 around 8300 make viable downside targets for bears.
MS

ASX to find sellers at market price?ASX200 - 24h expiry
Indecisive price action has resulted in sideways congestion on the intraday chart.
Pivot resistance is at 8225.
We expect a reversal in this move.
Risk/Reward would be poor to call a sell from current levels.
A move through 8175 will confirm the bearish momentum.
Our profit targets will be 8150 and 8125
We look to Sell at 8225 (stop at 8265)
Resistance: 8200 / 8225 / 8250
Support: 8175 / 8150 / 8125
Risk Disclaimer
The trade ideas beyond this page are for informational purposes only and do not constitute investment advice or a solicitation to trade. This information is provided by Signal Centre, a third-party unaffiliated with OANDA, and is intended for general circulation only. OANDA does not guarantee the accuracy of this information and assumes no responsibilities for the information provided by the third party. The information does not take into account the specific investment objectives, financial situation, or particular needs of any particular person. You should take into account your specific investment objectives, financial situation, and particular needs before making a commitment to trade, including seeking advice from an independent financial adviser regarding the suitability of the investment, under a separate engagement, as you deem fit.
You accept that you assume all risks in independently viewing the contents and selecting a chosen strategy.
Where the research is distributed in Singapore to a person who is not an Accredited Investor, Expert Investor or an Institutional Investor, Oanda Asia Pacific Pte Ltd (“OAP“) accepts legal responsibility for the contents of the report to such persons only to the extent required by law. Singapore customers should contact OAP at 6579 8289 for matters arising from, or in connection with, the information/research distributed.

AU200 to continue in the downward move?ASX200 - 24h expiry
Indecisive price action has resulted in sideways congestion on the intraday chart.
Momentum is flat, highlighting the lack of clear direction.
Further downside is expected.
Risk/Reward would be poor to call a sell from current levels.
A move through 8200 will confirm the bearish momentum.
We look to Sell at 8240 (stop at 8280)
Our profit targets will be 8140 and 8125
Resistance: 8240 / 8250 / 8275
Support: 8200 / 8140 / 8125

Bearish potential detected for MPLEntry conditions:
(i) lower share price for ASX:MPL along with swing up of the DMI indicators and swing down of the RSI indicator, and
(ii) observation of market reaction at the support level at $3.76.
Stop loss for the trade would be:
(i) above the resistance level from the open of 5th September (i.e.: below $3.91), or
(ii) above the resistance level from the open of 22nd August (i.e.: below $3.99), depending on risk tolerance.

ASX200 "Australia 200 Index" Money Heist Plan on BearishHello My Dear Robbers / Money Makers & Losers, 🤑💰
This is our master plan to Heist ASX200 "Australia 200 Index" Market based on Thief Trading style Technical Analysis.. kindly please follow the plan I have mentioned in the chart focus on Short entry. Our target is Green Zone that is High risk Dangerous level, market is oversold / Consolidation / Trend Reversal / Trap at the level Bullish Robbers / Traders gain the strength. Be safe and be careful and Be rich 💰.
Note: If you've got a lot of money you can get out right away otherwise you can join with a swing trade robbers and continue the heist plan, Use Trailing SL to protect our money 💰.
Entry : Can be taken Anywhere, What I suggest you to Place Sell Limit Orders in 15mins Timeframe Recent / Nearest Swing High
Stop Loss 🛑: Recent Swing High using 1h timeframe
Warning : Fundamental Analysis news 📰 🗞️ comes against our robbery plan. our plan will be ruined smash the Stop Loss. Don't Enter the market at the news update.
Loot and escape on the target 🎯 Swing Traders Plz Book the partial sum of money and wait for next breakout of dynamic level / Order block, Once it is cleared we can continue our heist plan to next new target.
Support our Robbery plan we can easily make money & take money 💰💵 Follow, Like & Share with your friends and Lovers. Make our Robbery Team Very Strong Join Ur hands with US. Loot Everything in this market everyday make money easily with Thief Trading Style.
Stay tuned with me and see you again with another Heist Plan..... 🫂b

ASX looks set to retrace from resistanceThe ASX 200 cash market enjoyed its most bullish day in seven on Thursday. But like the SPI 200 futures contract, it met resistance before pausing.
The daily chart shows that a double top formed around the June 26 high and trend resistance. And as it's not unusual to see a market retrace against a strong move, and we have an NFP report looming which could suppress volatility, we're looking for prices to retrace lower against yesterday's rally.
Bears could target the 20-day EMA between the weekly and monthly pivot point, with a stop above yesterday's high.

Comparing two companies - price action James Hardie vs Boral Limited ASX:BLD
- Price action side by side
- Key levels of Boral
- Keep track of sector and companies
- Trend first and later study fundamental ( for me😉)
Waiting for your comments to learn and share more ....
disc: Not invested , don't know about future
no recommendation only education and entertainment

ASX200 to find sellers at market price?AU200AUD - 24h expiry
The correction higher is assessed as being complete.
We expect a reversal in this move.
Risk//Reward would be good to call a sell from current levels.
A move through 7725 will confirm the bearish momentum.
The measured move target is 7625.
We look to Sell at 7750 (stop at 7790)
Our profit targets will be 7650 and 7625
Resistance: 7750 / 7775 / 7800
Support: 7700 / 7675 / 7625
Risk Disclaimer
The trade ideas beyond this page are for informational purposes only and do not constitute investment advice or a solicitation to trade. This information is provided by Signal Centre, a third-party unaffiliated with OANDA, and is intended for general circulation only. OANDA does not guarantee the accuracy of this information and assumes no responsibilities for the information provided by the third party. The information does not take into account the specific investment objectives, financial situation, or particular needs of any particular person. You should take into account your specific investment objectives, financial situation, and particular needs before making a commitment to trade, including seeking advice from an independent financial adviser regarding the suitability of the investment, under a separate engagement, as you deem fit.
You accept that you assume all risks in independently viewing the contents and selecting a chosen strategy.
Where the research is distributed in Singapore to a person who is not an Accredited Investor, Expert Investor or an Institutional Investor, Oanda Asia Pacific Pte Ltd (“OAP“) accepts legal responsibility for the contents of the report to such persons only to the extent required by law. Singapore customers should contact OAP at 6579 8289 for matters arising from, or in connection with, the information/research distributed.

AU200 remains mixed and volatile.ASX200 - 24h expiry
Pivot resistance is at 7680.
We expect a reversal in this move.
Risk/Reward would be poor to call a sell from current levels.
A move through 7625 will confirm the bearish momentum.
The measured move target is 7550.
We look to Sell at 7650 (stop at 7686)
Our profit targets will be 7560 and 7540
Resistance: 7650 / 7675 / 7700
Support: 7600 / 7565 / 7550
Risk Disclaimer
The trade ideas beyond this page are for informational purposes only and do not constitute investment advice or a solicitation to trade. This information is provided by Signal Centre, a third-party unaffiliated with OANDA, and is intended for general circulation only. OANDA does not guarantee the accuracy of this information and assumes no responsibilities for the information provided by the third party. The information does not take into account the specific investment objectives, financial situation, or particular needs of any particular person. You should take into account your specific investment objectives, financial situation, and particular needs before making a commitment to trade, including seeking advice from an independent financial adviser regarding the suitability of the investment, under a separate engagement, as you deem fit.
You accept that you assume all risks in independently viewing the contents and selecting a chosen strategy.
Where the research is distributed in Singapore to a person who is not an Accredited Investor, Expert Investor or an Institutional Investor, Oanda Asia Pacific Pte Ltd (“OAP“) accepts legal responsibility for the contents of the report to such persons only to the extent required by law. Singapore customers should contact OAP at 6579 8289 for matters arising from, or in connection with, the information/research distributed.

Is the ASX 200 about to roll over?Looking at the weekly chart, bulls may have something to worry about. The market is yet to even test 7500 let alone break above it, and each time it has tried (and failed) to do so, the ASX has fallen by double digits in percentage terms.
A bearish engulfing candle formed in the first week of the year after once again faltering at those cycle highs. And if we're to see even just a 10% drop from the 2024 high it could, the index will find itself back beneath 7000. But if bears really get their way for another -16% drop, the ASX will be back around 6400.
What could make that happen? Well, markets have been aggressively pricing in 5 - 7 Fed cuts this year which may not arrive. And if the wheels fall off the global economy to justify said cuts, that could also be bad for the stock market. So bulls may want to ask themselves if they want to be along at these levels, where the market is yet to every trade above it. As we could be in for a deeper pullback at the very least.
