QAN - Is the pullback Over?QAN had been retracing lower since the last two months and have found support just at the lower edge of the Parallel Channel (Trendline) ($4.40 - $4.50 Zone), coupled with Above Average Volume and a MACD Cross. It has retraced to exact 50% Fib Retracement and is showing some Bullish Price Action. This Bullish price action off Support suggests that the current pull back may be over and it could move higher to towards the Strong Resistance Zone of $5.20 - $5.30 for a potential 10% gain.
Please note these are my own notes, by no means trading advice. Please do your own research before entering into any trade.
Asxlong

ALU - Has it found Support?ALU has been coming down hard and has stopped falling right at $28.00 (Support 1) all the way from $40.00. If this support somehow breaks, then it might come down and test Trendline Support of $26.00 or even come down to Support 2 level of $24.00. In either scenario, we are very close to Support Zone and should be ready for a turn around in ALU.
My target for this trade will be the $34.00 - $35.00 zone as this is a Resistance Zone and also a High Volume Profile Zone.
Please note these are my own notes, by no means trading advice. Please do your own research before entering into any trade

FLT - Retracing Nicely towards Support.FLT seems to be retracing nicely to the trendline Support at around $12.80, as it has shown strength previously also, and made a Higher High. We can also see that it has made a Golden Cross, with RSI about to reach the the Oversold region. The High Profile Volume Zone lies at around $13.80 and 200 SMA in the Buy Zone between $12.80 - $13.80 (many Confluences). I think the Green Box should provide good support, and I expect a bounce off from that Zone.
If it does bounce off, we can expect it to go towards the previous highs giving a potential return of 40% at TP.
Please note these are my own notes, for my future reference only. By no means trading advise to anyone. Please do your own research before entering into any trade.

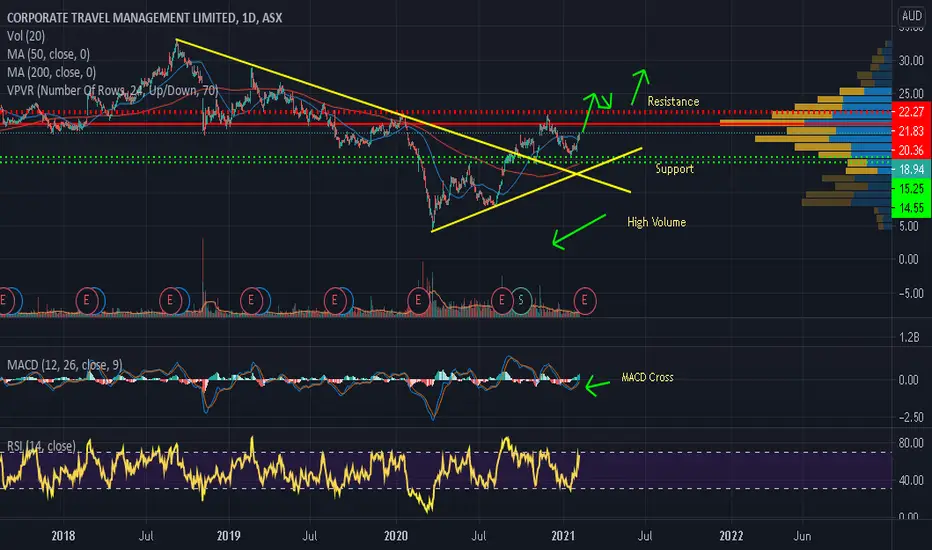
CTD - Will it continue Higher?CTD had broken out of the downtrend line in October with High Volume, and followed through with Bullish Price Action in the Month Of November. It made a high of $21.76 on the 26th of November and since then it has been retracing lower. Recent price action suggests that its retracement is over after finding Support and bouncing off at $15.50 (200 SMA). Currently it is at $18.94, coupled with a MACD cross also indicating it wants to continue higher towards the previous High of $21.76.
If CTD manages to close higher then its previous Highs above $21.76, we may see it continue higher towards its next Resistance which lies at $23.00.
Please note these are my own notes for future reference, by no means trading advice to anyone. Please do your own research before entering into any trade.
Update on ASX:CCPIN early Nov, I wrote about how ASX:CCP would recover and break thru. After a whole month of consolidation between 23-26 dollar range, it finally broke thru previous high of 26.62 with the news (hotcopper.com.au).
On fundamental side, CCP is a debt collection company. its acquisition of the other company's debt, with a great price represented two catalysts : (1) its strengthened its book with some low cost inventory and (2) it consolidated the market further and put CCP into a even better position than before.
I remain to be super bullish about CCP and will hold on my current position. And I am not surprised it will go beyond its historical high of 38 within the next 6 months.

Z1P - What is Next?Z1P broke out strongly last week as expected and was got rejected immediately when it reached its previous Resistance Zone of $8.30 - $8.50. Currently it is hovering between the range of $7.00 - $7.70. I think we could see a bit of consolidation before it continues going higher. I think the best level of Support is around $6.60 - $6.70, which is the Trendline (Neckline) support where it got Support a few times before as well.
We can also see the RSI currently coming down from the Overbought Zone, which may be indicating that Z1P may retrace a bit before taking off. My Initial Target now will be the main Resistance Zone of $10.00 - $10.50 Zone.
Please note these are my own notes, by no means trading advice. Please do your own research before entering into any trade.

APX - Seems that it has found SupportSince the March 2020 lows of around $15.00 to the Highs of $43.60 recorded in late August 2020, we have witnessed weakness in price value, but I think that APX has now found good Support at around $22.00 level, which is also 78.6% Fibonacci Retracement. I think that we may see some Consolidation (Accumulation) or a rise in price above the mentioned Support Level of $22.00, imminently.
MACD has crossed, indicating a decrease in Bearish Momentum and RSI bouncing off the Oversold region which also suggests that Buyers have found value at these current levels and we may witness a bounce in price soon. My Initial Target for the trade will be the next Resistance Zone between $31.00 - $32.00.
Please note these are my own notes, by no means trading advice. Please do your own research before entering into any trade.

LLC - Pulling Back to SupportLLC seems to be pulling back nicely to the trendline Support at around $11.70, as it has shown strength previously also and made a Higher High. We can also see that it has made a Golden Cross, with RSI in the Oversold region. The High Profile Volume Zone also lies at around $11.40, so it seems that the range between $11.40 - $11.80 should provide good support, and I expect a bounce off soon.
If it does bounce off, we can expect it to go towards the previous highs giving a potential return of 14% at TP1 and 25% at TP2.
Please note these are my own notes, for my future reference only. By no means trading advise to anyone. Please do your own research before entering into any trade.

Breakaway GapWhen the price opens above a significant resistance area it is known as a Breakaway Gap.
This is a bullish signal and indicates the start of a strong trend.
Although some would argue that gaps must be filled it is important that we identify what type of gap we are looking at.
Breakaway Gaps are usually backed by a positive announcement and in this case it is;
PUREgraphite Awarded US$5.57M from the U.S.
Department of Energy (DOE) for New Technology
Development
Price is currently sitting at a major Fibonacci level of %61.8.
It is possible that we at a major resistance however a move above this level
could indicate that we are likely to reach the next target of 4.75
-BreadCharts

Z1P tests resistance✔ Facebook Partnership
✔ Ebay Partnership
✔ Harvey Norman Partnership
Holding above the 200 Daily MA Z1P prepares to break out above resistance.
Z1P recently announced a SPP (share purchase plan) @ $5.34 per share. Ending on the 13th of Jan, the SPP may lead to a sell off as the current price is 3.8% above the offer.
Long term growth remains promising
- BreadCharts

Adbri - Ascending Triangle - Approx 17% upsideNot my fav set up here but looks a fairly high probabilty trade.
Technicals - Ascending triangle formation, entry on triangle break with bullish candle confirmation.
Fundamentals - materials sector is expected to get plenty of activity from various government stimuli, plus, low interest rates environment is beneficial. Additionally, the market expected a much weaker outcome as a result of the coronavirus pandemic, and as a result a further bounce in share price is a decent probabilty.

ALD - A Buying opportunityI am bullish on ALD , the chart looks positive as it has made Higher High and even a golden cross.
There is good support between $27.50 - $28.50 range, as its also a High Volume Profile Zone and we can see Bullish Price Action after some consolidation with High Volume.
MACD Histogram is changing color, cold be a possibility of a shift in Bearish Momentum.
I am expecting continuation of the upward trend.
First Take profit at $30.00 range.
Second Take profit at $33.00 range.
Please note these are my own notes, by no means trading advice. Please do your own research before entering into any trade.

WPL - Any Retracement Lower could be a Buying OpportunityThis stock had been hit real hard during the COVID -19 pandemic because of plummeting Oil Prices. Now that we have observed Higher Oil Prices, and particularly WPL has been going up now, I believe the trend will advance further up and we may see much higher prices in the days to come.
We can see a Golden Cross, MACD has crossed and High Volume, which shows the possible change in trend.
Nothing goes up in a straight line, so since price have been moving up we have not seen a decent retracement, so I believe any retracement lower could be a good Buying Opportunity.
We might see some kind of profit taking in the Gap Window Zone, between $24.90 - $26. 40 range, so any pulback lower ideally in the Buy Zone between $20.00 - $22.50 range could be a great Buying opportunity.
Please note these are my own notes, by no means trading advice. Please do your own research before entering into any trade.

SCP - Good Buying OpportunityBullish Confirmation Indications
Recent price action has confirmed a reversal by pumping upwards and forming a higher high.
1. Price has formed a higher high
2. It has formed a Golden Cross
3. After forming a Higher High, price failed to continue upwards and is now pulling back
4. This pull back has come down and has entered in the Buy Zone and Fib retracement zone of 50% - 78.6% of $2.20 - 2.35
5. There is also a trendline support and price may bounce at the lower end of the channel support of $2.20
6. There is a High Volume Profile Zone at $2.20 (another confluence)
7. I will be confident to buy in the $2.20 - $2.35 region (Buy Zone).
Please note these are my own notes, by no means trading advice. Please do your own research before entering into any trade.

SZL - Is it time to get Bullish?Bullish Confirmation Indications
Recent price action may have confirmed a reversal as we can see that price came down to the trendline and has since moved up.
Price has also moved out of the downtrend line (triangle) which indicates that Buyers are strong.
1. Price has been supportive at the support level of $5.20 level twice which is a Bullish Sign.
2. There also lies a trendline which has acted as good support
3. There also lies 200 day Moving Average trending upward and has provided Dynamic Support (Confluence)
4. Price has been failing to continue up because of the Resistance Zone of $6.80 level
5. I believe that price may come down again to give a buying opportunity and backtest the trendline and continue up
6. I will be confident to buy in the $5.80 - $6.000 region after proving some Bullish Price Action
Please note these are my own notes, by no means trading advice. Please do your own research before entering into any trade.

TLS - We may be getting a Buying Opportunity Right Away...TLS seems to be a buy right away, as it has pumped up higher with a massive Bullish Candle above the downtrend line, with High Volume and simultaneously giving a Bullish MACD Cross. It has been falling off like a rock since June 2015 all the way down from $7.00 to around $2.60 ( Support Zone ), but I think we may have seen a Medium and Long Term Term Low as it has bounced off strongly.
We can also see as price was forming lower lows, MACD has been moving up developing a massive Bullish MACD Divergence suggesting a big shift in the Bearish Momentum.
I believe that TLS should continue to move higher until it finds resistance at the R1 zone around $3.30 at TP1, giving a potential gain of70% on the position and move even higher to $3.550 region where my TP2 lies, to give a further 7% gain (or 14-15% gain in total position).
Please note these are my own notes, by no means trading advice. Please do your own research before entering into any trade.

COH - Are we getting a Buying Opportunity Right Away?COH seems to be a buy right away, as it has bounced off with a massive Bullish Candle, with above average High Volume and simultaneously giving a Bullish MACD Cross. It has been falling off like a rock since the 19th of November High of roughly $240.00 all the way down to around $177.00 (Support Zone), shedding almost 26%, but I think we may have seen a Medium Term Low as it has bounced off strongly.
I believe that COH should continue to move higher until it finds resistance at the R1 zone between $205.00 - $210.00 range at TP1, giving a potential gain of 20% on the position and move even higher to $220.00 region where my TP2 lies, to give a further 12% gain (or 32% gain in total position).
Please note these are my own notes, by no means trading advice. Please do your own research before entering into any trade.

ASX:$LYC - watch out this stockThe world's largest producer of rare eart
high quality products include
Neodymium and Praseodymium (NdPr) used in magnets
Lanthanum (La)
Cerium (Ce) and
Mixed Heavy Rare Earths (SEG).
About Lynas Rare Earths Ltd outside China.
Rare Earth Oxides (REOs) are a much sought after resource, particularly within the high technology and low carbon industries. For example, REOs have played an important role in helping reduce energy consumption in many of today's electronic audiovisual, photographic, and music devices.
Also, used in everything from iPhones to weapons,

ZEL - Buying OpportunityUptrend Confirmed due to recent price action which has confirmed a reversal by pumping upwards and forming a higher high.
1. Price has formed a higher high
2. It has formed a Golden Cross
3. Recent sessions' price action, ( Bearish Candles) indicate that the stock price is pulling back
4. I will be confident to buy in the $2.72 - $2.82 region (Buy Zone) as it is in the 50%-61.8% Fib Retracement Zone (Golden pocket)
5. There is a gap window between $2.73 - $2.96 region (another confluence of Support)
Please note these are my own notes, by no means trading advice. Please do your own research before entering into any trade.

WEB - Giving a Buying OpportunityBullish trend confirmation indications:
1. Made a Higher High
2. Made a Golden Cross
3. Impulsive price action with High Volume
4. After the impulsive break, price is correcting and consolidating.
5. I would be a confident buyer within the Buy Zone which is the Fib Retracement Level Zone of
50-61.8 % and the Gap Window Zone. The ideal level zone is between $4.30 - $4.70. That will be a trade with confluence.
6. Good Buying Opportunity if it closes positive or prints Bullish candlestick patterns in the Buy Zone area
with bullish price action follow through with a potential gain of 120%.
Please note these are my own notes, by no means trading advise. Please do your own research before entering into any trade.

Uptrend Confirmed - Next Buying OppurtunityRecent price action has confirmed a reversal by pumping upwards and forming a higher high.
1. Price has formed a higher high
2. It has formed a Golden Cross
3. Recent sessions' price action, ( Bearish Candles) indicate that the stock price is pulling back
4. I will be confident to buy in the $4.15 - $4.30 region (Buy Zone) as it is in the 50%-61.8% Fib Retracement Zone (Golden pocket)
5. There is a gap window between $4.30 - $4.50 region (another confluence of Support)
6. There is a trendline support in the same region which is the third confluence.
Please note these are my own notes, by no means trading advice. Please do your own research before entering into any trade.

ORG - Potential Buying OpportunityBullish trend confirmation indications:
1. Impulsive price action at the break of the Downtrend line.
2. Price Broke out of the Downtrend Line with High Volume .
3. Price is retracing to the Buy Zone (Fib Retracement Level of 38.2% - 61.8%) between $4.50 - $4.85 Zone
4. MACD Histogram showing a potential shift from Selling Momentum to Buying Momentum.
5. Good Buying Opportunity when it confirms Bullish Price Action.
Please note these are my own notes, by no means trading advise. Please do your own research before entering into any trade.

Great online sports betting play : Pointsbet ASX:PBHPointsbet ASX:PBH had a great year in 2020. Its share price has gone from 4.47 -> 11.87 in just one year.
Back in March when the pandemic was first breaking out globally, its share price has once tumbled to $1, as everyone thought there would be no sport matches and people would have less money to gamble. There were indeed much less “games” during 2020, however the company strategy of expanding into the US has yield beautifully as the US market was relaxing their restriction on online sport bettings…and would be even more so in 2021.
Was 2020 presenting the best sentiment for Pointsbet to operate? - Absolutely NOT.
Will 2021 be a much better year for Pointsbet? - ABSOLUTELY! Especially with the vaccine coming in most of the developed country, sports games would start to return to normal, the opportunity ahead for PBH would only be much more compared to that in 2020.
ON technical side, PBH stock price had a huge jump in August when their partnership with CNBC was announced. Its trading range has been contracting ever since, forming at least 4 textbook style VCP from Sep to Dec with shrinking trade volume, not to mention a huge wedge sharp has been formed and all the MA lines are now consolidating at around $12 range waiting for the next catalyst to breakout.
I am seeing an excellent risk reward ratio with investing into PBH, taking its 100MA as cut lost and looking for huge upside to challenge its 52 week high at >$15 range within the next 3 months.
disclaimer : currently having a position in PBH and will be holding for at least another 6 months.
