Room for Aussie shares to catch up after RBAThe RBA will restart buying Australia bonds as of tomorrow. With new curfew rules keep virus under bay in Melbourne - could be enough....
Asxlong

The trend is your friend, Go long until this breaks. It did $XJOWe closed below the trend line last week,
can we get above it this week???
If we fail to do so, more selling will come and this could go for several days or weeks.
The RSI indicator is still showing a downtrend and if we close below last week's low this week, (5893)
it will trigger a sell signal with the TD sequential indicator.
Furthermore, the MACD indicator is about to fire a sell signal...
Therefore, be careful trading this week.
Maybe, it is a good time to take some profits ...

Ansell - Technical Bullish Flag + Fundamental TailwindsLooks to be a bullish flag forming in Ansells chart. High probabilty trade on the back of their cv19 tailwinds/fundamentals. Waiting for the break out with bullish candle confirmation.

IPH share breakout the key resistance level of $7.88ASX:IPH The daily IPH share price has been in trading range since 17 April, 17 june IPH share breakout the key resistance level of $7.88 and closed at $7.98.
A pullbacks in IPH shares seen as buying opportunites.
Prediction target $8.72.

AX.BPT Beach Energybottom wedge
shortterm a break of the fib 2.618 would see it move up
canarvan petroleum CVN much the same

BVS - Bullish Ascending Triangle formationLooks to be a bullish ascending triangle formation in the BVS chart. High probabilty trade on the back of the possible macro changes in the Superannuation sector. Waiting for the break out with bullish candle confirmation

XRO technical analysis PT $100ASX:XRO I have been watching XRO quite long time. Solid bullish pattern, and price target is $100.
Good luck mates, don't miss the train.

XJO end of 13/06/2020. Opening green next weekFinally, a pullback we've been waiting for.
XJO was running way too fast and pullbacks are healthy in the long term. The pullback came right at the 0.618 FIB level.
Tested the 200MA and will be interesting to see if we hold the 200MA next week.
RSI is still relatively overbought but as the pullback was so sharp, I expect a green day on 16/06/2020 Monday.
Apart from the technicals, other reasons for the pullback include
1. Fears of 2nd wave
2. End of financial year profit-taking
3. Federal reserve grim outlook
4. Riots
Next week will be a decisive week in determining which direction the market is headed. The overall sentiment is optimistic but the market does not care.
Next bullish target is 6380 level.
All the best if you went Long on Friday on short-medium term positions.

ASX - Bullish Scenario - Let's Play Devils AdvocateThe bullish scenario here is the same as the Dow and Nasdaq.
The ASX is not as big but the same waves apply in this instant.
If we are in Green Wave 3 of Wave (C) then a break of the magenta line would be confirmation.
Entry: 5937
Target: 6463
Stop: 5634

Go Long ASX200 to 5726-5800. $XJOIf we can break the 50MA (yellow line) in the next few days, the next level of resistance is the red zone just below 5800.
However, I am no longer bullish if we fail to break 50MA and go below the 20MA (green line) or regression channel.
MA - Moving average.

Bigger picture ASX200The asx200 can be seen to be mirroring its entry into the world
With a gap between .786 and .618 in both cases, this is a bullish view

ASX Idea :)Idea for ASX
Multiple ascending scallops
using fibonacci spiral for a support which is also a .236 retracement from the top formed
I've made a few ASX ideas lately but i'm Australian so i feel it suits.
This is a very long term chart!

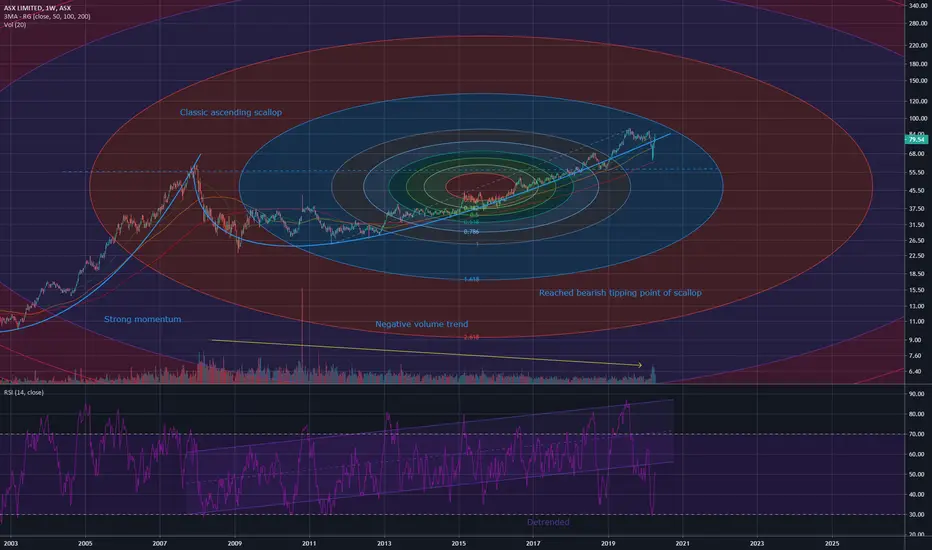
ASX Fib Circle and Ascending ScallopShowing the potential bearishness is an ascending scallop
The leg of the scallop has been extended so far that momentum has decreased and bearish momentum has been engaged
I am very bearish on Australian stocks.
First time using fib circles :)
WESTPAC my god.... short the banks and all that WBCAUDwestpac bank has been completely gutted buy the covid19 mania.... literally feels like 2002 out here ........... gonna catch a long on this soon but no indication of reversal yet

ASX bull trapLikely close below the 200MA on the weekly chart will lead to further downsides as the alligator indicator opens up bearishly. Also currently sitting under the ichimoku cloud, providing a resistance. We could be on the brink (early stages) of a recession.

XJO ASX200 update -Pay attention to the 200 MA low monthlyGood morning,
I want to show you an important trading indicator today and it is the 200 moving average low on the monthly. (currently at 4885)
This indicator acted as major support during the GFC (Nov 2008, Mar 2009) and we tested this level last Friday and bounced strongly.....
I will wait and watch the monthly close to see if this is an excellent buying opportunity from a risk/reward strategy.

ASX200 $XJO Are we heading for a bear market? Good Evening, investors and traders, the Asx200 $XJO went lower again due to market uncertainty with the coronavirus.
Last week, I said if we breach the 50 moving average, the first level of support is around 6300-6400.
The market went straight down to 6259.9 on Monday and traded sideways between 6259-6500 for a few days and eventually making a new low of 6216 at Friday's close.
Next week, I am watching 5800-6100 as a very important area of support. (Currently, I do forecast a dead cat bounce from there)
Furthermore, the ASX200 $XJO must close above or near the 200 MA (red line). If not, we are more likely heading for a bear market.
One important thing to keep in mind is that the VIX is at a bearish high reading.
This tells the mid-large fund organizations such as investment banks and hedge funds to reduce risk and exposure in their long/short portfolios.
The good news is that we do have a TD 9 coming for the Vix and this signal a likely top for the short term.
Therefore, like the hedge funds and investment banks,
I am still only risking a small amount of money in the market. I will go big again WHEN the Vix is below 15 and price level can close above all moving averages. At the moment this price area is around 6666-6800.
Glossary:
VIX
The S&P/ASX 200 VIX Index ( XVI ) calculates the amount of volatility expected in the market over the next 30 days.
• High readings indicate uncertainty ( bearish ) 20-30
• Normal readings suggest a slight bullish bias 15-20
• Low readings indicate low volatility ( bullish ) and strong investor confidence. <14.99
Bear market
A bear market is a condition in which securities prices fall 20% or more from recent highs amid widespread pessimism and negative investor sentiment.

ASX IdeaPotential short opportunity, can be seen to be hanging under the resistance line, with an immediate death cross on the daily chart in play, these are usually more effective on the weekly chart but we will see how it plays out. Aussies spending too much money on toilet paper..

XJO ASX200, close above 20 MA (weekly) to be bullish againThe retracement that I was waiting for came this week and we went down fast and hard.
This has made me more bearish than before in the short term.
We could see an "exit pump" in the next few trading sessions by big investors/institutions and have the price level jump back toward the 20 moving average before going down further like the past. Therefore, for me to turn bullish on the Australia market again, I need to see the price level close above the 20 moving average on the weekly . "Green line" (around 6900-7000).
If we break the 50 MA yellow line:
-I will close all my open positions
-Be out of the market
-so I can buy great companies at a discount once this is over.
-I will be watching that box around 6300-6400 as the first level of support.
#cashisking. #warrenbuffet #valueinvesting

CUE.ASX Simple Trend Line TradeThe setup is pretty basic: there has been a failed pennant which has returned to the long running channel and is heading back to support at 0.125. It may or may not get there, instead turning at the moving average, but it should getto the bottom trend line. I would expect after the price has consolidated a little that the trend will resume. Short term target is 0.150, but could be extended if the price continues hold the trading channel. Very important to keep in mind is that crude oil is selling off at the moment so that may weigh on this trade. Very important to keep a stop at 0.125 because the pants could drop off this in a hurry.

VRX.ASX Possible repeating patternI'm not so certain of this set up, but I'm keeping a close eye on it still. There is a large triangle that has formed in the price action which within it is playing through a series of peaks and troughs. If the cycle series is correct we could expect to see a bump in the next few days. The 200 day moving average was just crossed and now after hit a resistance level at 0.115 the price is reverting. possible that the price could pull back to 0.100 at the dotted line before it moves up again. I wouldn't expect it to go to the trend line again. If so, I would say that the repeating pattern has been made void. however as further confirmation we have a pickup in the volume to confirm the pattern so I think this could be a good trade. I believe that i will leave a stop at 0.100 and use an upper target of 0.165 and a lower target of 0.155.


OLL Looks to be setting up for another runIPO didn't open any higher but on market buying has been impressive, Looks to have most of the supply from Traders/Sellers move it down to the 20EMA where it has seen support, will need a few more days to play out here but possible early entry for anyone building a position
