PNR - Buying OpportunityPNR looks like it wants to move higher. It has bounced off with high volume off support. I am a buyer at current levels targeting recent highs. My TP will be $0.240 (potential 7% gain) with a stop below the lows.
Please note these are my own notes, by no means trading advice. Please do your own research before entering into any trade.
Asxlong

PAN - Buying OpportunityPAN seems to be preparing to move up as there has been high volume recently when it bounced off its 200SMA support. I will be targeting the previous highs at $ $0.175, (potential 8-10 % gain) with a stop below the lows.
Please note these are my own notes, by no means trading advice. Please do your own research before entering into any trade.

MNS - Trade PlanMNS is in an uptrend and has clearly bounced off its 200 SMA. Currently its consolidating and is taking support from the 50 SMA. I am bullish MNS with a stop below the current swing low and a target of $ 0.345 ( a potential 20$ gain).
Please note these are my own notes, by no means trading advice. Please do your own research before entering into any trade.

BRN - Could we see a bounce?BRN looks like it may have found support around the 200 SMA and a possibility that we could see a bounce off soon. MACD has crossed also indicating that this could be a zone where buyers could get strong and take price higher. My target on this trade would be $0.550, a potential gain of 10%) with a stop below the swing low.
Please note these are my own notes, by no means trading advice. Please do your own research before entering into any trade.

SSM - Looking StrongSSM looks like it has changed its trend and is expected to move much higher. Any pull back lower could be a very good opportunity to buy. It has broken its downtrend line with high volume indicating a change in trend. I have my buy zone between $0.880 - $0.930, where I will be looking for bullish price action to buy the dip.
Please note these are my own notes, by no means trading advice. Please do your own research before entering into any trade.

IFL - Bullish Trade PlanIFL is looking good and has been printing higher highs which is a good sign. Currently it seems that it may pull back lower to print a higher low. I expect price to retrace lower towards my Buy Zone between $3.85 - $3.95, which is previous support and also trendline support. I will be taking a long position after bullish price action in the Buy Zone.
Please note these are my own notes, by no means trading advice. Please do your own research before entering into any trade.

TGR - Trade PlanTGR broke out of its downtrend line strongly confirming a change in trend. Currently its pulling back and is at its 61.8 Fibonacci Retracement Zone. I want to see bullish price action in this zone which would give me confidence to take a buy position and I will target the recent highs with a tight stop below the current swing low.
Please note these are my own notes, by no means trading advice. Please do your own research before entering into any trade.

MSB - Trade PlanMSB has been consolidating until recently when it spiked higher and pulling back currently. This could be a buying opportunity as long as its 50SMA support holds. I will be watching price action at the current levels and targeting the upper Resistance level of $2.95 with a tight stoploss below the swing low or the 50SMA at $1.80.
Please note these are my own notes, by no means trading advice. Please do your own research before entering into any trade.

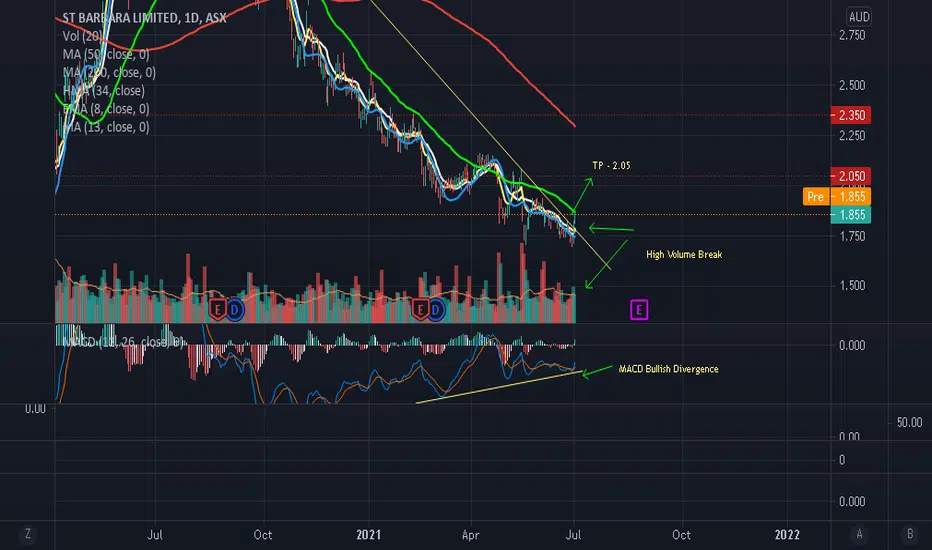
SBM - Trade PlanSBM has broken out of it downtrend line with High Volume indicating a possible change in trend. There is also MACD Bullish Divergence indicating a change in momentum. This shows that the risk to reward is on the upside. My plan is to target the initial resistance level of $2.05 (potential 10% gain) with a tight stop below the recent low.
Please note these are my own notes, by no means trading advice. Please do your own research before entering into any trade.
MAG - Bullish Trade PlanMAG plummeted hard but seems that it has managed to find support at the 78.6 Fibonacci Retracement level. This is a positive sign and any bullish price action should provide confidence to get long. My initial target would be $0.180 (potential 30% gain) with a tight stop below the current swing low.
Please note these are my own notes, by no means trading advice. Please do your own research before entering into any trade.

SLR - Bullish Trade PlanSLR seems to have found support at the current levels and recent price action suggests that it may continue higher. MACD has also printed a bullish cross which may be a sign that price may head higher. My target would be $1.920, the next resistance level (potential 10% gain) with a stop below the current swing low.
Please note these are my own notes, by no means trading advice. Please do your own research before entering into any trade.

SSR - Potential Buying OpportunitySSR broke out of its downtrend in April 2021 and made a high of $24. 40 , in the beginning of June. Since then it has been pulling back and currently at its 61.8% Fibonacci retracement zone. Price Action at the current zone shows that it has found support and any bullish price action will be an encouraging sign to get long. My target will be $23.15, the next Resistance level (potential 10% gain) with a stop below the recent swing low.
Please note these are my own notes, by no means trading advice. Please do your own research before entering into any trade.

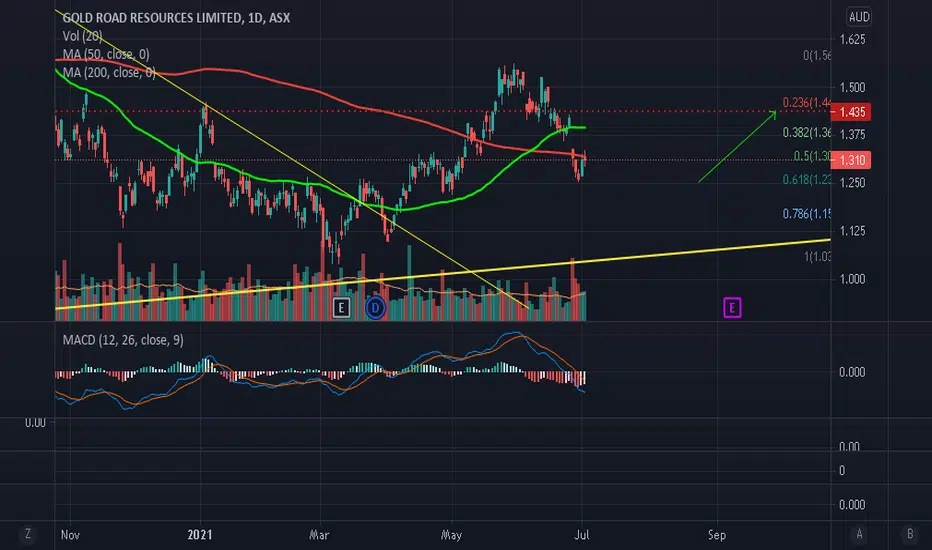
GOR - Bullish Trade PlanGOR has pulled back as expected and a good buying opportunity may be coming up again. The current pull back is expected to get exhausted and I expect price to turn bullish as this is the 61.8% Fibonacci zone. Any bullish price action at the current zone may be an opportunity to take a long position targeting the recent highs. My initial target would be $1.500, the next resistance level (potential 13% gain) with a stop below the swing low.
Please note these are my own notes, by no means trading advice. Please do your own research before entering into any trade.
EVN - Bullish Trade PlanEVN took a beating after gold price dropped but it seems that this current pull back is about to exhaust at the 61.8 Fibonacci level. Some bullish price action at the current levels will be an encouraging sign to get long for a potential target of previous highs. My initial target would be $5.00 level (potential 12% gain) and a tight stop below the current swing low.
Please note these are my own notes, by no means trading advice. Please do your own research before entering into any trade.

NCM - Bullish Trade PlanNCM - After breaking its uptrend, it has pulled back to its Fibonacci 61.8% zone and is showing good support. I will be watching price action at the current levels to see if it shows bullish price action to get long for a target of $28.00 and above (potential gain of 10%), and a tight stop below the current swing low.
Please note these are my own notes, by no means trading advice. Please do your own research before entering into any trade.

NST - Trade PlanNST has pulled back to it's Fibonacci 61.8% zone and is showing signs of support and bullish price action. I am bullish NST targeting the previous highs of $11.80.
Please note these are my own notes, by no means trading advice. Please do your own research before entering into any trade.

API - Trade PlanAPI had moved up strongly breaking the bearish trendline but has pulled back lower again. It could be backtesting the breakout zone for price to move higher. I will be taking a long position if price action confirms with a stop below the low and targeting the recent highs.
Please note these are my own notes, by no means trading advice. Please do your own research before entering into any trade.

ZEL - Trade PlanZEL dropped hard but bounced off strongly off its Strong Support Zone and it could be a false break. The current price action looks bullish and I am targeting the recent highs of $2.68 (potential gain 7%) with a tight stop at $2.38.
Please note these are my own notes, by no means trading advice. Please do your own research before entering into any trade.

SIQ - Trade PlanSIQ may have changed its bearish trend after the break of the downtrend line so any pullback lower may provide a buying opportunity. It could backtest lower towards my Buy Zone between $6.80 - $7.00, where I may take a long position once bullish price action is confirmed.
Please note these are my own notes, by no means trading advice. Please do your own research before entering into any trade.

SXL - Trade PlanSXL has managed to close back inside the Parallel Channel with the lower end of the channel as strong support. The recent bounce off and High Volume suggests it may move higher. I am targeting the POC of the Volume Profile at $2.35 as my TP (potential 10% gain) with a tight stop below the recent swing low.
Please note these are my own notes, by no means trading advice. Please do your own research before entering into any trade.

AVH - Could provide a Buying Opportunity!AVH has bounced off strongly off support and the break lower could be a false break of Support. My Buy Zone is between $4.75 and $5.00 where I may be buying the pullback once price action confirms it, with a potential target of the previous highs. Price is currently showing resistance at the 200SMA and could pullback lower to provide a new buying opportunity.
Please note these are my own notes, by no means trading advice. Please do your own research before entering into any trade.

VEA - Buy the Pullback?VEA has strongly moved to the upside, breaking the downtrend line suggesting that the downtrend may have finished. Currently price is pulling back to backtest the broken trendline which may act as a Support Zone. This may provide a very good opportunity to buy the dip around the Buy Zone of $1.850 - $1.920, with a target of the next Resistance Zone between $2.175 - $2.275. I will be buying once bullish price action confirms it with a stop below this swing.
Please note these are my own notes, by no means trading advice. Please do your own research before entering into any trade.

NVX - Buying Opportunity!!NVX has broken out of the bearish trendline with High Volume and a MACD Bullish Cross, showing conviction of the Bulls. This price action suggests it may go higher towards the next Resistance levels. My Tp1 is $2.75 with a potential gain of 16% and TP2 at 3.00 with a potential gain of 27%. My stoploss on this trade will be below this swing low at $2.00.
Please note these are my own notes, by no means trading advice. Please do your own research before entering into any trade.
