REI/USDT CYCLE UPDATE $0,90 by 2025 - Price prediction📈 REI/USDT CYCLE UPDATE – $0.90 by 2025
REI could break above its old ATH, targeting $0.90 in the upcoming cycle. Why?
Upcoming
✅ Ultra-fast blockchain (⏱️ 1.5s block time)
✅ Gas-free or near-zero fees – perfect for DeFi, NFTs & gaming
✅ EVM-compatible – easy migration for Ethereum dApps
✅ Low market cap → high upside potential
✅ Clean tokenomics with staking + resource model
✅ Built for speed, scale & adoption
DATA
Data shows that there is a structural trend going on, where this coin can break soon.
If the altcoin market heats up, REI has the fundamentals & tech edge to explode past previous highs. 🚀
🧠 Watch this one closely.
#REINetwork #Crypto #Altseason #EVM #PricePrediction #Web3
This is not trading advice, but a view from a side of study.
ATH

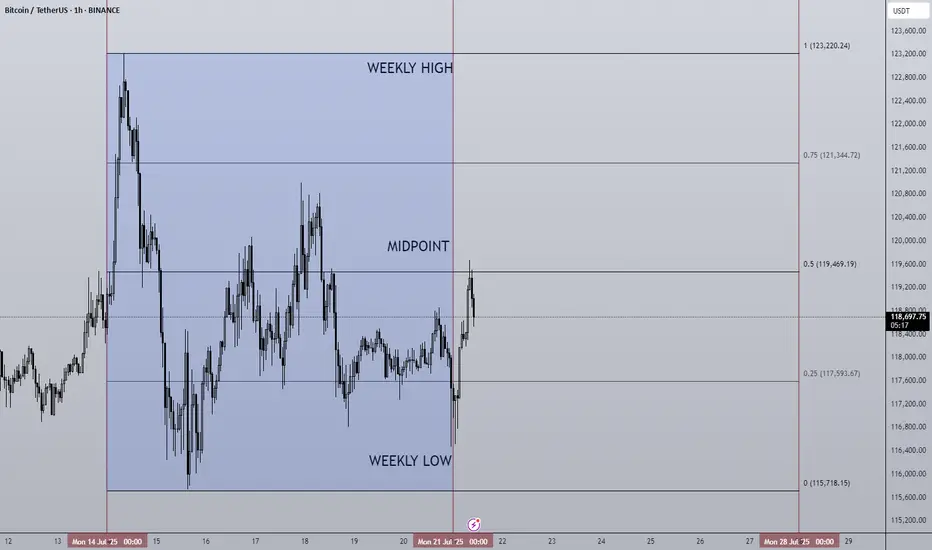
21/07/25 Weekly OutlookLast weeks high: $123,220.24
Last weeks low: $115,718.15
Midpoint: $119,469.19
New BTC ($123,220) & SPX ($6,315) ATH last week! We're really seeing progress being made on all fronts now, bitcoin saw its sixth week of net inflows into BTC ETFs ($2.39B).
The week began strong hitting the new ATH very early and then settled into a tight range to cool off. Altcoins however surged in relation to BTC to break out of HTF downtrends and begin to make up lost ground. One of the beneficiary's of this price movement has been ETH, breaking out from a multi year downtrend against BTC and hitting $3,800 in its USD pair.
For this week I do expect much of the same for BTC as momentum is with altcoins for now. However, as those altcoins reach HTF resistance levels it becomes very important for Bitcoins chop to be accumulation for the next leg up and not distribution for the way down. With so few pullbacks the threat of a sudden correction is present but the probability drops should BTC look to press higher with strong demand.
The ECB Interest rate decision takes place on Thursday but no changes to the 2.15% rate is forecast. In terms of news there are no planned upsets that I can see.
Good luck this week everybody!
Bitcoin Trading Update: Consolidation, Patterns, and What's NextHey Fellow Traders! 👋
Bitcoin (BTC) has been on a wild ride after hitting its all-time high (ATH)! 📈 Since then, it’s been consolidating, generating liquidity, and setting the stage for the next big move. Meanwhile, altcoins are absolutely booming, stealing the spotlight! 💥 As we kick off the week, let’s dive into what’s happening with BTC and what to watch for.
📊 Technical Analysis Breakdown
Here’s what I’m seeing on the charts:
Head and Shoulders Pattern: A clear head and shoulders has formed on BTC, signaling a potential bearish move. 🐻
Daily Timeframe Order Blocks: These are in play, showing key levels of support and resistance.
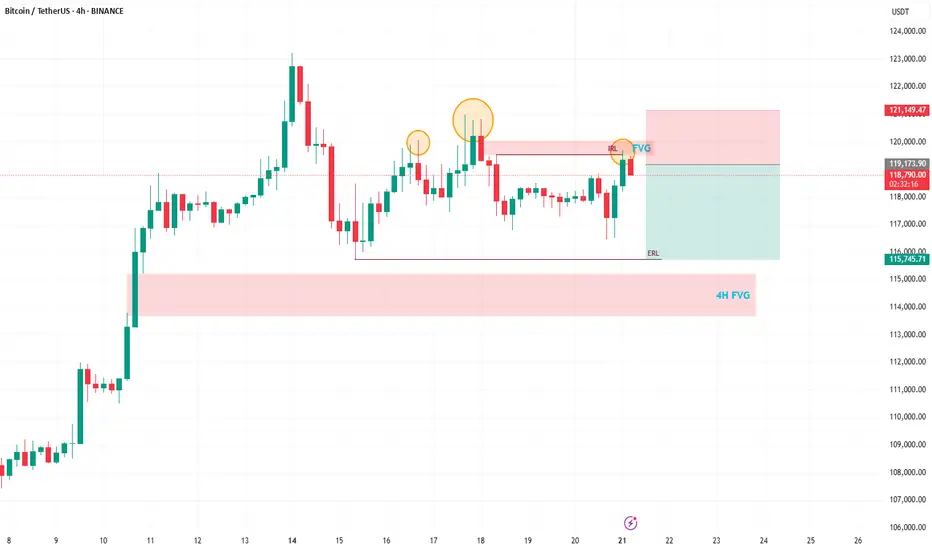
Filled Fair Value Gap (FVG): A recent FVG on the daily chart has been filled, but there’s still a beautiful 4H FVG waiting to be tested below.
Liquidity Sweep: After the ATH, BTC needs to clear the liquidity from the past few days before it can push for new highs.
🔍 What’s Next for BTC?
I’m expecting a bearish reaction in the near term, with BTC targeting the sell-side liquidity around $115,800. This move should also fill the 4H FVG, setting the stage for a potential bounce and another shot at the ATH. 🚪 Keep an eye on these levels, as they’ll be critical for the next big move!
🔔 Stay in the Loop!
Let’s keep the conversation going! 💬 Follow for more updates, like if you found this helpful, and drop a comment with your thoughts or what you’re seeing in the markets. Are you trading BTC or riding the altcoin wave? Let’s hear it! 👇
Happy trading, and let’s make this week count! 💪
#Crypto #Bitcoin #Trading #TechnicalAnalysis
ATH FOR Ethereum!!!Hello friends🙌
As you know, Ethereum has been on an upward trend these days and we can say that buyers have entered, but not completely...👀
🔊Now, considering the resistance that Ethereum is facing, namely the number 3900 to 4100, we need to see what reaction the price will see this time when the price reaches this resistance for the 4th time?
✔We will most likely make a small correction and this time this major resistance will be broken again and we will witness a higher ceiling.
✔Otherwise, I have an important and key support that we have identified for you and if the price drops, this support is a good area to buy again.
And finally, observe risk and capital management⚠
🔥Follow us for more signals🔥
*Trade safely with us*

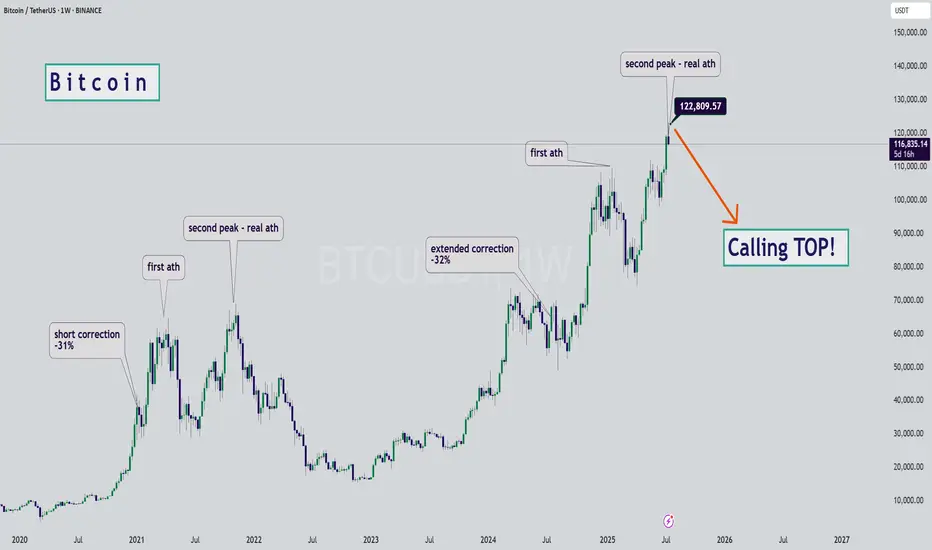
BTC - Calling the Start of the Bearish SeasonHello Watchers ☕
This was my previous Bitcoin update where I had a target of $116K, and also then closed all open positions at $122K:
I'm calling the top here mainly because of the way the chart looks, it really is classic Wyckoff if you look at the duration of the current bullish cycle, which has lasted a whole 973 Days with a 564% increase. What goes up, must come down!
Just for interest sake, the previous bullish cycle ran for 600 days with a 700% increase.
Weekly/monthly bullflag on xrpusdAn even higher target than the symmetrical triangles two potential targets materializes when we confirm the breakout up from this bull flag. It will likely have a bullish target somewhere around $5.20. Upon reaching this target it will also be breaking above a big cup and handle that will then have an even higher breakout target which I will post in my next idea *not financial advice*

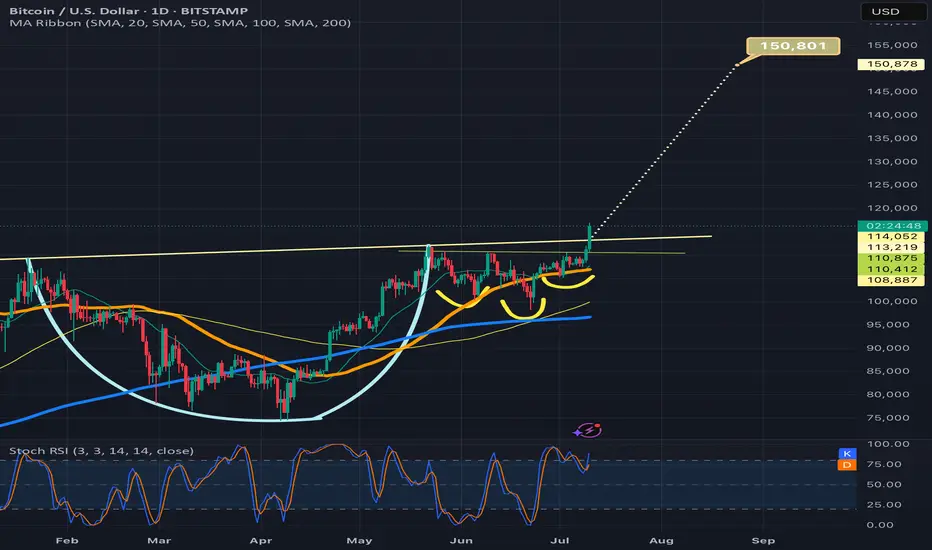
Btcusd breaking above cup and handle necklineIf it confirms the bullish breakout the target is 150k. Also by breaking above 116k and solidifying that level as strong support, we will trigger an even bigger inverse head and shoulders pattern (not shown here) with a breakout target around 208k! I will provide a link below to the chart I posted of that pattern. Thanks for reading, liking, and following. *not financial advice*
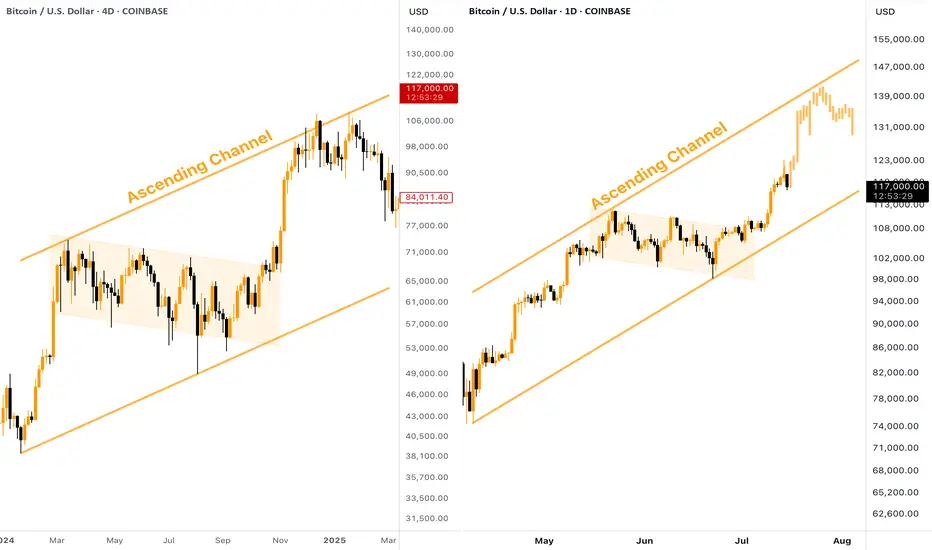
[BITCOIN] - Where is Potential TOP (ATH) of the Bull Cycle?Many people wondering where is the potential TOP of the current Bitcoin Bull Run? Besides setting a Fibo Retracement, we can take a look at the past. The current situation on CRYPTOCAP:BTC chart reminds me of what we've seen in the end of 2024, here is why:
Big ascending channel, price perfectly moves inside without breaking borders
Descending consolidation inside the bull flag
Strong breakout and pump towards the resistance of the channel
👉 According to this pattern, the target for the current Bitcoin upward move should be located in the $140,000 zone. Keep this in mind when planning your trades.
Bitcoin in New Ascending channel wait for 160K$As we can see Price broke previous ATH & channel resistance together and is holding strong, if it continue soon new channel is path to claim for Price based on chart and targets like 160K is just easy to hit.
So get Ready for new Highs and ATH here also this breakout to upside was mentioned in previous analysis and now that it is happening don't get surprise if you see notifications like Bitcoin new ATH 150K$.
DISCLAIMER: ((trade based on your own decision))
<<press like👍 if you enjoy💚

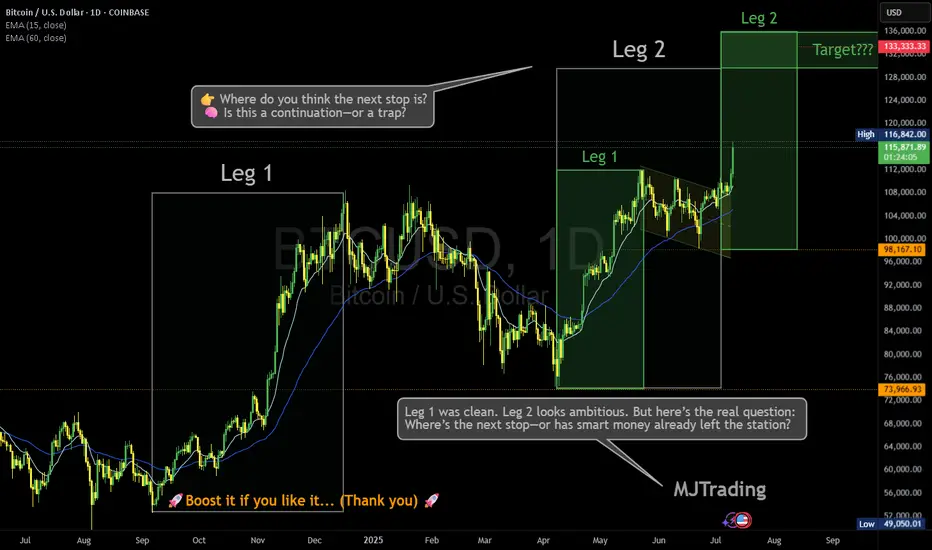
Where is the next stop? 133,333?Leg 1 was clean. Leg 2 looks ambitious. But here’s the real question: Where’s the next stop—or has smart money already left the station?
BTC just sliced through both EMAs with conviction, now hovering above $116K. Volume’s decent, sentiment’s euphoric… but is this rally genuine markup, or a cleverly disguised distribution phase?
🔍 Price targets like $133K are seductive—but what if consolidation isn’t horizontal anymore?
Vertical consolidation is real. And it’s where retail gets baited hardest.
📊 Leg 2 might still play out—but don’t ignore the possibility that this is the final markup before a liquidity sweep.
👉 Where do you think the next stop is? 🧠 Is this a continuation—or a trap?
Drop your guess...
Who has entered here:?
Who can let the winners run in this situation:
#MJTrading #ATH
#Bitcoin #BTC #CryptoTrading #SmartMoney #MarketStructure #WyckoffMethod #LiquiditySweep #DistributionPhase #TechnicalAnalysis #TradingView #CryptoChart #PriceAction #EMA #Consolidation #CryptoStrategy #TrendReversal #CryptoCommunity
ATH Mode On => Request Your Altcoin Analysis NowThe bulls are back in action, and momentum is building fast! ⚡
To celebrate this major milestone, I’m opening the floor to YOU 👇
Request any altcoin in the comments, and I’ll personally share my technical analysis on it! 📊✅
Let’s make the most of this market together — it’s altcoin season waiting to happen! 🚀
📚 Always follow your trading plan regarding entry, risk management, and trade management.
Good luck!
All Strategies Are Good; If Managed Properly!
~Richard Nasr

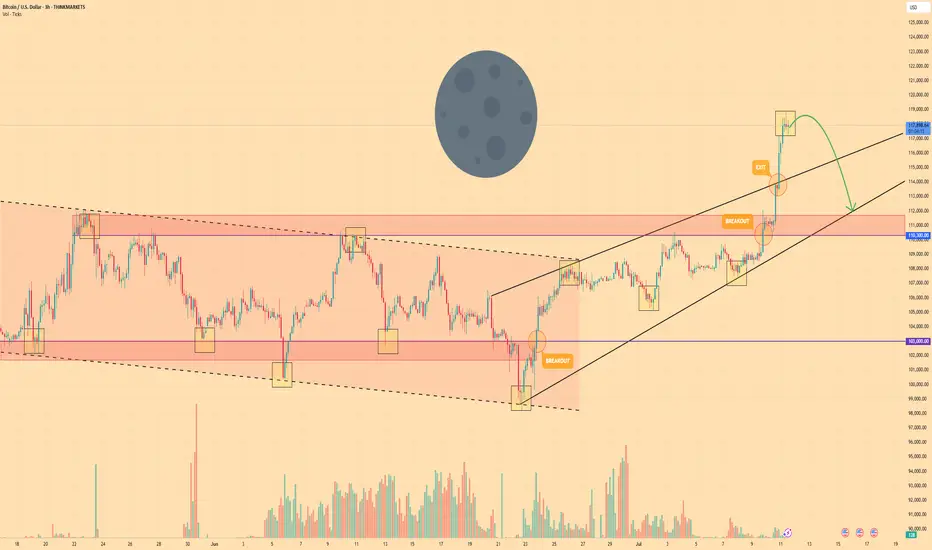
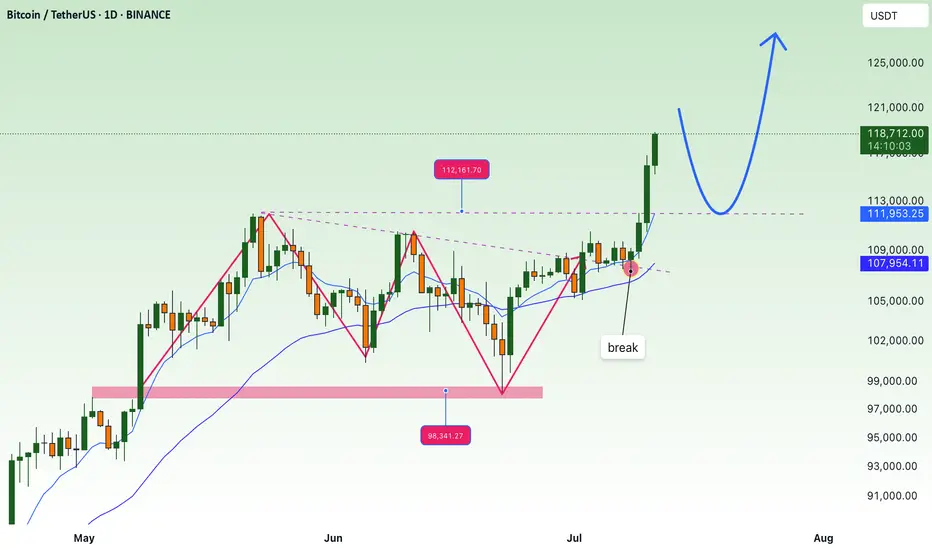
BITCOIN - Price can go into correction after reaching new ATHHi guys, this is my overview for BTCUSD, feel free to check it and write your feedback in comments👊
Bitcoin spent weeks confined to a tight falling channel, carving out a series of lower highs and lower lows as sellers maintained full control of the market.
The breakout above $110300 ignited a powerful rally, propelling BTC into an ascending wedge formation and driving price sharply higher toward a fresh all-time high at $118800.
Once the ATH was reached, selling pressure reasserted itself, halting further upside and triggering a loss of bullish momentum.
This lightning-fast climb to $118800 appears to have drained buyer enthusiasm.
Key support now resides around $110300 - $111700, backed by the wedge base.
Given the exhaustion of buyers and the clear wedge resistance, I anticipate BTC to retrace toward the $112000 area following its recent surge.
If this post is useful to you, you can support me with like/boost and advice in comments❤️
Disclaimer: As part of ThinkMarkets’ Influencer Program, I am sponsored to share and publish their charts in my analysis.
BTC/USDT : Breaks Out – New Highs In Sight After Smashing $111K!By analyzing the Bitcoin (BTC) chart on the weekly timeframe, we can see that the price has finally started to rally as expected—successfully hitting the $111,700 target and even printing a new high at $111,999 with an impressive pump.
This analysis remains valid, and we should expect new all-time highs soon.
The next bullish targets are $124,000 and $131,800.
THE WEEKLY TF ANALYSIS :

FOMO price increase, create new ATH💎 Update Plan BTC weekend (July 11)
Continuously creating a new ATH, preparing to have a short sale?
The reinforcement of Bitcoin price around the upper boundary of the previous consolidation area was broken at $ 108,355, which ended on Wednesday. The price has soared to the highest level of the new time of $ 116,868 on Thursday. At the time of writing on Friday, the price is fluctuating above $ 116,600.
When BTC entered the price exploration regime and if the trend of increasing continues, the price can expand the momentum to an important psychological level of $ 120,000.
Technical analysis angle
Our community has continuously chose the trend of increasing as the mainstream for all previous transactions and currently preparing to welcome 120k as forecast.
The relative power index (RSI) on the daily chart reaches 71, higher than the excess buying 70, showing a sharp increase. However, traders should be cautious because the ability to adjust the decrease is very high due to over -purchase. Meanwhile, the average divergence dynamic indicator (MACD) has shown a price intersection at the end of June. The indicator also shows that green histograms are increasing on neutral zero, showing that the rising momentum is being strengthened and continues to increase.
However, if BTC must be adjusted, the price may extend the decline to search and support around the upper boundary of the unified area that has been broken earlier at $ 108,355.
Plan has been constantly accurate in the past 2 months, which is the positive signal of the channel that brings value to the community.
Please follow the channel to receive accurate scenarios about gold and BTC
==> Comments for trend reference. Wishing investors successfully trading
BTC - I made this chart in early 2021Shocking to login in to Trading View after 4 years to see this chart saved and how well the fib targets and channel is playing out.

Bitcoin ATHBINANCE:BTCUSDT This is amazing for crypto community because this level-up all of lover crypto currencies.
Next target: 120.000K
Best for pollback levels: 111.000K & 105.500K
👓We are this time keep calms emotional in buy or sell.

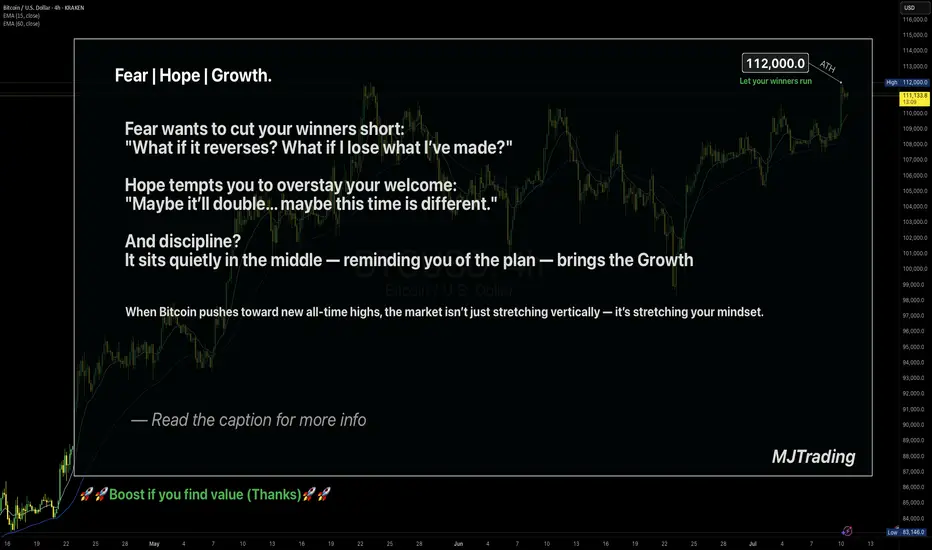
Let your winners run🧠 Fear | Hope | Growth – When Trading Meets Emotion
The message on the chart isn't just poetic — it's real psychology.
🔹 Fear wants to cut your winners short.
It sneaks in after a small move in your favor.
"What if it reverses? I better lock this in."
And just like that, a great trade turns into a missed opportunity.
🔹 Hope drags you into holding too long.
It dreams: "Maybe it doubles... maybe this time it'll be massive."
But it's not guided by data — it's driven by fantasy.
🔹 Discipline is what sits in the middle.
Quiet. Neutral.
It doesn’t scream or seduce — it just follows the plan.
And that’s where Growth lives — not just on the PnL, but in your psychology.
When Bitcoin pushes toward new ATHs, these emotions get amplified.
The real question becomes: Can you manage yourself, not just your trade?
📌 A Real Example from My Desk
In my earlier BTCUSD idea — “Another Edge – Decision Time” (shared above) —
I sent that setup to one of my managed clients.
He entered long exactly at the edge of the channel — a clean, strategic buy.
Price moved beautifully in our favor…
But he manually closed the trade at 106,600 — long before the move matured.
Why?
Because fear of giving back profit overwhelmed the original plan.
The chart was right. The timing was right.
But the exit was emotional, not tactical.
✅ The trade made money.
❌ But the lesson is clear: a profitable trade doesn’t always mean a disciplined one.
🎯 Final Takeaway:
“Fear kills your winners. Hope kills your timing. Discipline grows your equity and your character.”
🗣 What would you have done in that position?
Held longer? Closed at resistance? Let it run toward ATH?
Let’s talk psychology — drop your thoughts 👇
#MJTrading
#TradingPsychology #BTCUSD #FearHopeDiscipline #LetYourWinnersRun #PriceAction #BTCATH #ForexMindset #CryptoStrategy
30/06/25 Weekly OutlookLast weeks high: $108,531.02
Last weeks low: $99,592.69
Midpoint: $104,061.86
Overall a positive week for BTC in isolation as price moves steadily all week reclaiming the losses made in the week from the 16th-23rd June. This comes after a $2.2B BTC ETF weekly inflow, the 3rd consecutive week of net inflows.
Having now hit the key S/R level of $108,500 it will be interesting to see where BTC goes from here. Jumping up above the level will require a lot from the bulls as ATH is within touching distance and so buying into major resistance is a tough ask. We also have Geo-political uncertainties to add to the situation, one bad tweet is all it takes sometimes to do a lot of damage.
On the other hand the SNP500 hits new ATH in the same conditions and so BTC is more than capable of doing the same.
So far in the first hours of this weeks trading we do have a SFP of the weekly high setup, not ideal for the bulls in any way and so from here the a retest of the range quarters, midpoint being the key area would make sense, invalidation would be a clean break above weekly high with acceptance and strong volume on the move to break the rangebound/choppy environment.
There is also the "window dressing" element to the months &quarter end today. History shows a de-risking going into these events and more money flowing back into risk-on assets in the days following monthly/ quarterly end. For that reason a bullish move (if there were to be one) would come later in the week IMO.
Good luck this week everybody!

BTC to move upwards this week?Daily Outlook:
- market swept sellside liquidity
- price moved impulsively
- market moving higher reaching buyside liquidity
- may reach ATH and sweep to go lower

₿itcoin Dominance New Cycle High 66% ₿itcoin Dominance reaches new cycle high tapping 66%
If there's one thing I learned this cycle, it's never to sell your CRYPTOCAP:BTC for Alts.
If you want to play the casino, play with USD 💯

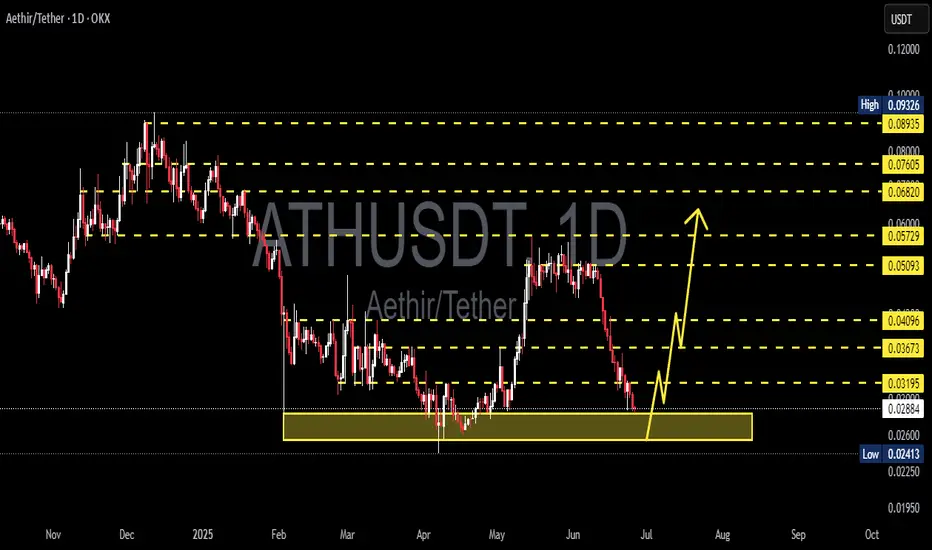
ATH/USDT Reversal Play from Strong Demand Zone! Potential 100%AETHR/USDT Daily Analysis – June 26, 2025
AETHR has reached a key demand zone around 0.024–0.028 USDT, which has historically acted as a strong support area. The price has formed a clear double bottom structure and is currently showing early signs of a bullish reversal.
📌 Key Observations:
Strong bounce expected from the 0.024–0.028 zone.
First resistance levels to watch:
🔹 0.03195 (minor resistance)
🔹 0.03673
🔹 0.04096
Medium-term targets:
🔸 0.05093
🔸 0.05729
🔸 0.06820
Ultimate bullish target zone:
🔺 0.07605 – 0.08935
📉 Invalidation Level: A daily close below 0.02413 (previous swing low) could invalidate this bullish setup.
BULLS HOLDING KEY PIVOT 〉ATH AROUND THE CORNER As illustrated, Im trying to visualize what a potential bull run could look like starting from what seems to be a "bullish signature" move by gold: a diagonal double bottom.
Don't believe me; go back in time and study how gold makes bottoms and how new bull runs start. The fact that it was NY that manipulated BOTH times and got the best price, is a strong footprint that MIGHT just indicate a potential bottom (at least of this current bearish correction.
I won't say "this is it" and ATH are next FROM this potential rebound; HOWEVER, it could indicate at least the next 10 to 24 hours of potential bullish impulse to retest a degree of the bearish drop since Sunday's weekly open.
Hammer candle from Tuesday's NY session low + today's 4H bullish engulfing, are also powerful components that show bullish strength indicating 3300 to be a major support area.
I'm expecting (BUT NOT ADVISING) Asia to break aggressively to the upside confirming that this could have been this current correction's bottom, and/or at least this week's low.
Should Thursday close above Tuesday's high or consolidating near it, also shows signs of bullish strength and opens the door for Friday to make a second bullish impulse move.
This would reflect on the Weekly candle leaving a long rejection wick and closing (potentially) back above 3350 - 3360.
Should this be the case, the following week would have the road paved to lift off price to retest previous 4H highs of 3440 - 3450 range.
...
July is a bullish month historically. Don't believe me; search "seasonality tool, gold" and see it for yourself.
It is a matter of weeks for Gold to breakout of this wide accumulation phase it has been since end of April, and start a fresh and brand new bull run that could/should last until the end of the year.
-
GOOD LUCK
Persa

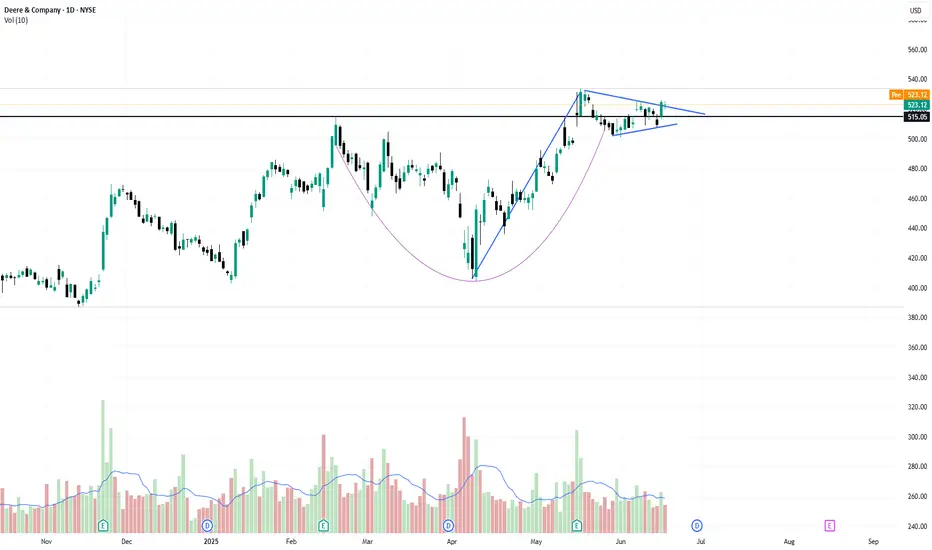
the wedge pattern breakout near ATHStock is outperforming the index and trading near its all-time high and forming a small wedge pattern, indicating consolidation before a potential breakout. A sustained move above $507.50 could trigger bullish momentum. Targeting $553 in the near term. Risk-reward remains favorable with strong price structure and bullish sentiment.