Gold 1H Intra-Day Chart 19.03.2025Our $3,035 buy target has been hit. So what's next?
Option 1: Gold drops lower towards $3,020 before pushing back up again.
Option 2: Gold pushes higher towards $3,042 before it DROPS lower.
Which option do you agree with more?
ATH

Gold 1H Intra-Day Chart 14.03.2025Last night I said I want Gold to hit $2,980 which it did this morning. So what's next?
Option 1: Gold buyers hold steady & climb towards $3,020 - 40.
Option 2: Gold DROPS lower from here towards $2,970 - $2,940.
Which option do you agree with more?

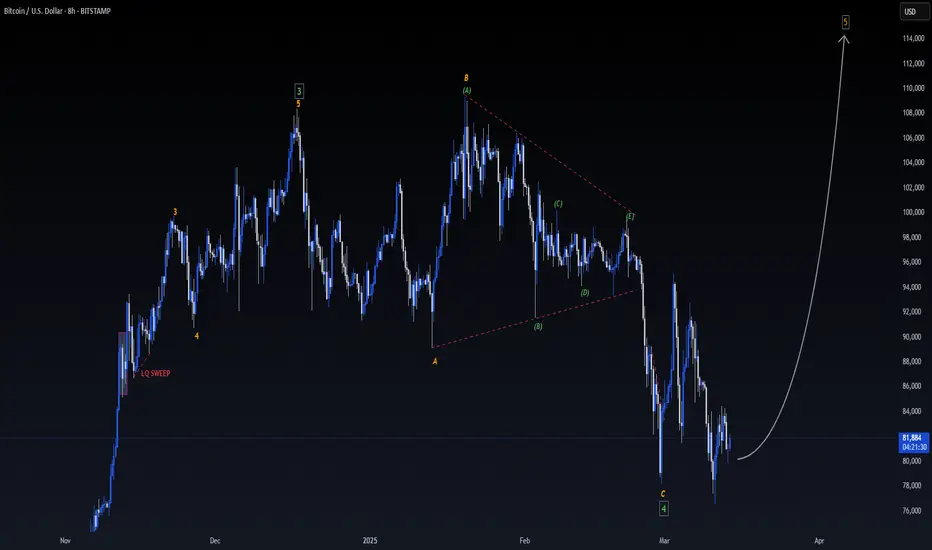
BITCOIN BULLISH TO $116?!After a redistribution phase where late buyers got wrecked at the top the market, we've seen price drop back down liquidating multi-billions in buy orders in the past few weeks. I believe this Wave 4 shakeout will now be followed by another bull run.
Hedera Goes From April Highs, To ATH, To Elliot Wave Theory? Lets break down what COINBASE:HBARUSD may be setting up for a long-term scenario!
We saw a impressive Bullish Rally from beginning of November 2024 that facilitated a Breakout of the April 2024 High @ .1842 to then create its All Time High @ .4010.
With this Price Action going from a Significant Low to create a new Higher High, we can apply the Elliot Wave Theory which is first supported by seeing some sort of Fibonacci Retracement from the Low to New High and we see that February of 2025 delivered a Fibonacci Retracement to the Golden Ratio Zone twice to now be showing support from Bulls pushing price higher!
Technically, with Wave 1 having been corrected successfully by Wave 2, both being completed, we now can expect price to give us another extension starting Wave 3, giving us a Break of the ATH created by Wave 1, to then confirm our directional bias and validate the Elliot Wave Theory.
Based on the Fibonacci Extension, we can project a potential "Roadmap" price may follow while outlining the rest of the Impulse and Corrective Waves where we see Price ultimately ending Wave 5 at the Potential Range Target of ( .7571 - .89441 )
Rules:
- The 2nd Wave cannot retrace the 1st Wave more than 100%
- The 3rd Wave can never be the shortest of the Impulse Waves ( 1,3,5 )
- The 4th Wave cannot retrace the 3rd Wave more than 100%

(xlm) STELLAR "LOOP"This chart looks like there is no real volume and only someone very rich controlling the price of XLM. If I missed the top to sell and the price of XLM never went higher than previous ATH the price of most cryptocurrency is what would otherwise be stuck in a loop with very little interest from real investors. How is it possible for the chart to be like this?

Gold 1H Intra-Day Chart 09.03.2025Option 1: Gold pushes higher from CMP, towards a new ATH of $2,960.
Option 2: Gold drops lower towards $2,880 for liquidity before it bounces back up again to the upside.
Which option do you agree with more?

Breaking: $ONDO Tanks 13% Today- What Next? Standing as a beacon in the realm of decentralized finance Ondo (ONDO) aiming to democratize access to institutional-grade financial services. Founded in 2022 and based in the Cayman Islands, Ondo operates through a unique ecosystem that bridges traditional finance with blockchain technology. The Ondo Foundation collaborates closely with Ondo Finance, its commercial partner, to support decentralized protocols and the tokenization of real-world assets.
Earlier today, the native token CRYPTOCAP:ONDO tanked 13% placing the coin on the cusp of a selling spree. However, CRYPTOCAP:ONDO faded a breakdown in the $0.866 pivot- a pivot that turned out to be the support point. If Selling pressure should increase, a break below the $0.866 point for CRYPTOCAP:ONDO would pose a serious threat for CRYPTOCAP:ONDO as the RSI is already weak at 41.82.
As indicated by the chart, a break above the $1.27 pivot could send CRYPTOCAP:ONDO on a bullish voyage with a breakout above the 1-month high as confirmation.
Ondo Price Live Data
The live Ondo price today is $0.973556 USD with a 24-hour trading volume of $462,035,194 USD. Ondo is down 13.67% in the last 24 hours, with a live market cap of $3,075,569,399 USD. It has a circulating supply of 3,159,107,529 ONDO coins and the max. supply is not available.

CAC40 rejecting ATHThe CAC 40 is rejecting its all-time high at 8,273. If this is confirmed, a correction can be expected, with the first target being the gap closure (blue rectangle) and 8,014.

GLM/USDT THE BEST COIN FOR 270% POWER ATH INCREASEGLM/USDT IS THE BEST COIN FOR 270% POWER ATH INCREASE
There are more coins on the coinmarketcap, GLM l looks depending on our study the best coin for 270% BREAK And new ATH listing 2025
There is a high volume from KRW, and already 2 whales first entries made.
Let's see what the time can bring.

Gold NEW ATH to $2,954?! (1H UPDATE)Gold on the 4H TF is within its final Wave 5 bullish move, there’s no arguing with that. The only thing to debate is how high can Wave 5 push up before reversing?
While it’s possible that Wave 5 has now peaked at $2,942 & ready for a major correction, on the 1H TF I see a small possibly of it creating a new ATH toward $2,954. HIGH RISK TRADE.
Confluences👇🏻
⭕️Distribution Schematic Taking Place Between Wave 3 High, Wave 4 Low & Wave 5 High.
⭕️Wave E Rejected From Psychological Number Of $2,940 (LQ Trap).
⭕️No Strong Sell Off Yet To Indicate A Reversal Has Started.

Gold NEW ATH to $2,954?! (1H UPDATE)Gold’s absolutely rocketing today, so far running 430 PIPS in profit. We’re not too far from our TP!
However, I’d like to see some retracement back down towards $2,917 - $2,913 before hitting our TP. There’s a chance that Gold might be creating a complex 5 Sub-Wave (A,B,C,D,E) triangle. If this complex triangle wave shapes up, it’ll give us the opportunity to enter ANOTHER buy position🚀

XAU/USD Curved Channel Analysis – Another Leg Up?Price usually moves within a channel, but in many cases, this channel is not a traditional straight-line channel; instead, it follows a curved structure.
Considering the recent bullish move and the fact that the ascending channel remains intact, the price will likely experience another upward wave, at least toward the previous ATH.

$LISTA Surge 83% Amidst Anticipation of Token Unlock March, 2025Lista DAO ($LISTA)s recent price surge of 83% has put it firmly in a spotlight. Built on the Binance Smart Chain (BSC), Lista DAO is a decentralized stablecoin lending protocol that leverages liquid staking derivatives (LSDfi) to offer users a unique blend of staking, borrowing, and yield-earning opportunities. As the project gears up for a significant token unlock in March 2025, let’s explore the technical and fundamental factors driving this impressive rally.
Overview of Lista DAO
1. Innovative Stablecoin Lending Protocol
Lista DAO is not just another DeFi project; it’s a robust ecosystem designed to provide decentralized financial services with a focus on stability and yield generation. At its core, Lista DAO offers two primary products:
- lisUSD: A decentralized stablecoin pegged to the USD and fully over-collateralized by crypto assets like BNB, ETH, slisBNB, and wBETH. In its initial phase, lisUSD adopts the proven MakerDAO model, ensuring stability and decentralization. By Q2 2024, Lista plans to transition to Liquity’s codebase, further enhancing its efficiency and scalability on both Ethereum and BSC.
- slisBNB: A liquid staking token for BNB that allows users to earn staking rewards while maintaining liquidity. slisBNB appreciates in value relative to BNB based on its staking APR, enabling users to participate in DeFi activities across multiple platforms while passively earning staking yields.
2. Utility of the LISTA Token
The LISTA token is the lifeblood of the Lista DAO ecosystem, serving multiple critical functions:
- Governance: LISTA holders can participate in protocol governance, voting on key decisions that shape the future of the platform.
- Incentivization: Users are rewarded with LISTA tokens for borrowing lisUSD, providing liquidity, or participating in liquidity farming.
- Voting Gauge: By locking LISTA tokens as veLISTA, users can vote on collateral types and liquidity pools, influencing emission rates and earning additional rewards.
- Revenue Sharing: veLISTA holders are eligible for a share of the protocol’s revenue, creating a sustainable incentive model for long-term participation.
3. Strategic Token Distribution
With a total supply of 1 billion LISTA tokens, the distribution is carefully allocated to ensure balanced growth and community involvement:
- 19% to Private Sale Investors and Advisors
- 10% to Airdrops
- 9.5% to the Ecosystem
- 10% to Binance Launchpool
- 3.5% to the Team
- 8% to DAO Reserve
- 40% to the Community
This distribution ensures that the majority of tokens are in the hands of the community, fostering decentralization and long-term alignment of interests.
The Technical Case for LISTA’s Surge
LISTA’s recent 83% surge can be attributed to a combination of bullish market sentiment and anticipation of the token unlock in March 2025. The altcoin has shown remarkable resilience, consolidating after its initial surge with an RSI (Relative Strength Index) of 50, indicating a balanced market without overbought or oversold conditions.
Key Support and Resistance Levels
From a technical analysis perspective, LISTA’s price action reveals critical levels to watch:
- Support: The 61.8% Fibonacci retracement level acts as immediate support in case of a downtick. This level is crucial for maintaining bullish momentum.
- Resistance: A break above the 1-month high could trigger a second leg up, potentially propelling LISTA to new highs.
3. Trading Volume and Market Cap
LISTA’s 24-hour trading volume of $227 million and a market cap of $48.7 million underscore its growing popularity. With a circulating supply of 186 million tokens and a max supply of 1 billion, LISTA has significant room for growth as more tokens enter circulation and the ecosystem expands.
What’s Next for Lista DAO?
The upcoming token unlock in March 2025 is a pivotal event for Lista DAO. While token unlocks often lead to increased selling pressure, the strong fundamentals and utility of LISTA could mitigate this effect. Additionally, the transition to Liquity’s codebase in Q2 2024 is expected to enhance the protocol’s efficiency and scalability, further solidifying its position in the DeFi landscape.

CART ATHCART has just made a new ATH today, however, volume was not present.
Ideally we want to see this price holding and volume coming in for a push higher

After Losing About 65% of Value Is There Hope for $BERA?The cryptocurrency market is no stranger to volatility, and BIST:BERA , the native token of the newly launched Berachain blockchain, is a prime example. After reaching an all-time high of $15, BIST:BERA has plummeted by 65%, currently trading at around $5.37. Despite this steep decline, the token is showing signs of resilience, with a 4.68% gain in recent trading and a strong Relative Strength Index (RSI) of 54. This raises the question: Is there still hope for BIST:BERA , or is this just a temporary reprieve before further downside?
What is Berachain?
Berachain is an EVM-compatible Layer 1 blockchain that introduces a novel consensus mechanism called Proof of Liquidity (PoL). Unlike traditional Proof of Stake (PoS) systems, PoL aligns network security with liquidity provision, creating a unique incentive structure for participants. This approach aims to address some of the key challenges in decentralized finance (DeFi), such as liquidity fragmentation and inefficient capital allocation.
Two-Token Model
Berachain operates on a dual-token system:
- BIST:BERA : The gas and staking token used for transactions and securing the network.
- NYSE:BGT : A non-transferable governance and rewards token designed to incentivize long-term participation and alignment with the network’s goals.
This model is designed to foster sustainable growth and reduce speculative trading, which could benefit BIST:BERA in the long run.
Market Performance and Sentiment
Despite its recent price drop, BIST:BERA has a live market cap of $576 million and ranks #112 on CoinMarketCap. The token’s 24-hour trading volume of $432 million indicates significant interest and liquidity. However, the initial sell-off was largely driven by airdrop participants cashing out their tokens, a common occurrence in new crypto projects. This suggests that the dip may be more about short-term profit-taking than a reflection of the project’s fundamentals.
Technical Analysis
BIST:BERA is currently forming a falling wedge pattern on the charts, which is typically a bullish reversal signal. This pattern occurs when the price consolidates between two converging downward-sloping trendlines, indicating that selling pressure is weakening. A breakout above the upper trendline could signal the start of a new upward trend.
RSI Holding Strong
The token’s RSI is at 54, which is in neutral territory but leaning toward bullish momentum. This suggests that BIST:BERA is not overbought or oversold, leaving room for further price appreciation if buying pressure increases.
Key Support and Resistance Levels
- Support: The $1 mark is a critical psychological and technical support level. If the price falls further, this level could act as a strong floor.
- Resistance: The immediate resistance lies near the $6-$7 range. A breakout above this level could pave the way for a retest of higher prices.
Why is BIST:BERA Showing Resilience?
1. Innovative Technology: Berachain’s Proof of Liquidity (PoL) mechanism and two-token model are unique value propositions that could attract developers and users to the ecosystem.
2. Strong Community Interest: Despite the sell-off, the project has maintained a high trading volume, indicating ongoing interest from traders and investors.
3. Market Positioning: As an EVM-compatible blockchain, Berachain is well-positioned to tap into the growing demand for scalable and efficient Layer 1 solutions.
Risks and Challenges
- Volatility: As a new token, BIST:BERA is highly susceptible to market swings and speculative trading.
- Competition: The Layer 1 blockchain space is crowded, with established players like Ethereum, Solana, and Avalanche dominating the market.
- Adoption: The success of BIST:BERA will depend on Berachain’s ability to attract developers and users to its ecosystem.
Conclusion
While BIST:BERA has lost 65% of its value since its all-time high, the token is showing signs of stabilization and potential recovery. The innovative Proof of Liquidity mechanism, combined with a strong technical setup (falling wedge pattern and neutral RSI), suggests that BIST:BERA could be poised for a rebound. However, investors should remain cautious, as the token’s price action will largely depend on broader market conditions and Berachain’s ability to deliver on its promises.
For risk-tolerant investors, BIST:BERA represents a high-potential opportunity in the evolving blockchain space. Keep an eye on key support and resistance levels, and watch for developments in the Berachain ecosystem that could drive long-term value.

NVIDIA Update Trade the Range
Update from the previous video entitled *The next long to take . If the position was taken then you should be +20% as it stands . Currently approaching a key area for some resistance . Earnings in 16 days and i highlight the range I expect us to stay inside of until the news release

Trading opportunity for ATHUSDTBased on technical factors there is a Buy position in :
📊 ATHUSDT
🔵 Buy Now
🪫Stop loss 0.03400
🔋Target 0.04650
📏 R/R 2
💸RISK : 1%
We hope it is profitable for you ❤️
Please support our activity with your likes👍 and comments📝

Gold NEW ATH to $2,912?! (1H UPDATE)ABSOLUTELY BEAUTIFUL move on Gold overnight! Price has pumped up from our supply zone & so far running 370 PIPS in profit. Close to hitting ATH of $2,900🔥
Called this live, so you should all be in this trade & in profit!

Gold NEW ATH to $2,912?! (1H UPDATE)4H chart has hit our resistance zone & rejected. But, on the smaller TF we're currently seeing a re-distribution schematic play out on Gold ahead of its sell off which means we MIGHT see 1 more new ATH. Re-distribution schematics normally take place in between Wave 3 high, Wave 4 low & Wave 5 high.
This sell off schematic normally builds up within a 'Flat Correction' channel, which traps in early sellers & late buyers into the market. This is why it's a hard pattern to recognise.
⭕️POI 1: $2,857 - $2,848
⭕️POI 2: $2,826 - $2,817

Breaking: $BERA dips -50% Just A Day After Listing. The cryptocurrency market is no stranger to volatility, and the recent performance of BIST:BERA , the native token of Berachain, is a testament to this. Launched just yesterday, BIST:BERA has already experienced a whirlwind of price action, capturing the attention of traders and investors alike. After an initial surge of 650%, the token has since dipped by 50%, currently trading at $7 per coin. This dramatic price movement has left many wondering: Is this a temporary shakeout or a sign of deeper issues?
Technical Analysis
From a technical perspective, BIST:BERA ’s price action is forming a symmetrical triangle pattern on its daily chart. This pattern is typically a continuation signal, suggesting that the asset is consolidating before making its next significant move. The key levels to watch are the upper resistance (ceiling) and the lower support (floor) of the triangle.
- Bullish Scenario: If BIST:BERA breaks above the triangle’s ceiling, it could trigger a bullish run with an estimated upside potential of 107%. This would likely attract fresh buying interest, pushing the price toward new highs.
- Bearish Scenario: Conversely, if the price fails to break out and instead falls below the triangle’s support level, BIST:BERA could test the $5 support zone. This scenario would likely be driven by profit-taking from early investors and airdrop participants.
The current price dip of 28.06% in the last 24 hours may seem alarming, but it could also be a healthy correction after the initial euphoria. The symmetrical triangle pattern suggests that the market is undecided, and the next major move will depend on whether buyers or sellers gain control.
Berachain’s Innovative Approach to Blockchain
Beyond the price action, BIST:BERA ’s underlying technology and ecosystem are worth examining. Berachain is not just another Layer 1 blockchain; it introduces several innovative features that set it apart from its competitors.
1. Proof of Liquidity (PoL): A Novel Consensus Mechanism
Berachain’s Proof of Liquidity (PoL) is a groundbreaking consensus mechanism that aligns network security with liquidity provision. Unlike traditional Proof of Work (PoW) or Proof of Stake (PoS) systems, PoL incentivizes users to provide liquidity to the network, ensuring a more robust and efficient ecosystem.
2. EVM Compatibility and Modular Design
Berachain is fully compatible with the Ethereum Virtual Machine (EVM), making it an attractive option for developers looking to build or migrate decentralized applications (dApps). Its modular design allows for the creation of customized Layer 1 blockchains without sacrificing interoperability or performance.
3. Two-Token Model: BERA and BGT
Berachain operates on a unique two-token model:
- BERA: Used for gas fees and staking, BERA is the utility token that powers the network.
- BGT: A non-transferable governance and rewards token, BGT aligns the interests of network participants by incentivizing long-term engagement.
Market Sentiment and Exchange Listings
The current market cap of $806 million and a circulating supply of 107.48 million BERA coins indicate that the token is still in its early stages. With a max supply yet to be determined, BIST:BERA has room for growth as the ecosystem matures and adoption increases.
Conclusion
While the 50% dip may deter some investors, the technical and fundamental factors suggest that this could be a buying opportunity for those with a higher risk tolerance.
As always, it’s crucial to conduct thorough research and consider your risk appetite before investing in any cryptocurrency. BIST:BERA ’s journey is just beginning, and its future will depend on both market dynamics and the team’s ability to deliver on its ambitious vision. Whether you’re a trader or a hodler, BIST:BERA is undoubtedly a coin to watch in the coming weeks and months.

SOL 4H RANGESOLANA is down -40% from making a new ATH to the bottom of the crash wick @ $175. Looking at the chart, unless BTC decides to gap down again from a TA standpoint SOL looks good here.
A triple tap of the bottom with a reclaim of the bullish orderblock that coincides with the golden pocket zone from local LTF high to low, followed by a strong reaction from that zone. Q1 is historically good for altcoins and so the all of these points added together the R:R at this level is good IMO.
Profit taking through the range quarters.
The idea is invalid once price accepts below the triple tap bottom under $170.

TOTAL DAILY The flash crash of Monday took TOTAL all the way down under the previous cycles high and tapped the 1D 200 EMA before reacting well to move price between the DAILY RESISTANCE & SUPPORT.
For me I still think crypto has space to grow, seasonality tells us the first quarter of a bullrun year is great in terms of returns with a tail off in Q2-3, coupled with the US administration being pro crypto and the looming strategic reserve getting closer, ETFs relentlessly buying Bitcoin, same with MicroStrategy.
The two entry options for me are when the wick gets filled and a reclaims the '21 ATH once again, that would sweep the demand zone and take out a lot of stop losses before targeting the DAILY RESISTANCE and the HIGHS.
Another entry would have to be a reclaim of the DAILY RESISTANCE, I would be worried that the wick still needs filling but maybe it would be during the bear market. For that reason a close SL would be useful.

Bitcoin Down: Tariffs to Blame?I wake up to read that both equities are Bitcoin are down on Tariffs as the "reason." Is this true? More importantly, is knowing this valuable? I don't think so.
The media needs to write some narrative every day to get read and sell ads. So they take the latest buzz and craft it into a "reason" price moved the way it did. The trouble is that this information is is useless for traders and investors. Once the article is written the move has happened. There is nothing to profit nor more importantly LEARN from having this knowledge. It is a singular event; no long term consistent strategy can be crafted from a single thing happening once.
Bitcoin was already breaking down since January 20th. That day failed a big test of the prior All Time High. INDEX:BTCUSD has actually never closed higher than December 17th.
To emphasize the point more if one looks at the mainstream financial news they are also blaming today's equities route on tariffs. The truth is that stocks only seemed to have a bullish January. The S&P 500 futures never actually made a new high beyond the post-election pump in January.
Traders have to make plays BEFORE the news happens. The only way to do that is by watching charts for opportunities and reading the simple signs. Trade wisely!
