Archer Daniels (ADM) consolidation to breakoutADM has been going through strong bull runs, consolidations and then continuation from the consolidation back up.
This looks like another set up for a continuation up. The market has run up, in part perhaps due to the commodity price increases and is now consolidating, perhaps as commodities cool off or maybe just old fashioned profit taking at a new high.
Typically these consolidations should continue up, however with commodities taking a breath there are forces at play beyond the stock itself so I'd wait for a breakout rather than jump in during the consolidation in case the move breaks down.
Then consider the exit of the flag and distance to the ATH (orange line) and potential resistance in between when choosing an entry.
ATH

XRP ATH Test incGood day, Traders. Im seeing a back-test of support for XRP before testing ATH. Just wanted to put that out there, looking super bull, chart & RSI. Wait for it.
Let me know what you think below, & please leave a like if you agree cheers.

According to the last 2 cycles, the bigger dip is to happen..nowThe last 2 cycles had ATH's in the first week of December; however, the way they got there was very different from each other. According to the halvings that followed each cycle, we reached ATL 546 days and 518 days in the last 2 cycles, and each cycle took 364 and 413 days to reach that ATL from the blowofftop ATH's. That would put our projection for an ATH of BTC around Oct/November. That means we're 5 to 6 months out from our ATH...
Hey, would you look at that, 5 to 6 months out from the ATH's of the last 2 cycles were massive dips.
Wonder what this could mean for us this cycle? Hmmmmmmmmmmmmmmmmmmmmmmmmmmmm


BTC is playing this pattern. 20-30k to 144k by EOYWyckoff distribution being played candle by candle.
It's like sorcery, the price action is following Wyckoff distribution.
So BTC may hit a 20-30k as lowest low being 64k a top in the MID term. BTC may do another final top as high as 144k by November 2021; repeating somehow 2013 cycle.
On the other hand this cycle may be prolonged to as far as mid 2022 extending the top cycle which would follow Stock2flow model (higher extended wyckoff distributions-accumulations and diminished maximus returns).
I don't expect bear market or an insane bounce from current price to a new ATH soon.
Most probably scenario is we're near the end of wyckoff distribution and about to enter a final second wyckoff accumulation.
So 144k ATH 2021 EOY or MID 2022. 64k should be a mid term top.
- - - -
This will follow also 12345 ELLIOT wave count after ABC correction being C (20-30K).
NFA.

BTC Classics: down from a falling wedgeDown from a falling wedge which was mostly considered as bullish formation.
Who is old enough at the Crypto market, they have seen this anti-pattern many times.
You shall forget traditional patterns! Never trust trading books of the past and not be a silly hamster listening to the news. This market is unique. This time of history is special.

ETH Buy now Expecting new ATHI’m very bullish with ETH right now, it Retrace perfectly to my 50% Fibonacci
Not financial advise

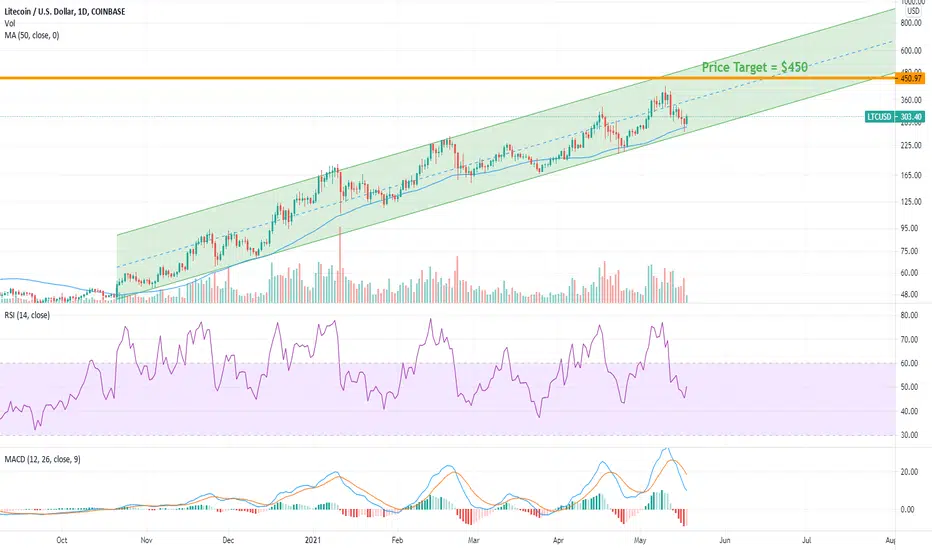
LTC back on the upswing to a new ATHIt has been a rocky week for LTC as it has moved down a good 30% from reaching its ATH. This is to be expected though in the crypto markets and nothing to really worry about considering we are still in a bull market.
LTC has been trading inside a nice upward moving channel since October of last year all while mostly staying above the 50 day MA. The RSI has been making higher lows and the volume has been, on average, a lot higher since the end of March. Barring some FUD Elon tweets that could cause a temporary price dip, or a major BTC move, I see don't see a lot of reasons that LTC will not continue to rise based on the cart.
I would like to see the MACD cross above the signal line on the daily chart. This is really the only bearish sign on this chart. Perhaps even this is going to change soon because, at the time of writing, the histogram seems to have turned towards increasing.
This might not be the fasted play ever, but I think it is reasonable to say that LTC will be above its old ATH and at $450 in the next couple of weeks.
_______________________________________________________
Thank you for reading, please like, follow, and comment! And don't forget to checkout my indicator guides below. More coming soon!
Trade at your own risk.
BTC new ATH, Double top, or unable to break previous high?Publishing this idea so I can clean up my chart and refer back to this.
PURPLE BOX - MY CURRENT RANGE OF INTEREST
* If 03/05 daily closes above 58000 and we can't close above 61200 level, I will be shorting as 64899 was the high.
* If we close above that level and continue through 65000, I will be looking to short 68000-70000 but if we get FOMO I will move up to 74000-75000.
* Any higher will close and wait to short retest as I expect a drop to 40000 at least

matic ... it will grow soon !Considering the previous ceiling, higher targets are not far from the mind ... Fundamental news has also come for this currency, which I think will have a very good effect.

Solana reaches a new All Time HighSolana spiked above $52 today, following network growth due to investors seeking a cheaper alternative to Ethereum.
The coin has since fallen back to $46.
----------
Coin Metrics:
The 200 Simple Moving Average (SMA) is at: $13.0.
The percentage distance from the latest SOL price and the 200 SMA is: 254.0%.
A coin with a percentage distance greater than 100% can be considered to be overbought, and might see a correction in the near future. Note however, that coins can remain very far from their 200 SMA during extended bull runs.
Average Candle Height (ACH) for SOL: 12.9%.
Average Candle Height is calculated as the average height of all candles (high - low) as a percentage of the high price. Bitcoin typically has about 5% ACH, while large marketcap coins like Litecoin have around 8% ACH. Exceptionally volatile coins like 1INCH can have 15% ACH or more.
The number of 1d candles measured in this calculation were: 279.
----------
Please like and follow if you'd like to see more of my content :)

SUSHI on the way to $23Since the end of April SUSHI has been trending up after it crossed back above the Bull-Market Support Band. SUSHI has consistently made higher highs and higher lows. However, it is currently bumping up against a zone that it has been rejected at many times before. Even in the time when SHSHI crossed over it failed to make the old resistance into support. If it breaks above again will this time be different?
Last time SUSHI fell below the area of resistance was the exact time that BTC went from 60k down to 50k. Everything else was pretty much the same; SUSHI was in an uptrend, the RSI was making higher lows, etc.
So, it seems that SUSHI is not one of those rare coins that moves independently from BTC. Therefore, as long as BTC holds, or moves up, the conditions to put SUSHI back to at least $20, and probably $23 exist.
I don't think $17 is the best entry as it looks over extended in the very short term. If it falls between $15-16 I am getting in on the move back up.
Thank you for reading and please like, comment, and follow!
Trade at your own risk.

1inch is showing an hhhl construction!!1inch is showing an hhhl construction. we also have some good potentials because of the fundamentals. the new wallet that they launched could be make some momentum. so I say lets go for the ath🚀🚀🚀🚀🚀

BTC/USDT ATH?Hi Guys!
Here is my view now, as you can see btc has potential to fall a bit more (pennant created a good accumulation ) and then it will meet support. So Bullish market will be created (as descending wedge could probably appear )
70k seems to me a good goal ;)
Have a nice trading!

ONT/USDT Update: 150% bagged. Last resistance already testedWe look at ONT since Feb 2021 where we started this parabolic recovery.
150% is already reached and we did bag some partial profit.
The last resistance arounf 2.6$ was now tested and we did fail to break it the first time which is not unusual at all.
The more often we test this reistance line the more likely it becomes that we can break it.
After this resistance we aim for a new ATH >6$.
Take a look at the volume increase, it is just beautiful.
Basic rules:
- Never buy the top/ATH
- Take profit as long as you can (also partial profit is profit)
- Use Stop/loss for leveraged positions
- If you are not experienced, don't leverage in the first place
Enjoy the ride and don't be too greedy.
If you like the content, please like, comment and give this channel a follow.
We would love it if you could share your thoughts in the comments.
Discussions are very welcome here.
Always do your own research and keep in mind that my charts and comments cannot be considered financial advice.
Cheers
ps.
Chart explanation:
Main lines:
- Green lines are tested support lines.
- Orange lines are resistance lines or, if we are above, possible support lines which were not tested yet.
- Cyan line is for volume trendline.
- White lines are Fibonacci retracement levels
Helplines:
- Purple lines are trendlines we take a look at.
- Yellow lines are for visual help only.
Boxes:
- Either entry zone or support zone. Check the description.

Big Bounce incoming for BTC! Possibly imminent for new ATH!! I'm very bullish on BTC! BTC hit support which defended against the bears. Bears are no more. If we look at the Elliot wave we can see there is a possibility for a new ATH. First we need to break the resistance at 60k. If this happens its almost certain that we can also expect a'n alt season!
Buy range: 48k-52k
Target 1: 52k
target 2: 56k
Target 3: 60k
Long: 70K
Guys I'm very positive on BTC. Share your own ideas and thoughts below. If you have any questions about the graph i see them below.
The Mystic Chao - 90% accuracy.
This is not financial advice. Just friendly advice.

OMG vs ETHas I expected, the price of ETH reached 4400.
I expected it, I did the math to "calculate" it.
it is in my idea related linked below this one, check it out.
about this one...
IMO OMG could reach 80 USD.
so, If you DO NOT know what to do or expect from ETH now, you should consider checking all the other ideas I had about cryptos and consider switching to one of them that haven't yet seen the rise to +200% from their ATH in 2017
i CAN NOT assure you specifically this one will reach 80, neither it will stay on the green channel, neither holding this when seeing -40% (it could, it's crypto volatility :D), tho, as I said in a previous analysis,
i have put the STOP LOSS AT 6.5 USD (considering my entry point at 11 USD, its almost -50%)
in the end, trade, do it, but with something you can afford to lose.
AND... pls: use stop loss. in the crypto's world prices can rocket down as fast as they rocket up.

BTC hit Strong Support! Will hit ATH high soon 70-80k! BTC has done something incredibly. It hit the support at 47k and bounced right back to 50k where it finds a very strong support. We have seen this pattern before. It has ended the head and shoulders pattern. After every dip it hit a new ATH. i am expecting a highway to 58-60k then bounce back to 55k after that it will hit the ATH!
Buy range: 48k-52k
Sell position: 70-80k
This is a great time for BTC. im very bullish at the moment. Share your ideas and thought below. If you have any question i will answer it.
The Mystic Chao


Litecoin retracement incoming?Based on history, whenever LTC is near to its ascending wedge resistance, it will retrace at least 35% to 39%. Right now LTC has touched the ascending resistance and I expect a retracement to around $250 is right around the corner. Previous RSI also indicates that it has touched the retracement signal region to further validate the incoming retracement.
After the retracement, I expect LTC to break its all time high.
Not financial advice.

BCHUSDTHi guys..
we can see New ATH but now need volume ..
If want to buy position you can Enter after touch fibo 0.38 or after pullback to parallel chanell
if you want to Short position you can wait to close this candle and Enter..
don't forget money management and stop lost..
