ATOM || ATOM USDT || SMC On a Daily TF, ATOM has been quite bullish for sometime, and even though it did tap into a 4H supply zone, it failed to break the structure to the downside, and price bounced back up from the Demand Zone. Expecting the price to break to remain Bullish before tapping into another Supply zone (Refined Zone 14.177 - 15.371 on 4H TF)
ATOM

ATOM analysis
We would like to start with what is obvious, we see that Atom has stopped following the market and Bitcoin, as most cryptocurrencies do. For all the fall of Bitcoin from $25k to $19.5k (-22%), ATOM showed an increase from $12 to $13 and is now trading in the same range as it was 2 weeks ago when the entire market was growing. It is impossible to deny that ATOM goes strictly along the channel where each minimum is higher than the previous one, which is a very strong bullish sign. We believe that there is now a large accumulation of this coin. For long-term buying, We would wait for the exit from the channel down, the collecting of liquidity there and a sharp return to the top, and in this area you can make long-term buys.
Moreover, fundamentally, we are waiting for many interesting announcements:
• September 26-28 — a large-scale Cosmoverse conference, where they announce ATOM 2.0, a security update...
• September 28-29 - SmartCon LINK conference, where they will talk in more detail about staking and new tokenomics.
Conferences are always announcements + insiders that buy token.
What else did we forget to add?

Cosmos Hub (ATOM) - September 3Hello?
Welcome, traders.
By "following", you can always get new information quickly.
Please also click "Like".
Have a good day.
-------------------------------------
(ATOMUSDT 1W Chart)
- The key is whether you can climb to the 15.083 section.
- When the Stoch RSI moves out of the overbought zone, the key is whether it can find support near 9.603.
(1D chart)
Primary resistance: 15.083
Secondary resistance: 20.955-23.269
Support: 6.809-9.603
It is necessary to check whether it is supported near 12.380.
If it does not find support, it is likely to move towards the 9.603 level.
- As the Stoch RSI indicator rose before falling to the oversold section, it can be seen that the bearish force is weak.
However, if it fails to rise in the overbought zone and falls, it means that the upside power is also weak.
This weakening of the overall strength increases the likelihood of a sideways movement, so the area around 12.380 is expected to be an important support and resistance point.
- The 15.083 point is the point of support and resistance drawn on the 1M chart, which is important from a long-term perspective.
------------------------------------------------------------ -------------------------------------------
** All descriptions are for reference only and do not guarantee a profit or loss in investment.
** The MRHAB-T indicator, which is inactive on the chart, contains indicators that indicate support and resistance points.
** Background color of Long/Short-S indicator: RSI oversold and overbought sections
** Background color of CCI-C indicator: When the short-term CCI line is below -100 and above +100, oversold and overbought sections are displayed.
** The OBV indicator was re-created by applying a formula to the DepthHouse Trading indicator, an indicator disclosed by oh92. (Thanks for this.)
(Short-term Stop Loss can be said to be a point where profit and loss can be preserved or additional entry can be made through split trading. It is a short-term investment perspective.)
---------------------------------

Atom. the pastI had put this signal. It was private. And I didn't get it. Follow me and see how I predicted the past of the market on the page and comment


ATOMUSDT: Too weak bulls to break aboveHey traders, in today's trading session we are monitoring ATOMUSDT for a selling opportunity around 13.3 zone, once we will receive any bearish confirmation the trade will be executed.
Trade safe, Joe.
We got a runner!Longed this last night, and added around 6pm today. Price has been running since.
Just as the price finally broke above the 20dma, we see the price working through its S1 pivot point:
Its always great to tag the bottom, and we potentially have just that. Looking at the weekly price action we see something to be very bullish about. Price could rise substantially into the EMA ribbon (which is sloping downward indicating the bearish trend is still in-tact.)
If price breaks above the ema ribbon, we will add a lot of risk. From here, we will open a decent long and enjoy our 5% passive yield .
The short term trend is very bullish, and this can be exhibited on the 4h with bollingers as price hugs 3StdDev:
The slope of the moving average is also sloping ‘up’. Good entry, but keep risk dialed in.
Good luck trading mates.

ATOM | LongIn the daily time frame, an upward trend is evident in the structure of a large downward trend. With caution and a view of small targets, long trades can be taken.
be profitable🤑

ATOM/USDT 1D COSMOS CRYPTOCURRENCIESATOM/USDT 1D BYBIT:ATOMUSDT
price $11.985 bybit perp, bullish for a long to 12.475, take profit on the climb up.
resistance at 12.475, which has been rejected multiple times,(bearish), I would short, with tight stop loss,
combined with being in a rising wedge, channel (bearish) we would need big volume to smash the resistance,
rsi would need to be more oversold in the coming days for me to be bullish, as well increased buy volume.
I am expecting rejection at 12.475, falling to 11.200, then 8.530 at some point in September.
that's my bear case theory. I do like cosmos/atom and am bullish in the long term, I think its a great
project and has many good projects running on it.

short trem#Atom currency analysis time 1H The price is approaching its important market in the time of one hour, and after seeing the appropriate trigger, it is selling. Be sure to keep an eye on it

ATOM/USDT :: Patterns speak ! Believe ?
_Yes, They say take the long position and leave me alone for a while...
ATOM/USDT :::
You Can Buy !
with a risk similar to the fall of the blossom in winter .
Good luck .

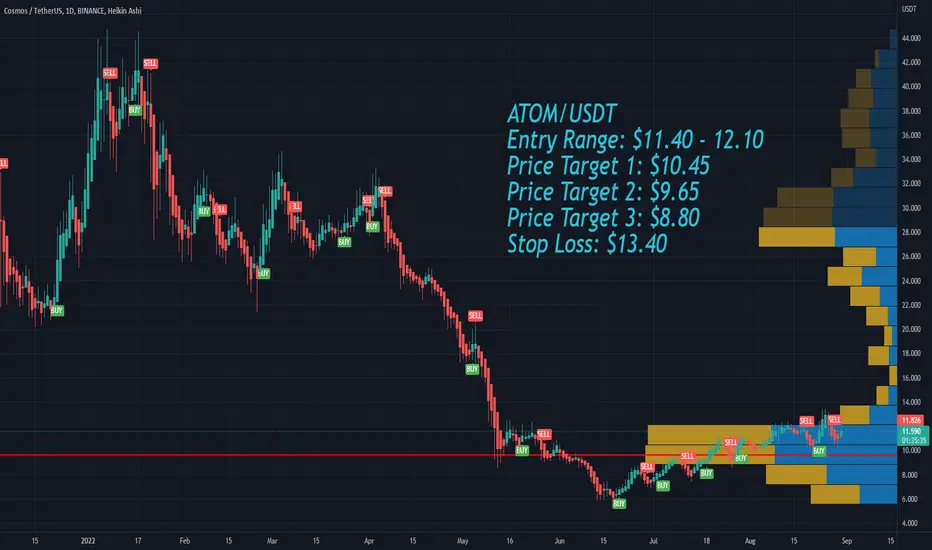
ATOM bearish sentimentSeptember has major catalysts for the crypto market as well as for the stock market.
The Ethereum merge on September 6th, that will end on Sept 20, the inflation report on September 13 and the next FOMC meeting afterwards with the new interest rates hike.
That is reflected in the crypto space in general as a bearish outlook.
ATOM is a cypto with a negative overall sentiment recently.
I have the following price targets:
ATOM/USDT
Entry Range: $11.40 - 12.10
Price Target 1: $10.45
Price Target 2: $9.65
Price Target 3: $8.80
Stop Loss: $13.40
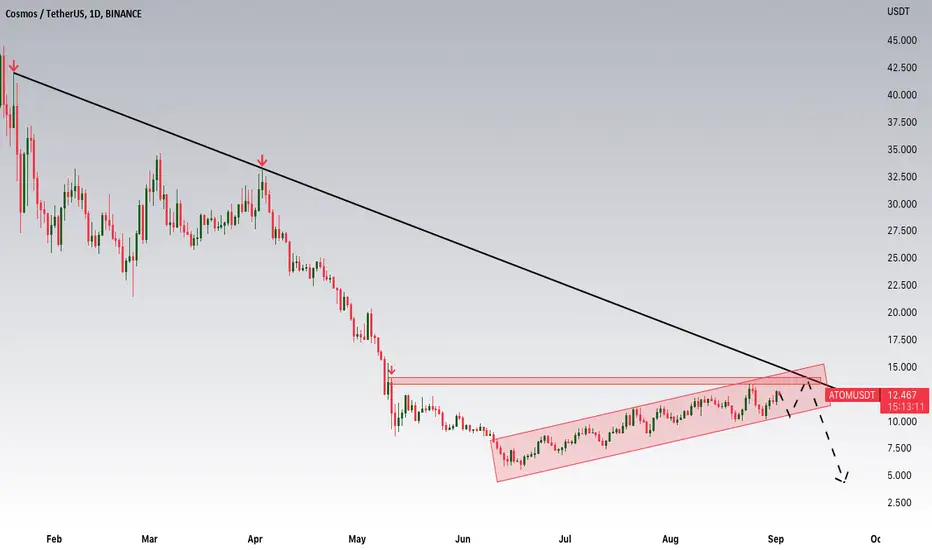
Cosmos longCosmos broke trough the descending trendline. Asset broke trough the resistance level. Bullish movement to resistance level at 13.25 is expected to happen.

Short Atom If falls below $11 we are looking at $10#atom idea if it cannot stay above 11 then we are looking at first target near 10.00-10.20 and then 9.50 area and finally we will see a retest 8.50
Short on #AtomHi Traders,
Seems we have 5th wave completed on this impulsive move. Could be time for some profit taking and the uptrust appears to be stalling around a supply zone. See additional charts below.
BRIEFING Week #35 : Zoom-Out to the Big PictureHere's your weekly update ! Brought to you each weekend with years of track-record history..
Don't forget to hit the like/follow button if you feel like this post deserves it ;)
That's the best way to support me and help pushing this content to other users.
Kindly,
Phil

ATOM - broken supportHello everyone, maybe ATOM has finally decided to take a break, the trendline support has been broken, around 10.80 - 10.90 in my opinion it's a nice short entry.
entry: 10,80 $
target: 6 $
stop: 11,4 $

ATOM - BIG GAINS 💰Atom is almost at the end of its corrective wave. We are now anticipating the 5th wave, which should go below the end of Wave 3, hence why we want price to go below the structure.
Atom is offering one of the best returns. If we buy it at $4 and close at $40 , that's a 1000% return on your investment (atleast).
Trade Idea:
- Watch for price to go below the structure (below $6)
- Once we're there, look for bullish reversal signs such as trendline break, BOS etc.
- Targets: 20, 40, 60, HODL the rest
Goodluck and trade safe!

ATOM | Macro AnalysisHi guys! Please, support this idea and click the Boost button. Thank you!
Let's start with what COSMOS (ATOM) actually is.
Cosmos is a Proof-of-Stake Layer 0 blockchain, that solves the problems of Scalability, Usability, Sovereignty. In a nutshell, it's the base layer for other blockchains.
The Cosmos Network is a decentralised ecosystem of independent blockchains that can scale and connect with one another.
The world's most used framework for building blockchains is Cosmos SDK. Developers have built hundreds of blockchain projects on Cosmos, including BNB, CRO, RUNE, ROSE, OSMOS and many more. So, it's a fundamental, very solid project that have a bright future.
Now let's talk about price.
ATOM had a steady Uptrend from March 2020 to December 2021. This Impulse unfolded in 5 waves (black 1-5).
In February ATOM broke that Multi Year Uptrend and perfectly retested it in April. Rejection there kicked off the impulsive Wave 3 that took us down to $5.5
We're currently in a corrective wave (4) of that impulsive Wave 3. As we see the ‘Sell the Bounce’ Zone was perfectly touched this week. (Would be ideal to get a test of the 0.618 Fib and rejection there).
The last Wave down (5) is yet to get unfolded. I think it will take the price of ATOM to my Buy Zone between $3.5-4.9 (right where we have the 0.618 Fib from the low to high). That's my main buy zone for the Long term.
There's a stinky bid around that 0.786 Fib just in case. Would be sweet to buy ATOM that cheap.
A sneak peek of the Accumulation, New Uptrend & its Target (just my opinion)
I hope you liked my analysis. What do you think about it? Please do share your thoughts in the comments!
If you like the idea, please, hit the Boost button and subscribe to the profile in order not to miss updates
The information given is never financial advice. Always do your own research

If ATOMUSDT lost its trendline? in my opinion if atom lost its trend line it can come down to GP area , before that it have support in 9.5$ zone (0.5 fib), play safe with btc

Bearish Divergence on 1 day ATOMUSDT hey guys this is my idea about atomusdt we can consider this as a pullback to the trend-line which you can see it clearly on the chart and this zone also is a strong resistance and we have a bearish divergence on CCI.
what is your opinion ?

ATOM - Stoploss hunt is coming🚧Shib is awesome candidate for long since:
⭐️ BTC bearish
⭐️ Domination looks bullish
⭐️ We are in the end of formation
⭐️ Spread is getting lower
⭐️ 4th approach
⭐️ Seller appeared
⭐️ Stoplosses are close
⭐️ Volume increases at top
⭐️ 30 ATR
⭐️ Under VWAP
Will enter when price slowly squeezes to the levelon 5m timeframe, the base will form and the tape will get faster.
Fix profit by parts:
1% - 1/3
2% - 1/3, stoploss to breakeven
What's left, hold to the maximum
What do you think of this idea? What is your opinion? Share it in the comments📄🖌
If you like the idea, please give it a like. This is the best "Thank you!" for the author 😊

atom/usdt 4hr 4hr rising wedge or ascending triangle, drops to the downside 68% of the time. Atom showing good strength since 22nd august, if bitcoin holds and rises, atom could hit and flip the 200 day ma, $25+ target is identified
