ATOMBTC

ATOM/USD - first correction then long First correction then long.
Such a schedule is exactly the same as the ATOMBTC schedule, which is consolidated under the level.
the next deal:
buy: 2.13
sell: 2.66
stop loss is set at a level
Friends, thanks for your likes and comments!
Good luck with trading!

ATOM/BTC - After being punctured buyAfter being punctured and anchored above the level
You can buy and hide the stop at the level.
as the likelihood of a fall in the dominance of bitcoin in the market is high, growth prevails over the likelihood of a fall.

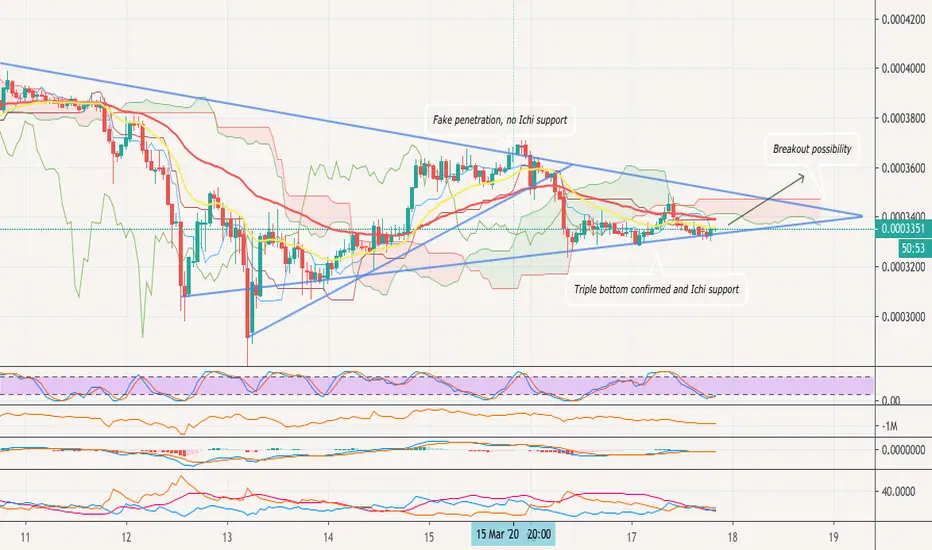
ATOMBTC | Triple bottom and breakout possibilityAt 1H timeframe chart we can see the price action in the Triangle. The first attempt to breakout was made in a local upward movement in a smaller triangle pattern. However there was not enough trade volume and long power support, which is represented by Ichimoku clouds attraction below price action zone on 15th of March.
Currently ATOMBTC formed a triple bottom pattern and accumulated for a bounce, moreover Ichi is now acts like a support and attracts the price action to the higher zone which can result in a massive breakout in the short-term
Entry zone, targets and stop loss are presented in the Premium and Basic channels. You can find Basic channel link in the signature below
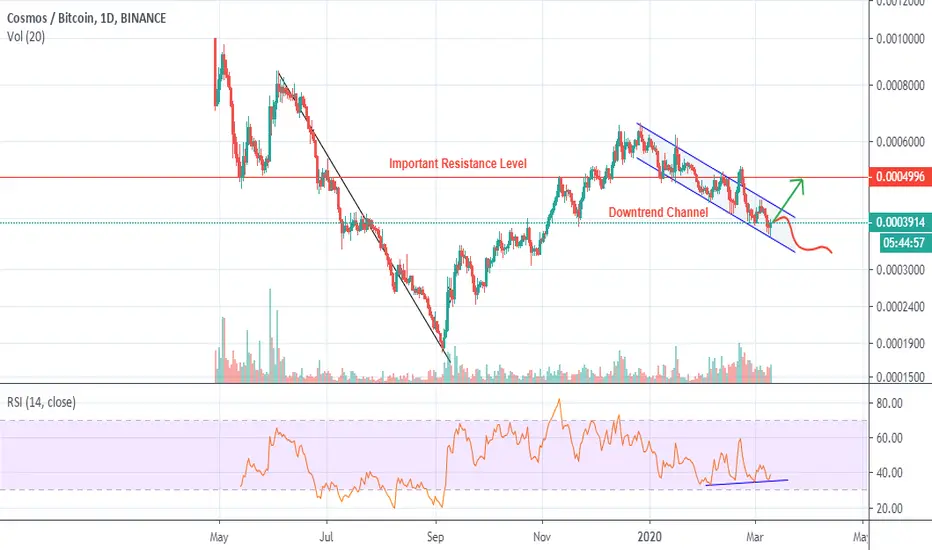
ATOM COSMOS will keep moving down the channel of bullishness. Lot's of hype on this project and no doubt it's with some merit but i think we'll see more of a consolidation in this channel with it finding it's bottom some time in the middle of March around 0.618 Fib retracement level. Thoughts? Obviously, we could breakout very soon and this idea would be forgotten and i will never mention it again.

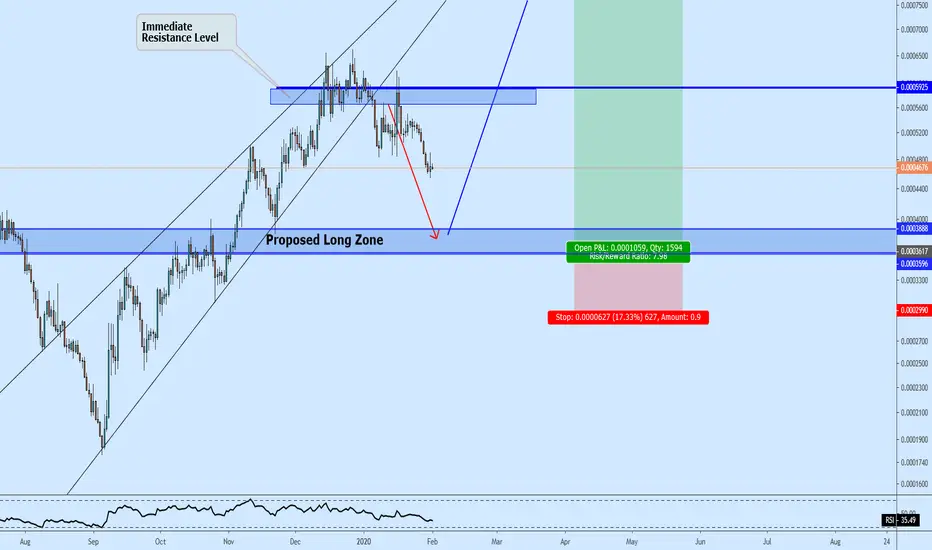
ATOM/BTC very risky trade for low reward.Hello Traders,
ATOM/BTC dont have a profit/loss factor trading,
For us to enter a position we always have a stop loss value, and for that our target has to be at least twice as much as our stop value, that is, for us we enter a position where our stop is at 4% we will want to profit at least 8% in this operation to be worth the risk.
For atom we can see that the only entry point that make sense is above the 0.00045 sats, and we have a very important resistance at 0.00050 sats, that means our stop will be 10% to have a chance to win 10%, so dont worth the risky that is what we call profit loss factor.
Cosmos: Will ATOM-BTC Finally Launch Us into the Cosmos?ATOM-BTC is currently setup for both a daily and weekly TD9 (buy) setup. The Stochastic's bottomed out on the 12hr, 1D, and 1W timeframes.
We shall see if buyers step up this week.
Using a mix of Nick Core's "Alpha Exhaustion" & Tone Vays' "TI Indicators Sequential" indicators.


$ATOM, Bouncing from ~40k sats support...$ATOM
Bouncing from ~40k sats support as it tested lower trendline of the descending channel..
UCTS remaining bearish for now.. OBV & RSI bullish divergences..
Aiming for an entry as close as support as possible, tight SL under local LL (just in case)
#ATOM
////
Managing my stop losses, take profits and trades over 3commas platform for Binance has been a great experience.
I have to do a few clicks and everything is managed automatically by the platform..
Trade for FREE in binance with my referral code:
3commas.io
Thanks
ATOMBTC still in trend line rangeAtomBTC is still in trend line range having support arround 39k if it broken then next fib level is 36.5k would be an ideal buy for long uptrend. let see how now it protect. For me it looks that Bulls are not ready. So retracement can be more. DYOR. Thanks.
AtomBtc Trading ideaAtom price have been moving in a strong rising wedge formation which got breakdown. follow the chart to see how best to trade this setup.
ATOMBTC Elliot Wave count LooksIt looks wave 2 count can be complete on 4610 and then wave 3 start as in Elliot wave count. It looks pretty bullish now. Any suggestion would highly appreciated. DYOR Thanks

Cosmos (ATOMUSDT) short.All description on the chart.
Please, don't forget to like and follow.
Thank you.

COSMOS (ATOM) breakout retes almost complete.COSMOS (ATOM) breakout retest almost complete. After another sweet +6% , comsmos is retesting the breakout. Time to bounce is due!
Good entry point / time to add to positions. ( Risk is still present, don't forget that.)

ATOM bullish divergence and volume increaseWe have noticed a sudden drop in ATOMBTC pair after the recent BTC pump which was expected. What is very promising though and should not scare you is the distinct bullish divergence present on the RSI and the Stochastic RSI. Notice the divergence between the price drop the late days and the increase on the indicators. This in conjunction with the massive volume increase is a clear bullish pattern. I expect a pump during the following week. Stay positive!

@ATOM clear breakout at 5200Massive volume accumulating lately supports a great move potential towards 6000. Huge symmetrical triangle forming the last months must be broken out to establish new ATH. Assuming that ALT season is back and BTC halving will support this I tend more towards breaking out.


Cosmos (ATOMUSDT) short.All description on the chart.
Please, don't forget to like and follow.
Thank you.

ATOMBTC Making Cup & Handle Target 100% profitNeed suggestion about chart Pattern. as on Daily time frame It looks AtomBTC is making Cup & Handle which recently it bottom out and moving upward.
If it is clearly Cup and handle then Handle complete on 63k and then movement should be more 100% from there. Please correct me if I am wrong.
Do like if u get any Info.

BUY ATOM/USDTBUY ATOM/USDT:
ENTRY: 4.840-4.870
STOPLOSS: 3%
BTC IS UNSTABLE, SO YOU SHOULD ALWAYS PUT STOPLOSS

$ATOM, On a descending channel, now pushing up..$ATOM
On a descending channel, now pushing up after a new test of the lower trendline...
Volume is increasing as it crosses over ~4600 sats
Aiming for an entry at support level (R/S flip) w/ target at ~5400 sats (10%+)
UCTS Buy signals starting to appear back on LTFs.
#ATOM
ATOM possible breakout of falling wedge! ATOM possible breakout of falling wedge! Similar volume and strong buying activity just as with ALGO.
If the breakout is successful - a possible 15%+ move is not out of the question. We might have to retest the breakout, but overall ATOM is looking strong.
Be careful and don't go all in as buying at or closely above resistance is not an optimal entry.

ATOM potential end of retracementATOM also making a bounce. Resistance at 5000 and 5200. Pull back entries at 4850 and 4700 (possible wick to ~4550). But 4700 is definitely the strongest support. At day timeframe looks very promising, as price bounced from 0.5 Fibonacci level, and so that could have been the end of retracement.
Targets 5200 - 5500 - 5700
If grow above 5860 (and close day candle above that value, but that is for the next week), than will start a new uptrend with much higher targets.
