#ATOM/USDT#ATOM
The price is moving in a descending triangle on the 12-hour frame, and that triangle has been breached upward
We have a bullish divergence on the RSI indicator
We have stability above the main support level
Entry price 9.52
The first target is 9.80
Second goal 10.18
The third goal is 10.70
ATOMPERP


ATOM long or short?ATOM formed double top near 17.06, the lowest price came to 11.81 (1.382), and then rose back above the trend line.
The circle marked in the figure is a small bear flag formed near the trend line, and then ATOM fell below the trend line again, the price came to 10.91 (1.618), and ATOM appeared a double bottom here.
-
The current price is back to the trend line again. If ATOM closes above the trend line, you can enter the market with long order.
-
ATOM stop loss price: 13.26, 11.81 and 10.91 (selected according to the ability to take risks, the closer the stop loss price is to the entry price, the higher the R/R ratio, but the greater the risk).
Take Profit Price: 16.95
-
If ATOM does not close above the trend line, there is still a chance to reach the double top target at 9.46.
-

Bull Flag on ATOM Until Proven OtherwiseFor me the best time to buy would have been at the 0.886 Retrace Below but i was not looking aware of ATOM being at the .886 at the time. If one wanted to be patient they could wait for ATOM to come back down to the 0.886 level and try to play some sorta Double Bottom but there's a possibility that a significant continuation up happens before it goes back down there so as a bit of an Aggressive Continuation Trade I'll be risking a bit here to try to realize a 60%-80% Gain based off what looks to be a Bull Flag in a Local Uptrend showing some Hidden Bullish Divergence.

ATOM Trade idea if breakWaiting for a mature range to break, will OL if PB on top Fibos, aiming a swing trade. Stop if reintegrate range. Matter of weeks probaly

Opened an Atom Short.Explanation: My Candle Recognition and the Price Action say this trade is good😎

ATOM - showing signs of strengthATOM is the native coin of the COSMOS ecosystem. Mainly used for governance and staking, it is set to gain better value accrual this 2022. Mainly bullish on the coin due to 1) superfluid staking 2) interchain security 3) NFT marketplace 4) airdrops 5) EVMOS launch. Many of which will increase transaction count. Should value accrual be done right this time, alongside the hype with LUNA as the IBC ecosystem, we could be seeing a good increase in value. Technicals wise, we will analyze the possible move based on fibonacci pulled from the swing low in Jun 2021 and Swing high in Sept 2021. You can learn more about how to use the fibonacci retracement tool here . The recent bounce off the 0.382 fib and break of brearish trendline makes ATOM a potentially good trade
Trading plan - 3 scenarios
Very bullish -30%
Currently sitting at a price of $30 on 27/2, this would be the DCA price you have, selling at the 0.786 fib at $36 for repeated 20% gains. The fib was an old resistance which ATOM has retraced constantly from to the 0.618 levels at $30. You could then take profits at ATH at $44, wait for a retrace till $36 again to load up. Upper targets are 36, 44, 67 and 104, with the 1st week of April being the projected end of trading time frame. Levels are possibly visited once volume kicks in and IBC narrative is pushed forth. TLDR - sell on upper fibs, rebuy on fib retracements at lower levels or retest of ATH after it has been broken (some people might not get filled due to front running once ATH is broken)
Conservative bullish - 40%
Quite a normal behaviour based on the timeline of price action we see in ATOM + suspected delay of any of the above stated protocols. Here, we would expect a retracement towards $24 (retest of bearish trendline) to $26 (0.5 fib levels). DCAing at this range or slightly below 0.5 fib level would be key. Constantly selling above 0.618 fib levels ($30) could provide 16-20% gains as well, but remember to rebuy in at 0.618 levels if a new bullish trendline support is formed.. Upper targets are 36 and then ATH at 44 and then possibly 48-55 (10% rule past break of ATH, middle value between 45 and the 1.618 fib extension)
Bearish - 30%
Due to heavy bearish macrofactors. scam weekend pump, or delayed ecosystem launches, selling volume may spike and ATOM may see a retracement back to $21 (lower 0.382 fib) as stoplosses get hit and cascade of sells occur. I would then expect to see a reattempt to break out of the trendline, only to be rejected. If a breakout occurs but brearish stance remains, it would be good to add to the shorts near upper fib lines $26 (0.5 fib levels). TLDR - short on breakdown and then retest of bearish trendline, and also short on retracement to upper fibs. Lower targets are 21.7, 17.1, 16.3
Am generally more bullish due to lower selling volume as well as high selling volume bringing down price lesser. Due to volatile macroeconomics, if you are trading on platforms, be sure that it offers spot and perps like Bybit . it would be better to stay in spot rather than be trading perps/futures to prevent liquidation. Remember to set a stop loss to have a good sleep

ATOM PerpNice retest , looking like a deviation. Next target , liquidity above old highs. Confirm and move stops on LT.

ATOM Long Entry with Huge Buy Pressure !ATOM has done a great job with a huge breakout of the accumulation range with big buying volumes and crossover on the MACD to the upside.
Now, its showing some signs of PULLBACK from the resistance zone @ 28.8
We used fib level 0.618 to define a good LONG ENTRY to catch the retracement wave for a BOUNCE @ 26.351, where the 3 EMAs can also serve as support confluence.
TP can be at the major resistance @ 32.858
SL at 23.36, slightly below the triple EMA 50,100,200 on the 4H

ATOM long setupPrice rejecting major S/R level on the daily and broke out of the descending triangle pattern and rejecting the 1H50EMA + .5 and .382 fib retracement.
Invalidation below the .786 (White line)
Targeting the D20 at least and letting the rest moon

ATOM 2H BUYATOM 2H support is at ~$30.2
Enter 50% here
and try to set some buy orders near the support zone
If ATOM holds above the trendline,
the Take-Profit target would be $33.2, $36.2, and $42.2
Cheers

atom 10\12 update ~someone just brought up atom to me,
and after taking a closer look - it looks phenomenal.
the system i use to trade is calling a daily algorithmic buy signal right here.
easily a 100%+ swing~
wave 5 target = $65

ATOM looks ready for breakout.ATOM has been consolidating in a range for more than 6 weeks.
Gravity Bridge Testnet will be live soon this month.
Chart is an idea for mid term trade.
Funding rates are high now so hope the entries gets filled and we could see a move up.
Two possible entries are :
20.659
19.856
Take profit at :
24.506 - 25%
26.550 - 25%
37.325 - 50%

ATOM 1H BUYAlso set some Buy orders near the Trendline
Remember no more than 5% of the deposit in one trade
SL: next sell signal

Cosmos Perpetual Futures 4H Chart: Bear/Bull ThesisBEAR:
Currently trading at bottom of ATH channel. We have a support band that has called buyers multiple times (showing candles with long wicks at the bottom resenting buyers showing up and rejecting support price). If candle closes below support band for first time within the channel, price might fill the gap down to previous channel. Further, price might find slight consolidation at new channel before continuing to next channel below, that has previously shown stronger balance between buyers and sellers
BULL:
If current bearish candle finds buyers support and closes above support band, while next candle closes above current candle, we might see the creation of a double bottom pattern that could bring price back to top or middle of current channel.

ATOMUSDATOM ranging in an uptrend channel, long it when breaking up in the top of the channel
targets on the chart

ATOM 1H BUYAlso set some Buy orders near the Trendline
Remember no more than 5% of the deposit in one trade
SL: next sell signal


Short $ATOMUSD Target $3.3This is the first time I have a chart that I am not taking for real trade. I just closed my ETHUSD long trade. I always take a break between each trade.
However, ATOMUSD is on my radar. And I might jump in the short trade if it keeps on going down after 48 hours.

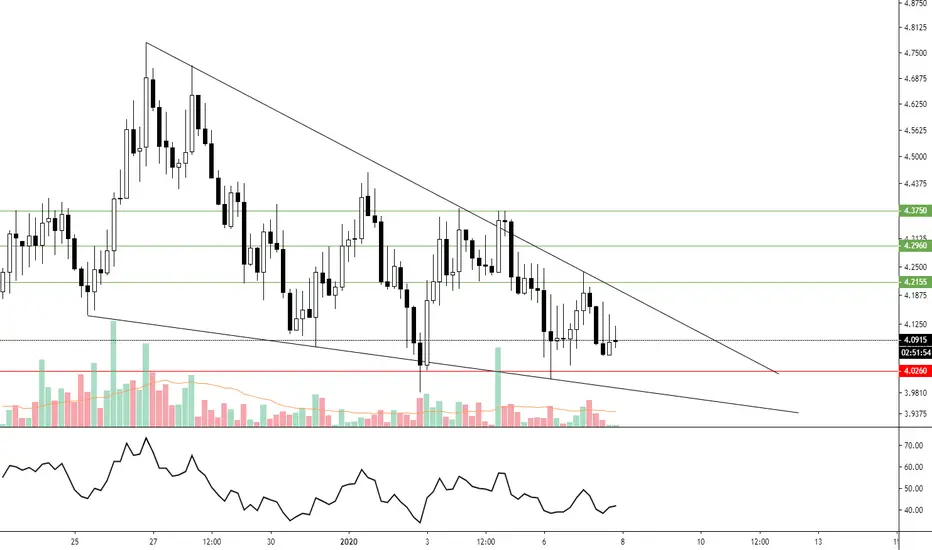
LONG - ATOMPERP - Trading OpportunityATOMPERP:FTX
A beauty of a falling wedge. Volume has settled and looks like bulls are about to step in.
Entry: 4.091
Target 1: 4.2
Target 2: 4.296
Target 2: 4.375
SL: 4.02
CryptoCue is not providing investment advice and is not taking subscribers’ personal circumstances into consideration when discussing investments. Investment involves a high degree of risk and should be considered only by persons who can afford to sustain a loss of their entire position.
CryptoCue is not registered, licensed or authorized to provide investment advice and is simply providing an opinion, which is given without any liability or reliance whatsoever. The information contained here is not an offer or solicitation or recommendation or advice to buy, hold, or sell any security. CryptoCue makes no representation as to the completeness, accuracy or timeliness of the material provided and all information and opinions provided by CryptoCue are subject to change without notice and provided on a non-reliance basis and without acceptance of any liability or responsibility whatsoever or howsoever arising. You hereby irrevocably and unconditionally waive, release and discharge: (a) any and all accrued rights and/or benefits you may have against CryptoCue in respect of any opinion expressed or information conveyed by CryptoCue at any time; (b) any and all Claims you may have against CryptoCue arising out of any opinion expressed or information conveyed by CryptoCue at any time; (c) CryptoCue from all and any claims (whether actual or contingent and whether as an employee, office holder or in any other capacity whatsoever) including, without limitation, Claims you may have against CryptoCue arising out of any opinion expressed or information conveyed by CryptoCue at any time. ("Claims" shall include any action, proceeding, claim, demand, judgment or judgment sum of whatsoever nature or howsoever arising.) You hereby agree to indemnify and hold harmless CryptoCue in respect of any and all Losses paid, discharged, sustained or incurred by CryptoCue in the event of bringing any Claim against CryptoCue. (“Losses” shall include any and all liabilities, costs, expenses, damages, fines, impositions or losses (including but not limited to any direct, indirect or consequential losses, loss of profit, loss of earnings , loss of reputation and all interest, penalties and legal costs (calculated on a full indemnity basis) and all other reasonable professional costs and expenses and any associated value-added tax) of whatsoever nature and/or judgement sums (including interest thereon).)