ATOM/USDT – Long-Term Accumulation Phase Nearing Breakout?📊 Full Technical Breakdown:
🟡 Long-Term Accumulation Zone
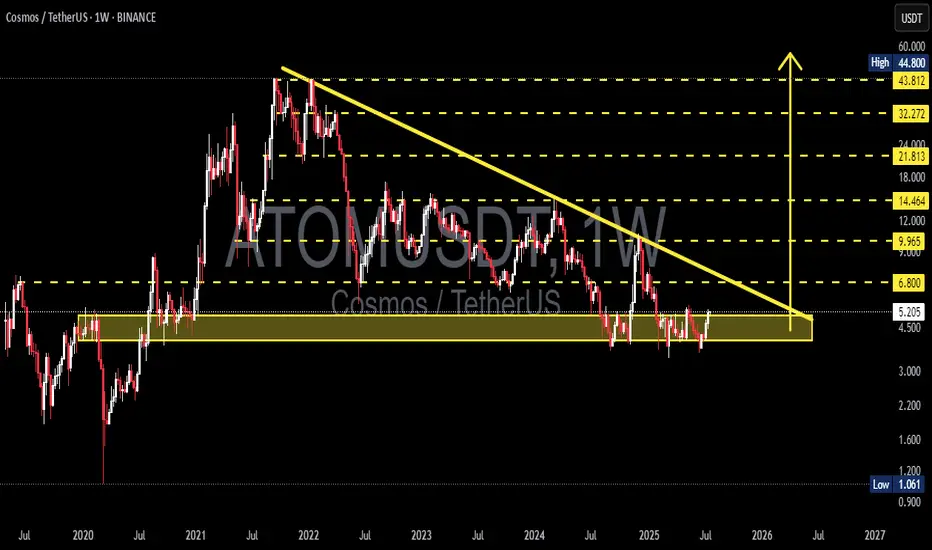
ATOM is currently trading within a horizontal accumulation zone between $4.50 and $5.20, which has held strong since early 2021. This key area has acted as a solid floor across multiple market cycles, suggesting strong buying interest from long-term holders or institutional participants.
🔻 Descending Trendline Resistance
Since reaching its all-time high (~$44.8) in late 2021, ATOM has been in a sustained downtrend, forming a descending trendline acting as dynamic resistance. The price is now retesting this line for the first time in months, hinting at a potential trend reversal setup if broken.
🧱 Potential Descending Triangle Breakout
The current structure closely resembles a Descending Triangle, with a flat base of support and a descending resistance line. While typically a bearish continuation pattern, in this context — combined with prolonged oversold conditions — it may serve as a bear trap and precede a major breakout.
✅ Bullish Scenario (Confirmed Breakout & Trend Reversal):
If ATOM breaks and closes weekly above $6.80, the breakout could trigger a powerful move, marking the start of a new macro bullish phase.
📈 Upside targets based on historical resistance levels:
📍 $9.96 → former short-term resistance
📍 $14.46 → previous support-turned-resistance
📍 $21.81 → major structural breakdown point
📍 $32.27 → upper resistance zone
🎯 $43.81 – $44.80 → All-Time High (ATH) zone
🟢 Potential upside: Over 700% from current levels if breakout is validated with strong momentum and volume.
❌ Bearish Scenario (Rejection & Breakdown):
If price gets rejected at the trendline and breaks below the $4.50 accumulation floor:
📉 Downside targets to watch:
🔻 $3.00 → previous minor support
🔻 $2.20 → pandemic-era support zone
🔻 $1.06 → historical bottom (2020)
This would confirm a continuation of the macro downtrend and indicate that further accumulation is needed before any major reversal.
📌 Key Technical Confirmation Signals:
Weekly Volume: A true breakout must be supported by a volume spike well above the weekly average.
RSI (Relative Strength Index): A move above 50 on the weekly RSI would support a bullish thesis.
Bullish Divergence (on lower timeframes): Would strengthen the breakout probability.
🔮 Strategic Takeaway:
ATOM is at a make-or-break level. With a long period of sideways consolidation and tightening price action, a high-volatility move is imminent.
> For long-term investors, this zone offers a high reward-to-risk opportunity. For traders, it's time to prepare for a confirmed breakout or rejection trade setup.
#ATOMUSDT #CosmosAnalysis #CryptoBreakout #TechnicalAnalysis #DescendingTriangle #BullishSetup #AltcoinSeason #CryptoMomentum #AccumulationZone #TrendReversal #CryptoSignals
ATOMUSD
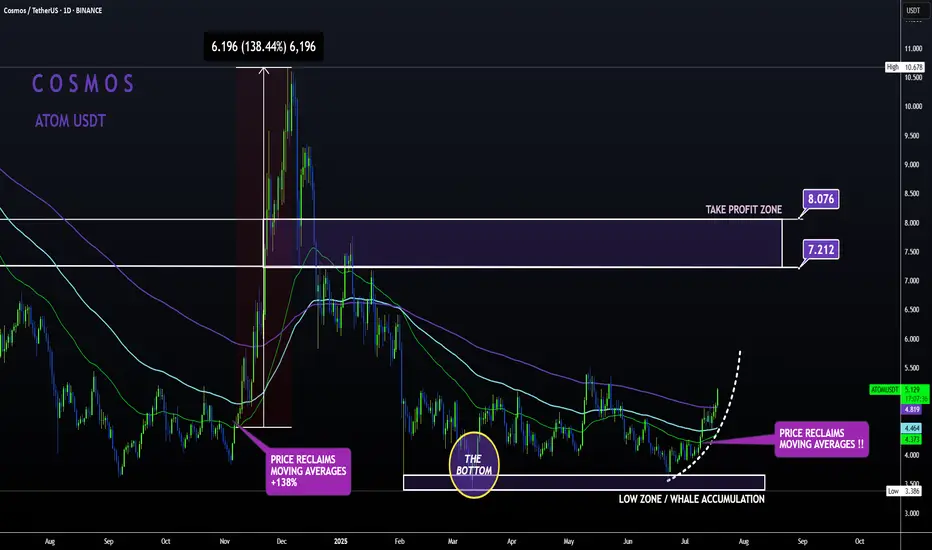
ATOM Sleeping GIANT ALT | Moving Averages BULLISH like NOV24'ATOM is slowly but surely making a turn up towards the first Take Profit point.
From the bottom, Cosmos has already increased a whopping 52% , with even more room to grow:
In my previous update, the 4 was still bearish when looking at trend lines and moving averages.
However, this has flipped to bullish from the 4h upward, with the price trading high above the moving averages in the 4h and in the daily timeframe:
4H:
Daily:
Note how previously, the big increases started as soon as the price regained the moving averages as support.
ATOM (COSMOS)🔹 Accumulation Phase in Play
We’re currently sitting in a clear accumulation zone — price is holding steady, showing signs of position-building by stronger hands.
📈 The next key areas are distribution zones, all of which are already marked on the chart. If you're entering a position now, odds are high you'll be able to secure profits as we move up. Just make sure to set a stop-loss — and don’t get greedy if you're aiming for the top.
⚠️ Even though it’s less likely, there’s a small chance of a shakeout near the yellow zone, but I personally doubt it — the market is already heavily shaken, sentiment is fearful, and many have been waiting for a move for too long.
🕰️ We’re also running out of time — the 4-year cycle is coming to a close by the end of this year. Historically, this aligns with significant market moves
ATOMUSDT Channel Breakout Alert!ATOMUSDT Technical analysis update
NASDAQ:ATOM is bouncing from a major support zone and has formed a descending channel at the bottom of the zone on the 4H chart. Currently, the price is breaking above the channel's trend resistance and trading above both the 50 and 100 EMAs on the 4H timeframe — a bullish signal for ATOM.

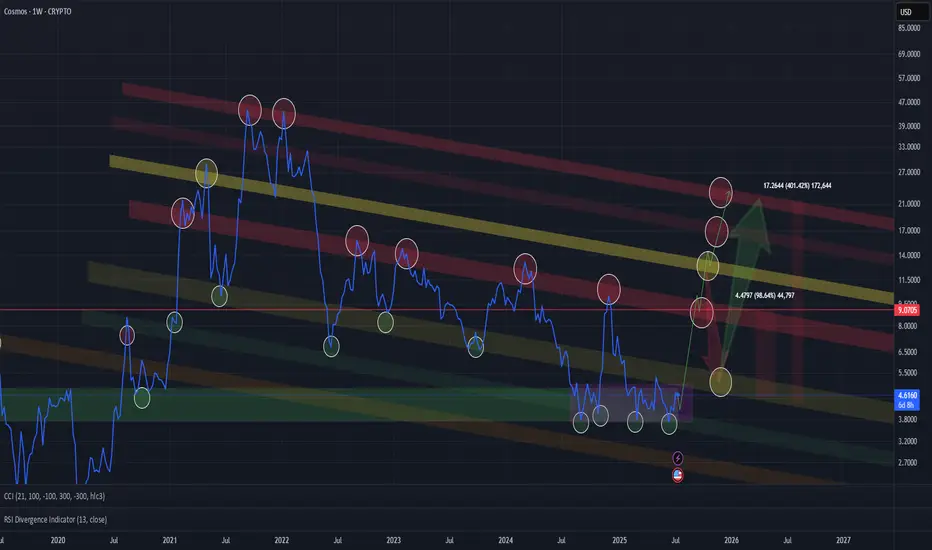
ATOM | COSMOS - REVERSAL SIGNALS & KEY LEVELS💫Here’s a detailed weekly ATOM/BTC analysis—focusing heavily on the Directional Movement Index (DMI) combo—and a forward-looking forecast.
💫 While ATOM/BTC is currently in a strong downtrend, the presence of bullish RSI divergence on a weekly scale suggests that the strength of this trend may be fading, opening the door for a possible upside shift.
💫 Trend Shift Scenarios:
👎 Bearish continuation if:
• –DI remains above +DI, AND
• ADX sustains above 30, reinforcing downtrend strength.
👍Bullish reversal begins when:
• +DI crosses above –DI on the weekly chart, and its starting to curve;)
• ADX remains elevated or climbs, confirming the new uptrend.
📉 Bear scenario:
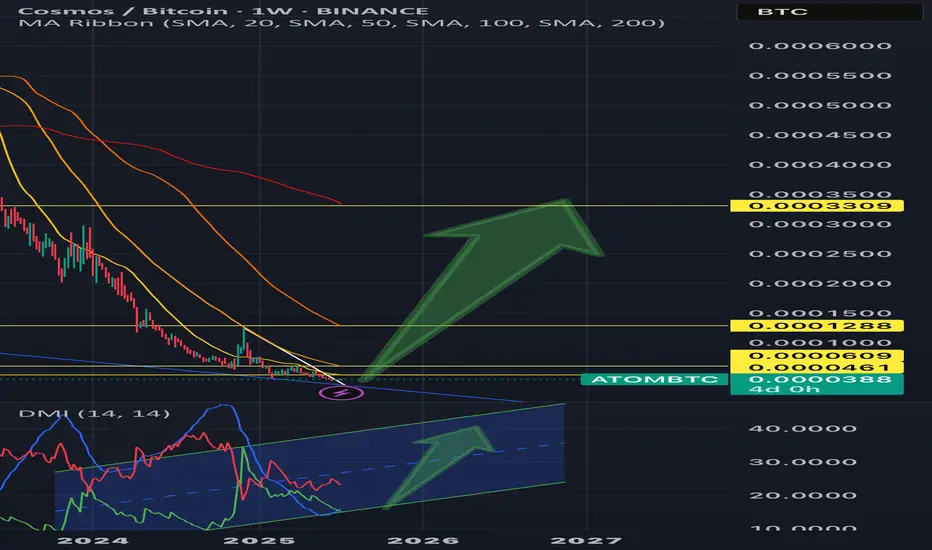
If +DI continues to lag and ADX remains strong—price may retest recent support levels in BTC terms (around 0.000037–0.000038 levels.)
📈 Bull scenario:
Look for +DI to crossover above –DI while ADX sustains high values. Weekly RSI divergence (already visible!!!!) supports this &suggests potential 30–50% upside if ATOM breaks out against BTC resistance.
💫 Price Target:
In such a breakout, expect ATOM to outperform BTC by ~30–40% short-term, with room for up to 100% upside if momentum builds more!
💫 Summary
Weekly ATOM/BTC shows a strong downtrend (–DI > +DI, ADX ~33), but bullish RSI divergence hints at a possible reversal.
💢Catalyst: +DI crossing above –DI with ADX sustaining signal strength.
💢Potential: 30–50% upside short-term, 100% mid-term if breakout holds.
💢Plan: watch weekly DMI/ADX and price action in 0.000037–0.000038 BTC range, manage risk with stop-loss under support.
*Noteable: Also Watch RSI confirmation: upward breakout off of divergence is a strong signal.
ATOM | SLEEPING GIANT | Altcoin GEMATOM is an alt that I have high expectations for.
From a 4h perspective, we can see the short term price is still very bearish.
This is confirmed by trading under the moving averages, which indicates that the sellers are in control.
The great news about this is that the price doesn't stay long UNDER the moving averages in the 4h. From the chart below, we see a very evident bearish trend - the price STAYS under the moving averages, with occasional, random wicks above and to the upper purple (200d MA).
After the bottom, marked the " BIG TURNAROUND ", we see the price trading mostly just under or just above, as we observe range trading. This is how we know, the bottom is in / close. And from here, it's only a matter of time until we start turning around to another bullish cycle . Where the gains far outweigh the risk.
Following this logic, the next reasonable ( very reasonable ) target, is the purple moving averages, and beyond. Currently at $4.3, a nice +8% from here.
_______________________

ATOMUSDT 1W Analysis ATOM ~ 1W Analysis
#ATOM Buy back gradually from here if you still have confidence in this coin with a short term target of at least 20%+ from here.

ATOM | Sleeping GIANT Altcoin Gem 1️⃣ATOM is probably one of my favorite altcoins at the moment.
If you look at ATOM from a macro timeframe such as the weekly, it seems like there is barely any hope and that it's just been one big liquidity run.
And although ATOM has retraced nearly 92% since it's ATH, we see a much brighter picture when we look at the daily, or 3D timeframe.
______________________
BINANCE:ATOMUSDT

WARNING For ATOM Holders: -50% Crash Incoming!Hello, Skyrexians!
As you know I was not sure last couple of days if altseason started or not and finally decided that not. Bitcoin dominance will reach 67% and large altcoin like BINANCE:ATOMUSDT gives me the hint that altcoins can drop 50% in the upcoming 2-3 weeks!
Let's take a look at the 2 days time frame. To measure the impulse this is valid now. We can see that after reaching the wave 3 target price bounced in the wave 4. Wave 4 has reached the 0.38 Fibonacci and started to go down after red dot on Bullish/Bearish Reversal Bar Indicator . Moreover Awesome Oscillator crossed the zero line signaling that wave 4 could be finished. Now price is in wave 5. The target is $2-3.5. I think it will reach slightly lower low at $3 in this bear market which is almost 50% crash from the current price.
Best regards,
Ivan Skyrexio
___________________________________________________________
Please, boost this article and subscribe our page if you like analysis!

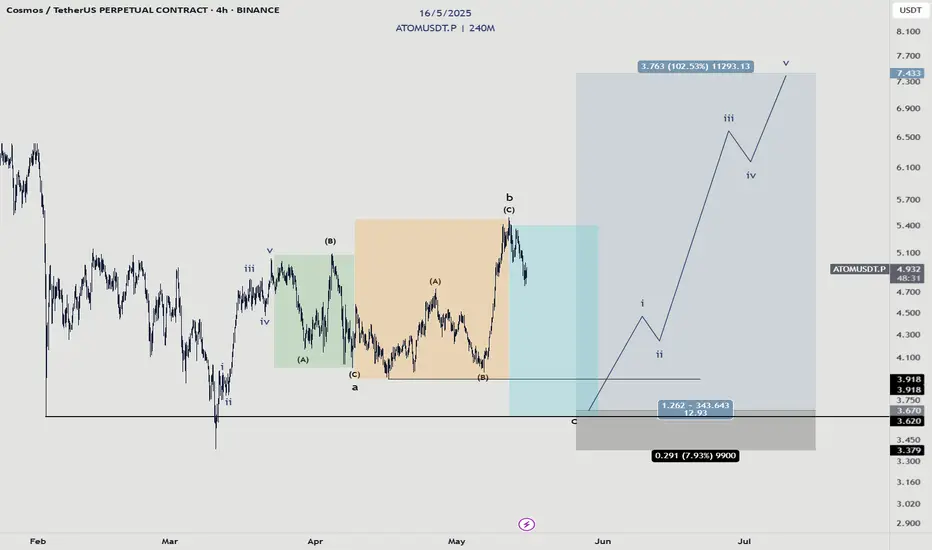
Cosmos - Manipulation?This idea is valid as long as the structure in the orange box maintains its three wave structure.
To prepare for a big run, it goes without saying that there must be some sort of accumulation and manipulation to occur.
In this case, I propose this expanded flat structure where we took the high out to kill the shorts and also trap buyers. Then, terminate that low to take out the buyers and trap sellers.. where we will enter a long into the big move.
ATOM / USD🔹 Current price: $4.46
ATOM is trading below its averages and indicators are showing a reversal. I expect short-term gains, especially given the fundamental improvements.
Fundamental Factors:
• Activation of the IBC protocol in February 2025, providing interoperability with Ethereum and BSC.
• Expanding the ecosystem through Interchain Security and launching new applications.

Cosmos (Atom)Atom usdt Daily analysis
Time frame daily
We have 2 models of analysis
1. The green line. Price can't break the resistance line and fall down to 3.5$
2. Price can break the resistance (gray line) and pump to 9$
Therfore we must watch the reaction of price and resistance

ATOMUSDT 1D AnalysisATOM ~ 1D Analysis
#ATOM Buy after successfully penetrating this resistant line with a short -term target of at least 10%+ from here.

Cosmos ATOM price analysisThere are signs that they are trying to keep the NASDAQ:ATOM price in the global buying zone of $3.80-5.50
🟡 If this is true, then the risky buying zone is $3.80-4.30 and the OKX:ATOMUSDT price should not be allowed to fall below that.
🟢 Well, a safe medium-term purchase of #Cosmos is possible only after the price is confidently fixed above $5.50 with a growth potential of at least $7.60-8.20. And if you're lucky, up to $10.
_____________________
Did you like our analysis? Leave a comment, like, and follow to get more

ATOMUSDT – Accumulation Phase with Bullish Breakout Potential!ATOM is currently trading within a key accumulation zone, showing signs of potential reversal after a liquidity sweep below the 2024 bottom support level around 3.63 USDT. This move may indicate the presence of strong demand at lower levels.
As long as ATOM holds above the 3.63 USDT level on a daily closing basis, the bullish scenario remains valid. A sustained move above the 5.15 USDT resistance may confirm the start of a bullish breakout, with potential upside targets at 7.76 and 9.30 USDT.
However, a daily close below 3.63 USDT would invalidate the bullish bias and suggest further downside pressure.
Key Levels to Watch:
Support: 3.63 (bottom support of 2024)
Resistance: 5.15 (accumulation zone breakout level)
Bullish Targets: 7.76 and 9.30
The structure remains bullish unless invalidated by a breakdown below support. Always manage risk accordingly.
#ATOM #COSMOS #ATOMUSDT

ATOM Will Reach $3 In This Bear MarketHello, Skyrexians!
As we shared with you earlier we suppose that the last bearish wave will happen for all altcoins in April and BINANCE:ATOMUSDT is not the exception. Despite the growth against the market the waves order shall be remained and we will finally see this dump.
Let's take a look at the daily chart. You can tell us that wave 5 has been already finished recently and now this is bull run but pay attention that Awesome oscillator has not crossed the zero line. It means that it was wave 5 inside wave 3. Now price is in wave 4 and entering the target area. The most optimistic scenario if price will reach $5.7 at 0.38 Fibonacci retracement, but it can reverse even now as well. Finally it will reach $2.5-3.5 in the wave 5 in April.
Best regards,
Skyrexio Team
___________________________________________________________
Please, boost this article and subscribe our page if you like analysis!

ATOM is bullish (12H)It appears that the ATOM symbol has initiated a bullish wave at the swing degree. The structure and bullish signals such as the trigger line break, bullish CH (Change of Character), and momentum in the candles are evident on the chart.
There is a resistance flip zone ahead of the price. If this zone is broken, two targets on the chart will be in play for ATOM.
A daily candle closing below the invalidation level would invalidate this analysis.
Do not enter the position without capital management and stop setting
Comment if you have any questions
thank you

ATOMUSD: Channel Down bottomed. Strong buy signal.Cosmos turned bullish on its 1D technical outlook (RSI = 60.498, MACD = 0.008, ADX = 27.015), which raised 1W to a neutral state. This is perfectly aligned with the market structure at the moment, which is a technical rebound at the bottom of the 3 year Channel Down. The 1W RSI is on a HL trendline, which is a bullish divergence as far as the Channel's LL are concerned. This means that there is potential to break this Channel to the upside, but until this happens, we will be targeting the 0.786 Fibonacci retracement level (TP = 9.500), like the previous bullish wave did.
## If you like our free content follow our profile to get more daily ideas. ##
## Comments and likes are greatly appreciated. ##

How Cosmos ATOM Will Outperform Market In 2025?Hello, Skyrexians!
We have already forgot about BINANCE:ATOMUSDT , asset which can only drill the bottom and be weaker than other crypto, but last 2 days it shows strength against all market. While most of coins are below the February 3 low, Cosmos is about escape this dead zone. The Elliott waves order is the king and price cannot be in correction forever, so it's ATOM's time and we will explain why.
Let's take a look at the weekly time frame. We can see two green dots on the Bullish/Bearish Reversal Bar Indicator , both of them have been conformed. They have the great angle with Alligator and have been formed at 0.61 Fibonacci level. Moreover we can see the divergence between first and second reversal bar with Awesome Oscillator. We have a lot of strong signals that bear market is over and now price can reach the new ATH in the global wave 3. We need just wait!
Best regards,
Skyrexio Team
___________________________________________________________
Please, boost this article and subscribe our page if you like analysis!

Golden Buying Opportunity on ATOM (1W)The correction on ATOM started from the point where we placed the red arrow on the chart.
This correction appears to be either a Diametric or a Symmetrical pattern.
A wave X or wave I to the upside is expected from the Entry levels.
We are looking for buy opportunities in spot at the Entry levels.
A daily candle closing below the invalidation level will invalidate this analysis.
For risk management, please don't forget stop loss and capital management
Comment if you have any questions
Thank You

ATOMUSDT 1WATOM ~ 1W Analysis
#ATOM Buy gradually from here if you still have a Conviction on this Coin. This is a very good support block for now.

atom shortterm buy"🌟 Welcome to Golden Candle! 🌟
We're a team of 📈 passionate traders 📉 who love sharing our 🔍 technical analysis insights 🔎 with the TradingView community. 🌎
Our goal is to provide 💡 valuable perspectives 💡 on market trends and patterns, but 🚫 please note that our analyses are not intended as buy or sell recommendations. 🚫
Instead, they reflect our own 💭 personal attitudes and thoughts. 💭
Follow along and 📚 learn 📚 from our analyses! 📊💡"

ATOMUSDT 1WATOM ~ 1W
#ATOM If you still have Conviction on this coin,. Don't miss this trade,. Buy with a minimum target of 20%++
