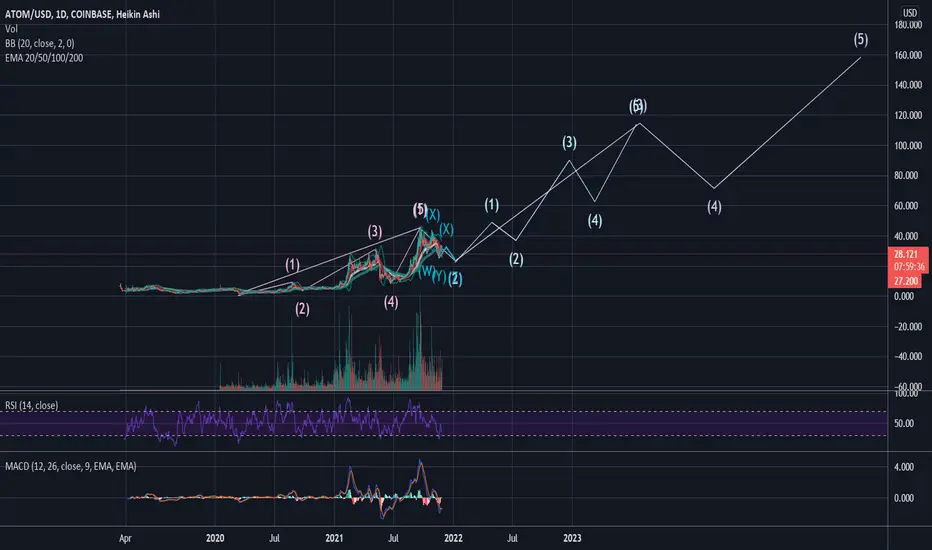
ATOM swinging nicely - 10-20% possible
Marked FIB-levels and trendlines, ATOM is behaving well inside those so that I will go for some 10-20% swing-trades here.
Trade on you own risk & responsible.
ATOMUSD

ATOMUSDT-LONGThere is a long position in ATOMUSDT Cosmos
ATOMUSDT Cosmos
🔵Long Now or set on Key Level 25.85
🟢Target 1 28.90
🟢Target 2 32.95
❌Stop loss 24.55
#K_Level

ATOMLooks like ATOM has bottomed and the bulls have filled all their bags, I think we going back up from here

ATOM - Good IndicatorsSince BTC decided to do a nice little drop last night, basically knocking “most” alts down with it, I thought I’d review my watchlists to see what coins I follow were is primo position for positive movement.
As you can see I use a custom “MacD” I got off the TradingView list, and the Stochastic RSI for determining potential energy levels is my way of describing it.
Right now the MacD energy is at it lowest point caparable to where it was in July at the start of a wicked 387% runnola. The RSI is in a descending trend on its way to low level before an upturn.
Combine these indicators with a standard parallel channel ATOMs been in since mid July which shows that an upward movement is imminent, hopefully eh.
My thoughts, not advice Oklah. Cheers

ATOM/USDT Perfect Retest done Ready for Next Leg up#ATOM/USDT TA Update :-
$ATOM currently trading at $27
I am buying some $ATOM here.
Perfect Retest as per daily chart.
Entry:- $25-$27
Target :- $70
SL:- $20
Support :- $25

atom/usdTesting/tracking elliot wave theory. Please do not trade off idea without S/L. Not financial advice.
ATOMUSDT : There is a potential H&S pattern but...In ATOMUSDT 1H
There is a potential H&S pattern but there is still a downtrend need to break out.
If the price break out the downtrend and stand firm,trading strategy as below.
SL :29.163
TP1: 36.110
TP2: 37.044
TP3: 38.047
TP4: 42.295
If you like this analysis, give it a like or share your thought or let me know what crypto TA you want to know.

ATOMUSD Gann AnalysisAnother idea for ATOMUSD supporting my bearish stance
Initially price can be seen to hit the 1/2 Gann line, slowly though with each peak, price weakens, moving further and further away from this line
While being inside a rising wedge, a bearish view is justified
The indicator shows similar points (yellow) and expected downward move to follow
Heres my previous analysis on ATOMUSD which is also a bearish one


ATOM/USDT 2H Analysis and trade 23/11/2021Atom/USDT 2 Hours timeframe analysis and possible trade zones.
Right now is touching his montly VWAP zone, im expecting a retracement from here
Marked in red and green are the Supports and Resistances.
Entry 1: 29.57
Entry 2: between 27.70 and 28.70
Take Profit 1: between 36.20 and 37.20
Take Profit 2: 38.98
Trade Safe.
Regards!
P.D: Remember that BTC dictates the market.

ATOMUSDT-SHORTFutures ATOMUSDT ATOM COSMOS
🔴Short Now or set on Key Level 32.50
🟢Target 1 29.50
🟢Target 2 26.50
❌Stop loss 34.50
#K_Level

ATOM 2H BUYATOM 2H support is at ~$30.2
Enter 50% here
and try to set some buy orders near the support zone
If ATOM holds above the trendline,
the Take-Profit target would be $33.2, $36.2, and $42.2
Cheers

Atom buy the break , volume is back?I think $ATOM is strong right now. It broke downward trend now we need it check whether it can hold there : )
have a look on BTC . it can drag it down . check volume spikes and OI (open interest ) to know its legitimate or not. GL NFA
Breaks can be trick you. carefully lev or stick to spot .


ATOM/USD - Bullish momentum to take ATOM to $35!ATOM has flipped bullish and is rallying. Look at those sexy green candles.
The first test of this rally will be at $35 which may put up a fight before bulls can break it.
The MACD and RSI are curving up on increasing volume... this is bullish. Once MACD moving averages on daily timeframe do a bullish cross, this downtrend should end.
Expect some resistance at $35, but the momentum on the bull side is increasing, likely it won't hold price down for long if this continues.
Bias is bullish on this pair right now. But be careful as price will have a pullback at some point, you can't keep going up non-stop. Perhaps a good entry opportunity when that happens.
Like and follow if you liked my idea!

ATOMBTC Supporting the USD pairAn interesting pattern of rejections and recoveries Currently sitting above the major down trend line This bullish price action on the BTC pair supports a rise on the USD pair

ATOMUSDT 4H long setup; iHnS breakout and retestTA explained
Pretty clean iHnS pattern on the 2H TF:
Broke out, retested the neckline and bounced on the 4H 50MA.
Trade setup
Best entries: 28.762 - 30.256
TP1: 32.754
TP2: 35.802
TP3: 39.166
SL: 27.427
RR: 4.7
Max leverage: 2
—————
MDSquared Crypto Lounge
—————
Do Your Own Research (of course)
Trade at own risk (of course)
Only trade what you can afford to lose (of course)

Cosmos (ATOM) - November 21Hello?
Welcome, traders.
If you "follow", you can always get new information quickly.
Please also click "Like".
Have a nice day.
-------------------------------------
(ATOMUSD 1W Chart) - Medium to Long-Term Perspective
Above the 7.7772608-8.9843770 section: The upward trend is expected to continue
(1D chart)
Resistance section: 30.8767670-32.8272488
First support section: near the 25.0253213 point
Second support section: 17.2233938-19.1738756
We need to see if we can continue the uptrend by moving above the resistance zone.
It needs to move above the 39.8256148 point to accelerate the uptrend.
However, it must break through the resistance section formed in the section 40.6291765-42.5796583 upwards.
If it goes down, it could drop below the 25.0253213 point, so you need to trade with caution.
------------------------------------------
(ATOMBTC 1W chart)
3152 Satoshi-3749 Satoshi or higher: Expected to continue upward trend
------------------------------------------
We recommend that you trade with your average unit price.
This is because, if the price is below your average unit price, whether it is in an uptrend or in a downtrend, there is a high possibility that you will not be able to get a big profit due to the psychological burden.
The center of all trading starts with the average unit price at which you start trading.
If you ignore this, you may be trading in the wrong direction.
Therefore, it is important to find a way to lower the average unit price and adjust the proportion of the investment, ultimately allowing the funds corresponding to the profits to regenerate themselves.
------------------------------------------------------------ -----------------------------------------------------
** All indicators are lagging indicators.
Therefore, it is important to be aware that the indicator moves accordingly as price and volume move.
However, for the sake of convenience, we are talking in reverse for the interpretation of the indicator.
** The MRHAB-O and MRHAB-B indicators used in the chart are indicators of our channel that have not yet been released.
(Since it was not disclosed, you can use this chart without any restrictions by sharing this chart and copying and pasting the indicators.)
** The wRSI_SR indicator is an indicator created by adding settings and options to the existing Stochastic RSI indicator.
Therefore, the interpretation is the same as the traditional Stochastic RSI indicator. (K, D line -> R, S line)
** The OBV indicator was re-created by applying a formula to the DepthHouse Trading indicator, an indicator disclosed by oh92. (Thanks for this.)
** Support or resistance is based on the closing price of the 1D chart.
** All descriptions are for reference only and do not guarantee a profit or loss in investment.
(Short-term Stop Loss can be said to be a point where profit and loss can be preserved or additional entry can be made through split trading. It is a short-term investment perspective.)
---------------------------------

$ATOM Cosmos oversold! $ATOM Cosmos
Cosmos is an ecosystem of blockchains that can scale and interoperate with each other.
Depends on BTC if the correction is over.
Healthy correction and finds support, good moment for a buy IMO. I dont think personally that the price will go down to the red box.
Good luck! Take profits on the road or sit on your hands.
Feedback welcome!
DYOR and please let me know what you think.

💡ATOMUSDT ANALYSIS 💡Hello Friends
When we look at the chart for 4 hours, there is a shark bull formation formation.
It is very risky to enter the trade before the voluminous momentum comes. Risk money management is very important in such transactions.
There are technical levels on the chart.
TP1:28.92
TP2:30.78
TP3 :34.17 Trading
entry level :28.92 (at 4 Hour candle closing)
Stop loss: 27.32 (Based on my own money management)
IT IS NOT INVESTMENT ADVICE. IF YOU
BENEFIT FROM ANALYSIS, DON'T FORGET
TO LIKE AND FOLLOW 👍👍👍👍 IF THERE IS SOMETHING WRONG WITH THE FORMATION, YOU CAN ALSO BE AWARE.
📗📗EDUCATIONAL PURPOSES📗📗
Shark Bull Formation ( Bullish Shark Pattern)
EU foot, OX foot on the 113% - from 161.8%
prolong BC feet, OXI foot of extending to beyond the far 113'ü% OX foot
BCR foot of the AX 161.8% - is an extension 224'lük%
OTHERS unlike harmonic patterns, operations are entered as follows: Targets can be 61.8% of BC with
incoming stops at 88.6% of the input OX foot and at point C

If we break support, then down to $24, but im buying the dip.Cosmos is one of the most severely undervalued large cap tokens - once its ecosystem becomes as robust as DOT, then it will also surpass it in cap IMO; ATOM has great tech and a great team. Long.

ATOM/USDT LongAfter last bullish move last local high actin as support also its 0.382 atom is set for 100$ but there is 2 price to watch out first 44 then 55 last high and that trend line after that is only up to 100 also this depends on btc to like everything and pls do your own research .

The Internet of BlockchainsAtom approaching a strong key support level to break a new high.
Cosmos is an ever-expanding ecosystem of interconnected apps and services, built for a decentralized future.
Find entry level, TP's and SL in T.A.
Trade safe...
#atom #e2kclciks
