ATOM Cosmos Bearish Pennant PatternIn its recent case against Binance, the SEC introduced 10 cryptocurrencies into the securities classification: BNB (BNB), Binance USD (BUSD), Solana (SOL), Cardano (ADA), Polygon (MATIC), Cosmos (ATOM), The Sandbox (SAND), Decentraland (MANA), Axie Infinity (AXS) and COTI (COTI).
A bearish pennant is a technical chart pattern that typically occurs during a downward trend in a financial market. It is characterized by a small symmetrical triangle formation, with converging trendlines that resemble a pennant shape. This pattern suggests a temporary pause or consolidation in the price movement before a potential continuation of the downtrend.
When a bearish pennant pattern breaks down, it means that the price has moved below the lower trendline, signaling a potential resumption of the downtrend. This breakdown is considered a bearish signal and may indicate further downward price movement in the near term.
Traders and investors often monitor bearish pennants and their breakdowns as potential opportunities to initiate or add to short positions or to manage existing bearish trades.
My price Target for ATOM is $5.60.
Looking forward to read your opinion about it.
ATOMUSD

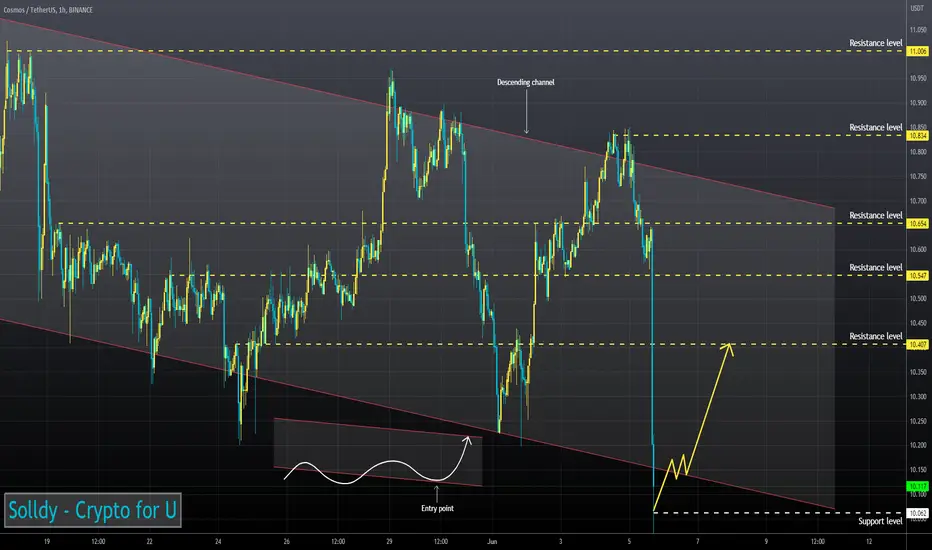
ATOMUSD ❕ lower boundary of the channelATOM has sharply reached the lower boundary of the current descending channel.
Many technical analysis indicators indicate that the asset is oversold.
I believe that the price can bounce if it holds in the channel.
ATOMUSDT at monthly support, likley to head towards 13.5-14.7So this is high time frame analysis. The price is trading around monthly support MS1. It has tapped this support several times in past few weeks and every time the price has bounce to the upside although with diminishing degree. Still, it is likely that the price will make a larger move to the upside. It is possible that the price dips into this monthly support and breaches it briefly but even in that case I am not expecting it to go below the 8.84 level marked on the chart. But my bet would be that this monthly support holds and the price move upward from this support. The first target should be monthly resistance MR1. Other resistance levels are also marked on the chart.

atomusdt (cosmos) are you rdy?🧨😉Atom currency
From the volume point of view, the price to volume ratio is low, the purchase volume is high, so it can be said that the banks are making high purchases, but from the point of view of the bank price, it has not yet reached the desired price of the banks.
The price of banks to buy this currency is 18% lower than the current price.
So what we are seeing is that the price should first see $8.577, then the best entry target to enter this currency is this price so that we are ready for the upward targets.
The first target is $14,660 and the second target is $16,793

ATOMUSD ❕ broke up the channelATOM broke through the downward channel.
The price is testing the support level again.
I believe that the asset could bounce from the current level again.

ATOMUSD: Holding Support Above 0.786 RetraceAfter crashing below it and bottoming at the 0.886, ATOM has come back above the 0.786 and is Double Bottoming while Bullishly Diverging above a local trendline. If this action holds firm then I think it can see $22-$44.

ATOMUSD ❕ fixed above the channelATOM again held above the upper boundary of the channel.
The price is decreasing along with the trading volumes.
I expect a rebound from the support.

ATOM/USDT Ready, and you?BINANCE:ATOMUSDT tested trendline. Great potential for near future.
After breakout, i axpect a great move.

Cosmos ATOM price behaves "out of the box" are you expecting 🚀?First, let's look at the global chart of ATOMUSDT trading history
As you can see, the price entered the medium- and long-term buying zone six months ago.
It was followed by a good 80% increase in the price of ATOM, and for the past few months, it has been consolidating around the important $10.65 level.
In recent days, the ATOMUSD price has been quite well bought back and has not fallen down after BTC.
Even if we assume that the consolidation of the Cosmos token price will continue for several months (white scenario), there is still a +30% growth potential within the consolidation.
The critical level from above is $14.50
If buyers manage to break through and gain a foothold above $14.50, there will be space for growth to $20
_____________________
Did you like our analysis? Leave a comment, like, and follow to get more

ATOM BEARISH IF BREAKS DAILY SUPPORTATOM/USDT on 1D is testing the support zone of descending triangle.
BEARISH IF WE BREAK BELOW THE ONE.

ATOMUSD ❕ fixed above the channelATOM has fixed above the channel and returned to the range.
The RSI chart is moving in the buy zone (4H, 1H and 30m TFs)
I believe the asset will bounce after it fixes in the range.

✅TS ❕ ATOMUSD: downtrend channel✅✅ ATOM could not break the structure.
The asset returned to the descending channel.
The price will continue its decline. ✅
🚀 SELL scenario: short to 10.591 🚀
----------------------------------------------------------------------------
Remember, there is no place for luck in trading - only strategy!
Thanks for the likes and comments.

ATOMUSD looks very bullish ATOMUSD broke the downsloping resistance line and it's pumping now.
If we get any pullback, it will be a great buying opportunity.
17 $ is the target for longs.
take profit level: 15,39
Good luck

Cosmos (ATOM) analysis: New rubric "Where is the BOTTOM?"Hello, everyone!
Let's continue to analyze fundamentally strong crypto assets which I am going to buy at the very bottom. Now it's time to predict where the bottom for ATOM is gonna be.
Using trading chaos approach I defined the Elliott waves with the order you can see on the chart. You can tell me that wave 2 is too deep, but I have the evidence that it's correct. Look at the Fibonacci extension 1.61 - the natural wave 3 target. Price has reached this target perfectly. After that price has printed the wave 4 which is represented as a triangle correction. I think now ATOM is in wave 5 because it broke down the key fractal level.
The most important question: where is the gonna be the bottom. My answer is $3. There I will buy ATOM for the new bull run. This target was calculated according to the Tom Joseph's methodology. Bill Williams linked to his approach that's why I use it here.
Best regards, Ivan
________________________________
Follow me and never miss update👍

✅TS ❕ ATOMUSD: kept the support level✅✅ ATOMUSD is moving near the upper limit of the channel.
The chart has once again held the support level.
We believe that the price of the asset will continue to rise. ✅
🚀 BUY scenario: long to 12.639 🚀
----------------------------------------------------------------------------
Remember, there is no place for luck in trading - only strategy!
Thanks for the likes and comments.

Atom (cosmos)Very nice chart , dropped down , recovered , break up .
I cant see more than upside here .
Good luck


ATOMUSD - Bullish Trend - 1H TFBased on the chart pattern analysis, it appears that the price is forming higher highs (HHs) and higher lows (HLs), which indicates a bullish trend. Furthermore, the Relative Strength Index (RSI) showing divergence is synced currently. I recommend taking a long trade with a risk/reward ratio of 1:1
Please note that this is my personal analysis and trade plan, and it is important for you to conduct your own research and risk management strategies before making any trading decisions.

[cosmos] by qikoToday, I bring forth a fascinating analysis of ATOM.
Since its low in March 2020, ATOM has experienced an impressive 4100% increase at its peak. Subsequently, ATOM descended in five waves, with the 5th wave truncating, signifying the inception of a downtrend.
I anticipate the swing highs to be surpassed for Wave B before resuming the downtrend to complete Wave C.
Wave B Target: ~ 26
Wave C Target: ~ 3

ATOM-USD✦SHORT TRADE SETUP✦ONE HOUR✦ATOM (COSMOS) is moving in a bearish direction and making a Bearish Flag Continuation Pattern. In addition, the presence of divergence is negative. Therefore, this trade setup is designed to have a SHORT TRADE opportunity over one hour time frame. Projected Price is given in dashed line. Risk Reward Ratio is set to 2% of the total portfolio.

ATOM can increase a lot pretty soon!ATOM is going to create a big double bottom pattern which means the price shall increase a lot ! the second Bottom will be created soon and afterward we shall expect the price to increase as much as the measured price movement (the length between the top and the bottom of the pattern) and reach 15.85$
_ _ _ _ _ _ _ _ _ _ _ _ _ _ _ _ _ _ _ _ _ _ _ _ _ _ _ _ _ _ _ _ _
🌍Thank you for seeing idea .
Have a nice day and Good luck.

ATOM/USDT Secondary trend. Right shoulder area.Secondary trend. Time frame 1 week. Logarithm. Showing % of potential reversal zones depending on the overall situation in the crypto market.
Coinmarketcap : Cosmos
Line graph.
Local trend. Pivot zone. Time frame 1 day.
Main Trend Look at my previous idea published half a year ago by clicking on the "play" button on the price chart.
ATOM/USDT Main Trend. Channel. The important zone.

Cosmos momentum shiftanother really simple chart that seems to be suggesting a shift in momentum for the foreseeable future.
