Cosmos (Atom)Atom usdt Daily analysis
Time frame daily
We have 2 models of analysis
1. The green line. Price can't break the resistance line and fall down to 3.5$
2. Price can break the resistance (gray line) and pump to 9$
Therfore we must watch the reaction of price and resistance
ATOMUSDT

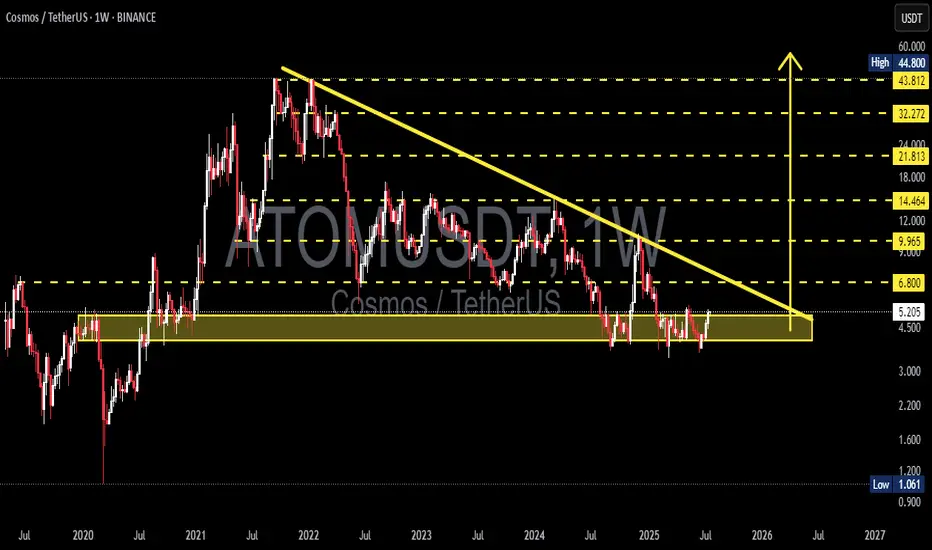
ATOM/USDT – Long-Term Accumulation Phase Nearing Breakout?📊 Full Technical Breakdown:
🟡 Long-Term Accumulation Zone
ATOM is currently trading within a horizontal accumulation zone between $4.50 and $5.20, which has held strong since early 2021. This key area has acted as a solid floor across multiple market cycles, suggesting strong buying interest from long-term holders or institutional participants.
🔻 Descending Trendline Resistance
Since reaching its all-time high (~$44.8) in late 2021, ATOM has been in a sustained downtrend, forming a descending trendline acting as dynamic resistance. The price is now retesting this line for the first time in months, hinting at a potential trend reversal setup if broken.
🧱 Potential Descending Triangle Breakout
The current structure closely resembles a Descending Triangle, with a flat base of support and a descending resistance line. While typically a bearish continuation pattern, in this context — combined with prolonged oversold conditions — it may serve as a bear trap and precede a major breakout.
✅ Bullish Scenario (Confirmed Breakout & Trend Reversal):
If ATOM breaks and closes weekly above $6.80, the breakout could trigger a powerful move, marking the start of a new macro bullish phase.
📈 Upside targets based on historical resistance levels:
📍 $9.96 → former short-term resistance
📍 $14.46 → previous support-turned-resistance
📍 $21.81 → major structural breakdown point
📍 $32.27 → upper resistance zone
🎯 $43.81 – $44.80 → All-Time High (ATH) zone
🟢 Potential upside: Over 700% from current levels if breakout is validated with strong momentum and volume.
❌ Bearish Scenario (Rejection & Breakdown):
If price gets rejected at the trendline and breaks below the $4.50 accumulation floor:
📉 Downside targets to watch:
🔻 $3.00 → previous minor support
🔻 $2.20 → pandemic-era support zone
🔻 $1.06 → historical bottom (2020)
This would confirm a continuation of the macro downtrend and indicate that further accumulation is needed before any major reversal.
📌 Key Technical Confirmation Signals:
Weekly Volume: A true breakout must be supported by a volume spike well above the weekly average.
RSI (Relative Strength Index): A move above 50 on the weekly RSI would support a bullish thesis.
Bullish Divergence (on lower timeframes): Would strengthen the breakout probability.
🔮 Strategic Takeaway:
ATOM is at a make-or-break level. With a long period of sideways consolidation and tightening price action, a high-volatility move is imminent.
> For long-term investors, this zone offers a high reward-to-risk opportunity. For traders, it's time to prepare for a confirmed breakout or rejection trade setup.
#ATOMUSDT #CosmosAnalysis #CryptoBreakout #TechnicalAnalysis #DescendingTriangle #BullishSetup #AltcoinSeason #CryptoMomentum #AccumulationZone #TrendReversal #CryptoSignals
ATOM Sleeping GIANT ALT | Moving Averages BULLISH like NOV24'ATOM is slowly but surely making a turn up towards the first Take Profit point.
From the bottom, Cosmos has already increased a whopping 52% , with even more room to grow:
In my previous update, the 4 was still bearish when looking at trend lines and moving averages.
However, this has flipped to bullish from the 4h upward, with the price trading high above the moving averages in the 4h and in the daily timeframe:
4H:
Daily:
Note how previously, the big increases started as soon as the price regained the moving averages as support.
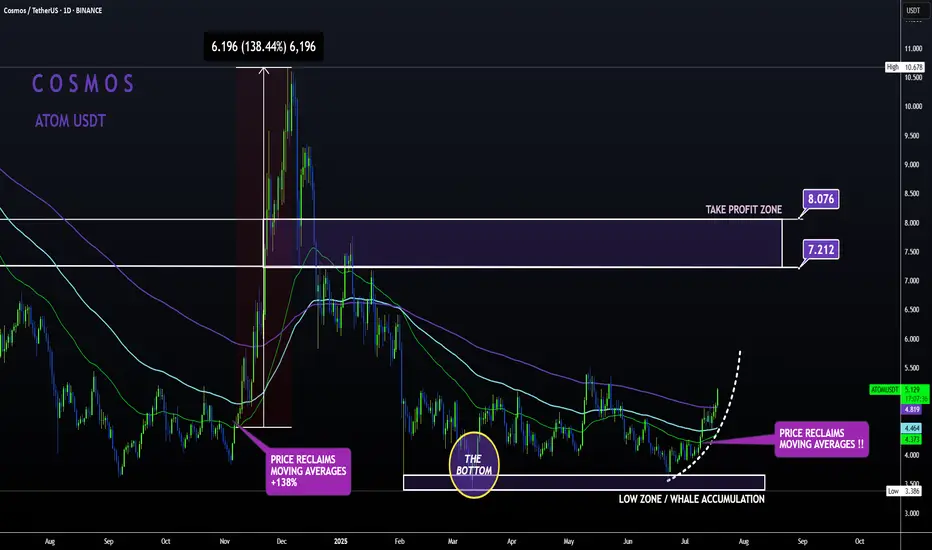
Cosmos (ATOM) Trading At Bottom · Bear Markets End ForeverCosmos is still trading near its market bottom, the "opportunity buy zone" as I call it. This is nothing more than great news.
Remember how I mentioned that some pairs are really advanced, trading already very high and this is risky if you want to go LONG? Well, when projects are trading near the bottom of the range; support, all-time lows, this is great news because there is little room for lower and plenty of room for prices to grow. ATOMUSDT is now in this highly desirable situation.
This a trading pair that is "yet to move."
It is awesome.
Potential for growth goes beyond the chart, literally. The chart you are seeing here now does not show the potential ATOMUSDT has for growth. The size of the candles should tell you everything you need know.
Bullish waves, corrections, bullish waves and corrections and see how small the candles are. Compare to the action in 2021 and you know we are looking at a true bottom. This opportunity does not repeat often and with the market evolving as it is evolving now, this might be the last chance in the history of Cryptocurrency to buy this low.
This is because we are entering an extended bull market that will last for years to come. When a new bear market develops, a long-term correction, it will be nothing like before. Instead of down, down, down forever, we will have some sideways then down, a strong swing followed by a recovery and additional growth. Just like Bitcoin. Look at Bitcoin since November 2022, that is how most of the big altcoins projects will evolve.
The wild-wild west of Crypto is going to an end. Think of it this way, Cryptocurrencies credit application has been approved.
Remember how the bear markets became shorter and the bull markets longer when the Federal Reserve came into the picture in the early 20th century? That is because with credit easily available, there was no more need for the companies to crash nor take a long time to recover from a major downturn. Here the situation is the same.
With the Cryptocurrency market now being accepted as the amazing technology that it is, we have access to credit. Instead of long and wild crashes, we will have short-term corrections. In short, demand will be too strong for the market to stay depressed for too long.
There will always be corrections of course, night and day (market cycles), but from now on, these will be short.
Namaste.
ATOM (COSMOS)🔹 Accumulation Phase in Play
We’re currently sitting in a clear accumulation zone — price is holding steady, showing signs of position-building by stronger hands.
📈 The next key areas are distribution zones, all of which are already marked on the chart. If you're entering a position now, odds are high you'll be able to secure profits as we move up. Just make sure to set a stop-loss — and don’t get greedy if you're aiming for the top.
⚠️ Even though it’s less likely, there’s a small chance of a shakeout near the yellow zone, but I personally doubt it — the market is already heavily shaken, sentiment is fearful, and many have been waiting for a move for too long.
🕰️ We’re also running out of time — the 4-year cycle is coming to a close by the end of this year. Historically, this aligns with significant market moves
ATOMUSDT Channel Breakout Alert!ATOMUSDT Technical analysis update
NASDAQ:ATOM is bouncing from a major support zone and has formed a descending channel at the bottom of the zone on the 4H chart. Currently, the price is breaking above the channel's trend resistance and trading above both the 50 and 100 EMAs on the 4H timeframe — a bullish signal for ATOM.

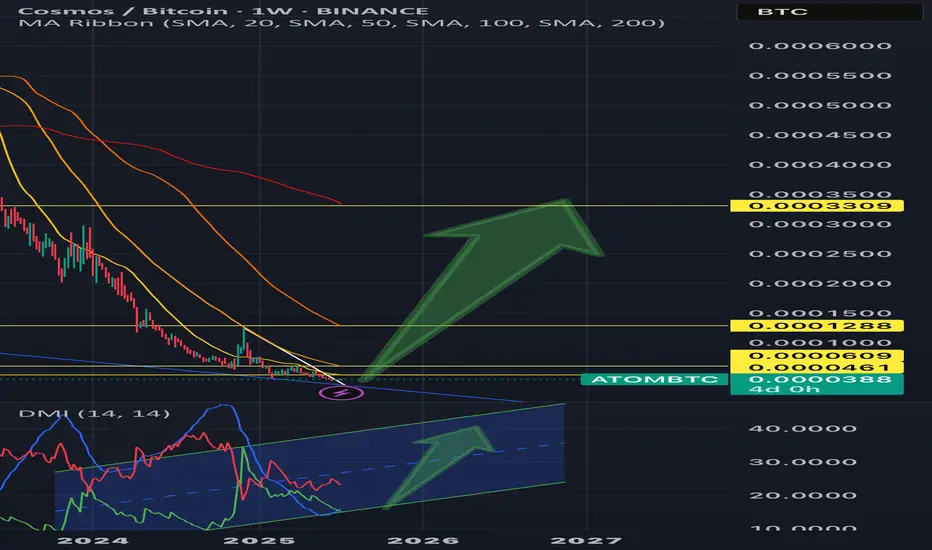
ATOM | COSMOS - REVERSAL SIGNALS & KEY LEVELS💫Here’s a detailed weekly ATOM/BTC analysis—focusing heavily on the Directional Movement Index (DMI) combo—and a forward-looking forecast.
💫 While ATOM/BTC is currently in a strong downtrend, the presence of bullish RSI divergence on a weekly scale suggests that the strength of this trend may be fading, opening the door for a possible upside shift.
💫 Trend Shift Scenarios:
👎 Bearish continuation if:
• –DI remains above +DI, AND
• ADX sustains above 30, reinforcing downtrend strength.
👍Bullish reversal begins when:
• +DI crosses above –DI on the weekly chart, and its starting to curve;)
• ADX remains elevated or climbs, confirming the new uptrend.
📉 Bear scenario:
If +DI continues to lag and ADX remains strong—price may retest recent support levels in BTC terms (around 0.000037–0.000038 levels.)
📈 Bull scenario:
Look for +DI to crossover above –DI while ADX sustains high values. Weekly RSI divergence (already visible!!!!) supports this &suggests potential 30–50% upside if ATOM breaks out against BTC resistance.
💫 Price Target:
In such a breakout, expect ATOM to outperform BTC by ~30–40% short-term, with room for up to 100% upside if momentum builds more!
💫 Summary
Weekly ATOM/BTC shows a strong downtrend (–DI > +DI, ADX ~33), but bullish RSI divergence hints at a possible reversal.
💢Catalyst: +DI crossing above –DI with ADX sustaining signal strength.
💢Potential: 30–50% upside short-term, 100% mid-term if breakout holds.
💢Plan: watch weekly DMI/ADX and price action in 0.000037–0.000038 BTC range, manage risk with stop-loss under support.
*Noteable: Also Watch RSI confirmation: upward breakout off of divergence is a strong signal.
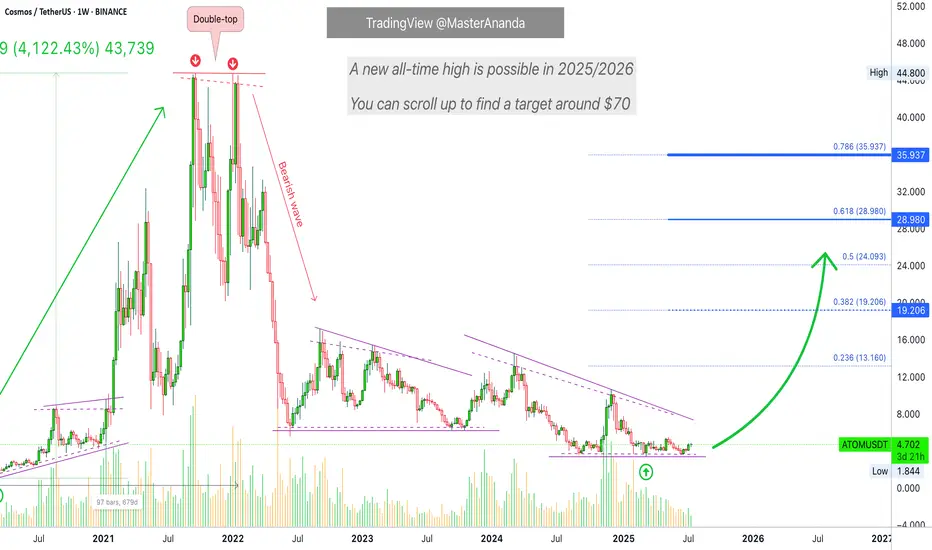
Cosmos (ATOM) $70 New All-Time High, Market Dynamics & MoreCurrent price for ATOMUSDT matches the low from September 2020. The same range was also active in July of the same year and between December 2019 and February 2020.
From a low point in March 2020 Cosmos (ATOMUSDT) grew 4,122% to peak in September 2021. Giving us a 560 days long bull market.
The double-top in January 2022 extended the bull market to a total of 679 days. Those that didn't sell in September 2021, after a correction, had an additional month to sell at the highest possible.
Back in those days we had a rising bottom after the all-time low. This time around we have a stable (flat) bottom.
The lowest price for Cosmos happened March 2025. A one year long bull market would give us a top around March 2026. If we get 560 days like last time this would give us a top around September 2026. Compare this to September 2021, same month. Things will be pretty interesting that's for sure.
We cannot generalize anymore and each pair/project needs to be considered individually.
For example, Ethereum hit bottom June 2022, here Cosmos hit bottom March 2025, huge difference. Many projects bottomed also mid-2022 but others bottomed around August 2023, others August 2024 and many others just recently, 7-April 2025 and some even last month.
We are entering uncharted territory.
The big projects and the ones with ETFs will have their own charts. Corrections will be minimal and we cannot expect the same highly volatile and crazy dynamics as when Crypto was underground, it is public now and it has all the attention in the world. The altcoins can't crash down too strong when everybody is waiting to buy when prices go low.
The flat bottom in 2024-2025 for Cosmos can tell of two things: 1) There is the possibility of one final flush, lasting only a few hours or days and this would mark the start of the next bullish phase. Or, 2) the next cycle can start uneventfully. Normally there is always a strong shakeout before the change in trend.
A pair can grow for years, as some projects are already doing based on higher lows while others can be doing things differently.
I am just trying to get the point across that each project needs to be considered individually, this is very important for the future because everything is changing now but the effect will be felt only after many months. Even the bear market will spread out; not like before. The bull market is very likely to be extended because the projects move in groups and since the market is so big now it will take time for each group to jump.
Start late, ends late.
This chart allows for a new all-time high. $70 is the standard projection and I should say also the minimum. But this one is tricky because of the chart structure. It can also end with no new all-time high so all will depend on the demand. How strong is the project, the team behind it, how active are the participants, etc.
There will be enough capital for everything to shine but only those with a plan and the right tools will attract our attention. It is a huge game, competition is very strong. Those that neglect their projects are likely to stay behind. Those that are active with a positive mindset and plan, should come to the front.
You know how it is... Regardless of any individual project, Crypto is going up.
Namaste.

ATOM | SLEEPING GIANT | Altcoin GEMATOM is an alt that I have high expectations for.
From a 4h perspective, we can see the short term price is still very bearish.
This is confirmed by trading under the moving averages, which indicates that the sellers are in control.
The great news about this is that the price doesn't stay long UNDER the moving averages in the 4h. From the chart below, we see a very evident bearish trend - the price STAYS under the moving averages, with occasional, random wicks above and to the upper purple (200d MA).
After the bottom, marked the " BIG TURNAROUND ", we see the price trading mostly just under or just above, as we observe range trading. This is how we know, the bottom is in / close. And from here, it's only a matter of time until we start turning around to another bullish cycle . Where the gains far outweigh the risk.
Following this logic, the next reasonable ( very reasonable ) target, is the purple moving averages, and beyond. Currently at $4.3, a nice +8% from here.
_______________________

Cosmos (Atom) 11 Months Within Accumulation ZoneThis is a repeating theme and pattern; this is a classic. Cosmos is now sideways after a correction. The correction is preceded by a bullish wave.
The bullish wave in late 2024 was a short-term, it lasted only one month. But what is interesting is the fact that the bottom range is the same now as it was before the last bullish wave.
If you count the period from the September 2024 low until present day, we have more than 280 days. A very long time. If we start counting from August 2024, when the current accumulation zone was activated, this gives us a total of 314 days, more than 10 months. This is truly all that we need to know. The same low holds for almost a year, getting very close.
If ATOMUSDT does not rise within 2 weeks, this would give us a total of 11 months within the same zone. But it doesn't break, each time a low point is activated there is strong buying and this has been happening long-term.
August 2024, September 2024, November 2024. Then again February 2025, March 2025, April, May and the same accumulation zone is still active today.
The whales are accumulating now, this is their buy-range. Once the accumulation phase is over, we will experience a strong bullish phase. Not a small jump as back in late 2024, but an uptrend, higher highs and higher lows.
Ravencoin weekly is a great example. See the 'related publications.'
Thanks a lot for your continued support.
Namaste.

ATOM. Massive Liquidity Grab Incoming. 06/12/25BINANCE:ATOMUSDT At the moment, the price is in an accumulation phase.
The buyer interest zone lies between $3.806 – $3.601, which also serves as a strong support area. We may see solid spot/futures entries here and the potential start of a new upward move.
What we’re really waiting for is liquidity to be swept in this zone — where tons of stop-losses have clustered. Such a shakeout would be a perfect setup for a bullish impulse.
Spot/futures accumulation is valid within this zone.
DYOR.

ATOMUSDT 1W Analysis ATOM ~ 1W Analysis
#ATOM Buy back gradually from here if you still have confidence in this coin with a short term target of at least 20%+ from here.

TradeCityPro | ATOM: Major Support Test in Cosmos Ecosystem Coin👋 Welcome to TradeCity Pro!
In this analysis, I’m going to review the ATOM coin for you. This project is part of the Osmosis network ecosystem.
🔍 ATOM, with a market cap of $1.68 billion, is currently ranked 51st on CoinMarketCap.
📅 Daily Timeframe
As you can see in the daily timeframe, ATOM is currently sitting on a very significant support zone. It has tested this area multiple times, and once again, it’s hovering around that level.
⭐ If the price finds support here and begins to move upward, we can consider entering a long position with a trigger at 4.588. The main bullish trigger will be the 5.380 level, and if that breaks, spot buying can also be considered.
✨ As I always mention with spot triggers on altcoins, it’s best to wait for Bitcoin dominance to start declining before entering. If that happens, ATOM could potentially move toward targets at 7.514 and 10.4.
⚡️ If the key support at 4.075 breaks, we can open a short position targeting 3.501. The 35.68 level on the RSI is a critical support, and a break below it would serve as a momentum confirmation.
📊 Also, keep an eye on market volume. It has been declining recently, and once volume starts flowing in on either side, we can prepare to act on the corresponding trigger.
📝 Final Thoughts
This analysis reflects our opinions and is not financial advice.
Share your thoughts in the comments, and don’t forget to share this analysis with your friends! ❤️

ATOM | Sleeping GIANT Altcoin Gem 1️⃣ATOM is probably one of my favorite altcoins at the moment.
If you look at ATOM from a macro timeframe such as the weekly, it seems like there is barely any hope and that it's just been one big liquidity run.
And although ATOM has retraced nearly 92% since it's ATH, we see a much brighter picture when we look at the daily, or 3D timeframe.
______________________
BINANCE:ATOMUSDT

Atom... Falling wedge Pattern?A chart from my view. Not a prophecy, just a perspective. Risk is yours to carry. As always.
— TheChartMystic

CRYPTO TRADING: ATOM CAN GIVE 50-100% RETURN FROM HEREATOM can give us a good 100% return from here, risking only 18% of the invested amount.
Reason?
Weekly structure has turned bullish.
Daily is super bullish.
My stop loss is below the recent swing low on weekly time frame.

Don't Miss This Big Move on COSMOS (ATOMUSDT)Hello Everyone!
With Bitcoin on the rise and Ethereum likely to follow—as outlined in my recent ETHEREUM analysis idea —we continue to look for strong opportunities in the altcoin market. Right now, all eyes are on COSMOS ( BINANCE:ATOMUSDT ) as it shows promising signs of a potential breakout.
On Weekly timeframe
Price has swept the bottom of September 2024 liquidity zone.
On 4D timeframe
- On the OBV (On-Balance Volume) indicator , price has broken a downtrend—similar to the breakout seen in October 2024 , which was followed by a 170% rally.
- The previous 4-day candle closed above a key Fair Value Gap (FVG), indicating potential bullish momentum.
On 1D timeframe
- V shape inverse pattern.
- There’s significant liquidity in the $6.5–$7.5 range . After successfully breaking above the $5.1 level —just as I strongly anticipated—price is now likely targeting that liquidity zone.
To sum up, BINANCE:ATOMUSDT is demonstrating both fundamental strength and technical confirmation, making it a high-potential candidate in the current market environment.

TradeCityPro | Deep Search: In-Depth Of ATOM👋 Welcome to TradeCity Pro!
Today we have a deep research analysis of the ATOM project, and in this report, I’m going to review the project completely. Let’s first go over the project’s fundamentals and then analyze the ATOM chart technically.
🌌 What Is Cosmos?
Cosmos is a blockchain ecosystem designed to solve major challenges in the blockchain industry, such as low speed, high cost, lack of scalability, and the environmental impact of proof-of-work algorithms like Bitcoin. Cosmos enables cross-chain interaction (interoperability) by connecting independent blockchains through a protocol called Inter-Blockchain Communication (IBC).
Cosmos aims to simplify the development of blockchains and decentralized applications (dApps) using a modular framework known as Cosmos SDK, which makes it easier for developers to build blockchain networks.
🛠 How Does Cosmos Work?
The Cosmos network is composed of three main layers:
Application Layer: Handles transaction processing and updates the network state
Networking Layer: Manages communication between blockchains and their transactions
Consensus Layer: Establishes the final state of the blockchain using a consensus algorithm
At the core of this structure is the Tendermint BFT engine, which enables developers to build custom proof-of-stake (PoS) blockchains without coding from scratch.
🔗 Cosmos Hub and Zones
Cosmos Hub was the first blockchain created within the Cosmos network and serves as a central hub for other blockchains—called zones.
These zones are independent blockchains that can interact through Cosmos Hub.
Validators on Cosmos Hub are responsible for maintaining consensus across all zones and are compensated with transaction fees.
The native token of the network, ATOM, is used for transaction fees, governance participation, and staking.
🎯 Key Features of Cosmos
Interoperability: IBC allows blockchains to interact directly
High Scalability: Blockchains run in parallel without overloading a single chain
Ease of Blockchain Development: Cosmos SDK lets developers build customized networks
Decentralized Governance: Users participate in governance by staking ATOM
💡 Interchain Accounts Upgrade
In February 2022, the Interchain Foundation introduced the Interchain Accounts upgrade, allowing blockchains to control accounts on other chains. This enables remote actions like staking, voting, token swapping, and more—without needing full network upgrades.
This significantly enhances interoperability and composability within the IBC ecosystem.
👥 Founders of Cosmos
Jae Kwon
Zarko Milosevic
Ethan Buchman
Cosmos was initially developed by Tendermint Inc. In 2020, Jae Kwon stepped down as CEO and was replaced by Peng Zhong.
🔐 Network Security
Cosmos uses a proof-of-stake consensus algorithm with Byzantine Fault Tolerance (Tendermint BFT):
Validators are selected based on staked ATOM
Malicious behavior results in slashing (loss of tokens)
Rewards are distributed proportionally among validators and their delegators
📍 Where Can You Buy ATOM?
ATOM is available on most major exchanges, including:
Binance
Coinbase
OKX
Kraken
📈 ATOM Token Information
📊 Initial Token Distribution
In 2017, Cosmos raised approximately $16 million through public and private sales. The initial token distribution was as follows:
Public Fundraise:
Share: 44.1%
Unlocked: 35.6%
Block Rewards:
Share: 39.5%
Unlocked: 31.7%
Strategic Investors:
Share: 7.03%
Unlocked: Unknown (likely still locked)
All in Bits, Inc. (Tendermint):
Share: 6.53%
Unlocked: 5.26%
Interchain Foundation:
Share: 6.51%
Unlocked: 5.26%
Seed Investors:
Share: 3.31%
Unlocked: 2.67%
💰 Supply and Inflation
Initial supply: 236,198,958 ATOM
Current supply: ~292 million ATOM
Maximum supply: Unlimited
Inflation rate: Between 7% and 20%, targeting ~2/3 of total supply to be staked
The inflation rate is dynamically adjusted to incentivize staking. If the staking ratio drops below the target, inflation increases, and vice versa.
🔐 Staking and Rewards
Unbonding period: 21 days
Annual reward rate (APR): Between 14% and 20%, depending on network conditions and staking service provider
By staking ATOM, users help secure the network and earn rewards funded through inflation and transaction fees.
🧾 Economic Mechanisms
Burning: If a governance proposal is vetoed, the deposited tokens are burned
Slashing: Validators engaging in malicious or negligent behavior lose part of their staked tokens
🧠 ATOM Tokenomics Models: 1.0 vs 2.0
Recent analysis reveals different impacts of tokenomics models on network sustainability:
ATOM 1.0 with a 10% inflation cap has shown a 10% improvement in token price and treasury health
ATOM 2.0 suffers from stability issues and is often replaced by ATOM 1.0 to maintain network security
Community Treasury in ATOM 1.0: May face depletion within ~24 months due to limited token supply
🔚 Conclusion
Cosmos represents a significant advancement in blockchain infrastructure by addressing some of the core limitations of earlier networks—most notably, interoperability, scalability, and developer accessibility. Through its modular architecture, innovative Tendermint consensus engine, and the IBC protocol, Cosmos has laid the foundation for a truly interconnected web of blockchains.
The network’s native token, ATOM, not only fuels this ecosystem through staking and governance but also underpins its dynamic economic model. While challenges remain—especially around inflation control and treasury sustainability—Cosmos continues to evolve as a leading force in the multichain future of decentralized technologies.
Now that we’ve reviewed the project, let’s move on to the chart for a technical analysis.
📅 Weekly Timeframe
In the weekly timeframe, as you can see, the price has formed a support bottom at the 3.812 level and has tested it multiple times.
✨ This support is very important because if it’s lost, the price could move down toward the 1.863 bottom.
💥 On the other hand, if the price is supported at this level, a bullish cycle could begin. The resistance levels ahead are 6.602 and 10.135.
🔍 The 6.602 zone isn’t very strong, and if the price gets rejected there, it signals that sellers are much stronger than buyers.
✔️ But if the price breaks through this level and moves upward, the 10.135 zone becomes very significant, because if that level is broken, a Double Bottom pattern will be activated and we can get confirmation of a trend reversal.
💫 If this pattern is confirmed, the first target will be 15.704.
📊 Right now, it’s better to pay attention to oscillators like volume and RSI. Volume is currently decreasing, and we need to wait for volume confirmation alongside price movement. If the price starts to move with volume convergence, the likelihood of continuation increases.
🔔 The RSI oscillator also has a small bullish divergence with price. The reason it’s considered small is that the price made an equal low while the RSI made a higher low. If RSI makes a new higher low again, we may start to see the effect of the divergence in the chart.
🎲 A breakout above the 50 level on RSI could also be a confirmation of bullish momentum.
📅 Daily Timeframe
In the daily timeframe, we can see more details of the price action.
🧩 As observed, the price has formed a range box between 3.989 and 5.380, and within this range, RSI has shown a strong divergence.
📈 I think if RSI doesn’t stabilize below the 50 level, and if the price sets a new higher low above 4.588, the chance of breaking the 5.380 resistance on the next test will be much higher.
🔑 If 5.380 is broken, the price could rally to 7.514. The next target after that would be 10.135, a level I also emphasized in the weekly timeframe.
🔽 For a bearish scenario and short positions, the first trigger is a break below 4.588, which can act as a lead-in to a possible break of 3.989. The main short trigger will be the confirmed break of 3.989.
❌ Disclaimer ❌
Trading futures is highly risky and dangerous. If you're not an expert, these triggers may not be suitable for you. You should first learn risk and capital management. You can also use the educational content from this channel.
Finally, these triggers reflect my personal opinions on price action, and the market may move completely against this analysis. So, do your own research before opening any position.

WARNING For ATOM Holders: -50% Crash Incoming!Hello, Skyrexians!
As you know I was not sure last couple of days if altseason started or not and finally decided that not. Bitcoin dominance will reach 67% and large altcoin like BINANCE:ATOMUSDT gives me the hint that altcoins can drop 50% in the upcoming 2-3 weeks!
Let's take a look at the 2 days time frame. To measure the impulse this is valid now. We can see that after reaching the wave 3 target price bounced in the wave 4. Wave 4 has reached the 0.38 Fibonacci and started to go down after red dot on Bullish/Bearish Reversal Bar Indicator . Moreover Awesome Oscillator crossed the zero line signaling that wave 4 could be finished. Now price is in wave 5. The target is $2-3.5. I think it will reach slightly lower low at $3 in this bear market which is almost 50% crash from the current price.
Best regards,
Ivan Skyrexio
___________________________________________________________
Please, boost this article and subscribe our page if you like analysis!

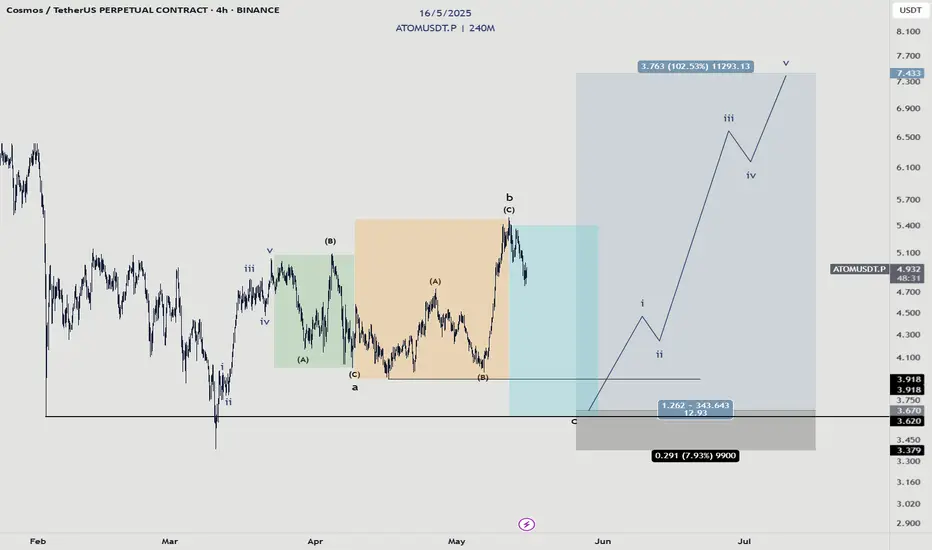
Cosmos - Manipulation?This idea is valid as long as the structure in the orange box maintains its three wave structure.
To prepare for a big run, it goes without saying that there must be some sort of accumulation and manipulation to occur.
In this case, I propose this expanded flat structure where we took the high out to kill the shorts and also trap buyers. Then, terminate that low to take out the buyers and trap sellers.. where we will enter a long into the big move.
$ATOM Ready for Liftoff – 100%+ Move on the TableNASDAQ:ATOM has just broken out of the trendline and is converting the major resistance into support.
This breakout could be the start of something huge - the chart shows potential 100 %+ movement ahead of it.
Looking forward to a retest around the $4.73 mark before the next move upwards towards $10+.
Momentum looks solid, this could take off soon 🚀
Retweet if you are bullish!
#ATOM #Altseason2025

ATOM/USDT review chart 4HHello everyone, let's look at the 4H ATOM chart for USDT, in this situation we can see how the price has affected from the upper limit of the downward trend channel, however, staying in the upper part of the channel. Going further, let's check the places of potential target for the price:
T1 = $ 4.79
T2 = $ 5,26
Т3 = 5.63 $
Let's go to Stop-Loss now in case of further declines on the market:
SL1 = $ 4.29
SL2 = $ 4.02
SL3 = $ 3,57
Looking at the RSI indicator, you can see a healthy relaxation crossing the lower limit, which produces space for a potentially new growth movement. The MacD indicator that has returned to the center of the range, which also creates potential for upward movement.

ATOM / USD🔹 Current price: $4.46
ATOM is trading below its averages and indicators are showing a reversal. I expect short-term gains, especially given the fundamental improvements.
Fundamental Factors:
• Activation of the IBC protocol in February 2025, providing interoperability with Ethereum and BSC.
• Expanding the ecosystem through Interchain Security and launching new applications.
