ATOM has a very good opportunity Hi Everyone;
today we have one of the best risk to reward Investment opportunity
it is more than 190 times the risk and the chart is look very promising.
I expect breaking the previous bear market key point will clear the way to the final target
ATOMUSDT

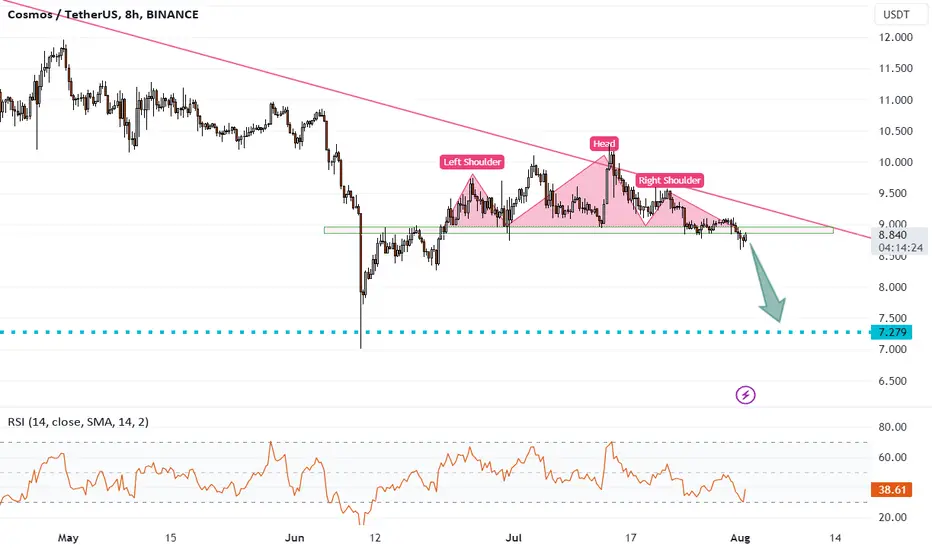
ATOMUSDT growth is not expectedHello everyone! According to ATOMUSDT, the thoughts are as follows: the coin has been in a downtrend for a long time and a trend change is not expected. Therefore, on smaller timeframes, I tried to catch further price movement, of course downwards. At the moment, the coin has drawn something similar to "head and shoulders", although it turned out to be two heads. In any case, there are very good chances after such a pattern to go at least to the past minimum values of 7.2
ATOMUSDT: Falling WedgeATOMUSDT: Falling Wedge
ATOM may exit the falling wedge upwards. This pattern is a bullish pattern that usually leads to higher prices.
Target 1 - 9.1700
Target 2 - 9.2672
Target 3 - 9.3836
Target 4 - 9.5114
If you like the idea, don't forget to subscribe and rate like👍


ATOMUSDTATOMUSDT is looking strong for bullish setup. ATOMUSDT is repeating the same pattern over and over again. Currently the price is getting support from 9.5 region. if this level holds , it will be nice buying option.

ATOM LOOKS BULLISH (4H)Hi, dear traders. how are you ? Today we have a viewpoint to BUY/LONG the ATOM symbol.
For risk management, please don't forget stop loss and capital management
When we reach the first target, save some profit and then change the stop to entry
Comment if you have any questions
Thank You

Cosmos (ATOM) formed bullish Gartley for upto 12.50% pumpHi dear friends, hope you are well and welcome to the new update on Cosmos (ATOM) coin with US Dollar pair.
Recently we caught more than 13% pump of ATOM as below:
Now on a 4-hr frame, ATOM has formed a bullish Gartley move for the next price reversal.
Note: Above idea is for educational purpose only. It is advised to diversify and strictly follow the stop loss, and don't get stuck with trade.

ATOM 1D ReviewHello everyone, I invite you to review the ATOM chart in pair to USDT, on a one-day timeframe. First, we will use the yellow line to mark the uptrend line on which the price is currently based.
Moving on, we can move on to marking support areas when we start a larger correction. And here the first support is at $8.81, and then it is worth marking the support zone from $7.89 to $7.26.
Looking the other way, we see that the price has turned around at the resistance of $ 10.29, when it manages to break it, we have a strong resistance zone from $ 11.06 to $ 11.56, only after a positive upward exit and testing the resistance will the price be able to keep going up.
Please look at the CHOP index, which indicates that we have a lot of energy for the upcoming move, the MACD indicates a downtrend, while the RSI is in the process of rebounding, and looking at the energies and the MACD, we can expect a price drop.

TRADE ALERT - LONG ATOMTraders,
Atom dropped from it’s ascending channel and soon afterwards found strong support at the top of the triangle for a classic retest of previous resisntance/now support. A break below this and we should be looking for exit points. I have set mine at approx. $8.50. Target is the June 4th body high at around $10.75
Position = ATOM
Direction = long
Entry = 9.28
Stop Loss = approx. $8.50
Take Profit(s) = 10.75+
Risk/Reward = 2/1
Leverage = NONE
Profit Potential = 16%+
Stew

Atom Breaking Out
Formed & Breaking Descending Channel In Daily Timeframe Incase Of Breakout Expecting 65 - 70% Bullish Rally Keep Eyes On For Breakout

ATOM Cosmos and the Altcoin Season ThesisThe recent developments in the cryptocurrency market, particularly the favorable court ruling for Ripple Labs, signal an optimistic start to a new altcoin season.
With the federal judge ruling that some of Ripple's sales of the XRP token do not fully meet the definition of a securities offering, it instills confidence in the altcoin space.
This ruling brings clarity to the regulatory landscape and alleviates concerns surrounding XRP, leading to major cryptocurrency exchanges, including Coinbase, relisting the token. The reintroduction of XRP to these platforms demonstrates growing acceptance and renewed interest in this altcoin.
The anticipation surrounding the approval of a spot bitcoin ETF in the United States adds to the positive sentiment in the market.
The successful launch of a previously approved ETF in Europe further reinforces the upward trend for altcoins.
The recent court ruling that declared XRP as not a security sets a precedent that could potentially benefit other cryptocurrencies currently classified as securities by the SEC. In the SEC's case against Binance, they designated 10 cryptocurrencies, including BNB, BUSD, SOL, ADA, MATIC, ATOM, SAND, MANA, AXS, and COTI, as securities.
Additionally, in the SEC's lawsuit against Coinbase, they named 13 cryptocurrencies, reinforcing their stance on SOL, ADA, MATIC, SAND, and AXS, and adding CHZ, FLOW, ICP, NEAR, VGX, and NEXO to the list.
This development showcases the increasing institutional acceptance of cryptocurrencies and creates a ripple effect across the market, providing a boost for various altcoins, including ATOM Cosmos, for which my price target is $11.15.
Looking forward to read your opinion about it!

SasanSeifi 💁♂️ATOM👉1D ⏩ 10.20$❗Hey there,
🔱In the daily timeframe chart, You can see that after a drop, the price has been bouncing back with some positive movement from the $8.50 range. And then, it found support again at around $8.50 after a small correction. Right now, it's trading around $9.40. Here's a scenario to consider: if the $8.50 support level holds, we might see the price grow towards the important resistance level at $10 / $10.20 and create a new high. To understand the next move better, let's see how the price reacts to those resistance levels!
🔹Just keep these scenarios in mind as you analyze the market. Remember, things can always change unexpectedly, so stay flexible in your trading approach.
Wishing you loads of success in your trading adventures, my friend!✌️
❎ (DYOR)...⚠️⚜️
🔹Sure, if you have any more questions or need further clarification, feel free to ask. I'm here to help!
🔹And if you found my analysis helpful, I would appreciate it if you could show your support by liking and commenting. Thank you! 🙌

ATOM/USDT 4H Interval ReviewHello everyone, I invite you to review the ATOM chart in pair to USDT, like its predecessor on the four-hour interval. First, we will use the blue lines to mark the downtrend channel in which the price is moving.
Going further, we can move on to selecting support places, for this we will use the trend based fib extension tool. And here we will mark a significant support zone from $8.16 to $6.91, however, when the zone does not hold the price, we can see a drop around the second very strong zone from $5.90 to $4.91.
Looking the other way, we see that the price is moving towards an important resistance zone from $10.54 to $11.37. If it manages to break out of this zone upwards, the price will move towards a strong resistance at $12.56 and further to the resistance at $14.05.
Please look at the CHOP index, which indicates that the energy for the moment is used, the MACD indicates that we are moving in a local downtrend, while the RSI has a significant rebound to the lower part of the range, which may give a change in the trend in the coming hours.

The key is whether it can rise with support from 9.603-9.999Hello?
Traders, welcome.
If you "Follow", you can always get new information quickly.
Please also click "Boost".
Have a good day.
-------------------------------------
(ATOMUSDT chart)
Looking at the 1D chart,
A rise above 9.603 indicates that the CCI indicator has exited the oversold zone.
Accordingly, the key is whether it can rise with support around 9.603-9.999.
If it rises above 9.999,
1st: 11.992-12.881
2nd: 14.319-15.083
Split selling is possible when resistance is received in the first and second sections above.
However, it is expected that a full-fledged upward trend will begin only when it rises above 14.319.
-------------------------------------------------- -------------------------------------------
** All descriptions are for reference only and do not guarantee profit or loss in investment.
** Even if you know other people's know-how, it takes a considerable period of time to make it your own.
** This is a chart created with my know-how.
---------------------------------

ATOMUSDT Elliott Waves AnalysisHello friends.
Please support my work by clicking the LIKE button👍(If you liked). Also i will appreciate for ur activity. Thank you!
Everything on the chart.
Entry: market and lower
Targets: 13 - 16 - 20
after first target reached move ur stop to breakeven
Stop: 5.7 (depending of ur risk). ALWAYS follow ur RM .
RR: 1 to 5
risk is justified
Good luck everyone!
Follow me on TRADINGView, if you don't want to miss my next analysis or signals.
It's not financial advice.
Dont Forget, always make your own research before to trade my ideas!
Open to any questions and suggestions

$ATOM W pattern on W ChartInteresting pattern on the W chart from ATOM COINBASE:ATOMUSD July will be a good month to trade
DYOR

Shor ATOM NASDAQ:ATOM bounced off the resistance level and broke through the ascending rendline. Decline to $7.7 is likely to happen next.

ATOMUSDT.1DHello Crypto Lovers, This is a 1D frame analysis for ATOMUSDT After hitting the second support line, as you can see, the price was able to move up again and support the price. Currently, the price is below the first resistance zone and we expect it to reach the first resistance zone. If it fails to establish itself above the resistance zone, we expect to see a price correction. However, if it is able to break through the resistance zone and establish itself above it, we expect a price increase. Warning: This is just a suggestion and we do not guarantee profits. We advise you to analyze the chart before opening any positions. Take care

ATOM/USDT LongTerm LONGHi y'all,
After almost a year, I am back!
We need time to find ourselves and change our lives in a way that we WANT.
So I have recently been analyzing the crypto market again and I think we can have a slight bullish movement.
Here is the chart of ATOMUSDT.
A w pattern is clearly to be seen in this chart based on fibonacci levels

ATOM Looks AMAZINGATOM looks like a BUY here.
Broke out of resistance and landed on support.
Doesnt get any better than this.

ATOM Cosmos Bearish Pennant PatternIn its recent case against Binance, the SEC introduced 10 cryptocurrencies into the securities classification: BNB (BNB), Binance USD (BUSD), Solana (SOL), Cardano (ADA), Polygon (MATIC), Cosmos (ATOM), The Sandbox (SAND), Decentraland (MANA), Axie Infinity (AXS) and COTI (COTI).
A bearish pennant is a technical chart pattern that typically occurs during a downward trend in a financial market. It is characterized by a small symmetrical triangle formation, with converging trendlines that resemble a pennant shape. This pattern suggests a temporary pause or consolidation in the price movement before a potential continuation of the downtrend.
When a bearish pennant pattern breaks down, it means that the price has moved below the lower trendline, signaling a potential resumption of the downtrend. This breakdown is considered a bearish signal and may indicate further downward price movement in the near term.
Traders and investors often monitor bearish pennants and their breakdowns as potential opportunities to initiate or add to short positions or to manage existing bearish trades.
My price Target for ATOM is $5.60.
Looking forward to read your opinion about it.

short ATOMNASDAQ:ATOM is bouncing off the resistance level and the descending trendline. Decline to support level at 9.32$ is likely to happen.

