Cosmos longCosmos bounced off the lower boundary of ascending channel. Bullish movement to resistance level at 15.33 is possible.
ATOMUSDT


Is ATOM Going TO blast To 30$!? In Depth Analysis!BINANCE:ATOMUSDT
First Let's Talk About The Project ATOM (COSMOS):
The Cosmos Project Was Launched in 2014 By Ethan Buchman And Jae Kwon Focusing On A Solution For Interoperable Blockchains.
Every project user, and entity's needs are different. So making customized networks that can interact with each other is valuable. Each new blockchain added to the Cosmos Ecosystem is called a Zone. Each zone can interact with another through Cosmos Hub, A Proof Of Stake relay Blockchain that allows data and assets to be shared.
ATOM is Cosmos Hub's Native Coin with three main uses. First users pay their transaction fees using Atom using a gas-based system. ATOM also allows you to participate in governance and is used in the network's consensus mechanism.
Now the most juicy part!! CHARTS!!!!
First, If we see at the weekly time frame, those bullish bought up candles clearly shows that how buyers were so interested to protect the lows and they gave higher closing everytime on weekly candles. This shows that price wont go below those wicks again.
Second, If we see whole market waves as elliot waves then we are done with the correction and going for Either 12345 impulse waves or ABC corrective wave, Targeting 30$!
Third, If we conclude the bottoming pattern, it turns out to be ADAM and EVE Double Botttom Patern For ATOM and which after breaking the 17$ Targets 25 and 30$ as the Profit Booking Targets!
Now, Let's Have a look at it's BTC Pair!
BTC pair shows that it has just broke out from the falling wedge or the bull flag on 3 Day time frame which targets 12-15K satoshi as the targets.
www.tradingview
If we Consider the bigger picture of ATOM. Then it is still in a very big accumulation.
And when it's going to breakout from it..it will have a new uptrend cycle which can give 5-10X returns on investment in ATOM.
So it will be very good Mid term play or till this bull run lasts!
https://tradingview/x/ZnSwCH1z/
So that is it for my analysis on ATOM.
Please Do support this idea and engage with it :)
Thank you for reading, i hope it added some value to you.
Regards
Bandhan Sharma AKA Wickhunterr

✴️ ATOMUSDT | Cosmos Ultra Bullish (Name Your Altcoin #15 ✅)
The Cosmos chart right now is as bullish as it can get... Join me, let's read it together.
ATOMUSDT.
First, we have the classic low set June 2022, this is the cryptocurrency market capitulation phase low/bottom.
For some cryptos it was the bottom, for others just a low point as a new low was hit later on.
Cosmos is one of the strong ones because a higher low was hit in December vs June.
This higher low gives you all the information that you need... After it, we have 7 consecutive weeks closing green.
The consolidation pattern in orange is breaking down in favor of the bulls.
Prices are now above EMA50 supported by a strong RSI... Volume slowly grows.
It won't be long until the next bullish jump!
See you at $29... Easy 100% and then some more.
Namaste.

ATOM COSMOS 4 Hour Chart Analysis Hello to all out there and good day!
Here we have ATOM COSMOS on the 4-Hour Chart setup.
We have this Chanel that ATOM has been trading in and may be at the top as it has tried # 3 times to BREAK this upward channel but failed.
ATOM must hold the 12.80 SUPPORT ZONE if the COIN wants to move to the upside.
The NEXT BULLISH Targets to look out for will be the 13.7 -14.11 LVL AND THEN 14.61 - 15.15 AREAS.
NOW FOR THE BEARISH Scenario.
IF ATOM loses the 12.8 LVL of SUPPORT We might see it go back and test the 12.1 -10. 0 LVLS .
I will update you as time unfolds! Thanks for looking::)


Possibility of breaking the bottom of the channelThe price trend of ATOM in the coming week can range, and there is a possibility of breaking the bottom of the ascending channel and retesting the $13 range. So, in general, the support range of $12.53 to $13.8 can be considered as a positive reaction zone. If the bottom of the ascending channel is broken, the price decline can continue even to the $11 range.

ATOM in daily hi every one
as you can see atom is under dynamic resistance and Divergence is clear in the chart ,
anyway , we have 2 scenario but i think better one is short, we will have a good drop in the market and atom will follow too, use proper risk managment and make your decision, short is best position for this week


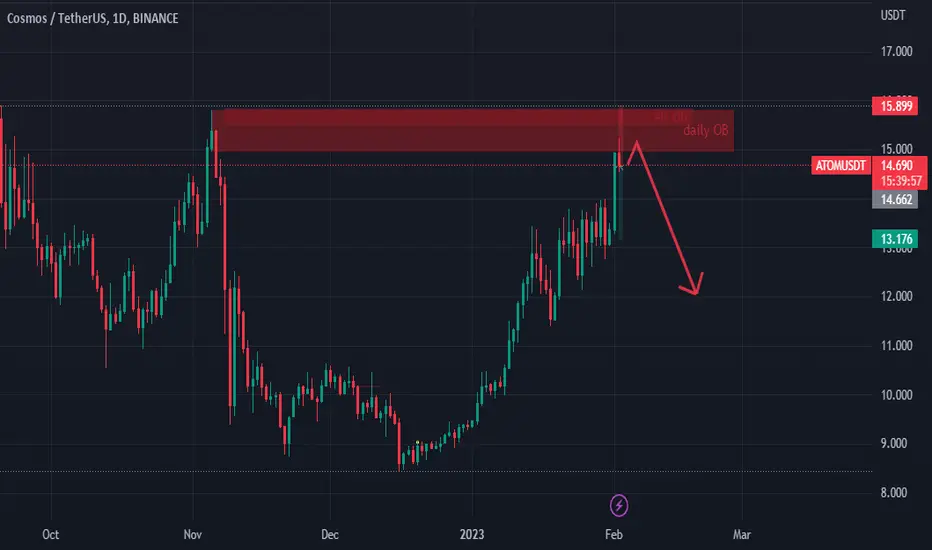
ATOM/USDT Bearish OrderblockIn the daily time frame, I saw a strong bearish order block that we can enter a short position in the lower time frames after seeing the confirmation.
You can enter the short position using your own personal strategy.

ATOM/USDT 1DAY UPDATE BY CRYPTO SANDERS !!Hello, welcome to this ATOM/USD update by CRYPTO SANDERS.
CHART ANALYSIS:-Cosmos (ATOM) was another notable mover in today’s session, with the token climbing for a second straight day.
Following a low of $13.15 on Tuesday, ATOM/USD moved to a peak of $13.84 earlier in the day.
Wednesday’s rally saw the cosmos move above a ceiling at $13.50, nearing its highest point since November 8 in the process.
Whilst this resistance level was broken, the 14-day RSI was approaching one of its own at 66.00.
As of writing, the index is tracking at 61.77, after it bounced from a support point at 58.00
Should this ceiling at 66.00 be hit, it is likely that ATOM could be trading above the $14.00 mark.
I have tried to bring the best possible outcome to this chart.
Hit the like button if you like it and share your charts in the comments section.
Thank you

ATOM/USDT Short IdeaATOM/USDT has confirmed a rising wedge.
sl:14.88
tp1:12.873
tp2:12.435
tp3:11.51

atomusdtWe have a strong supply zone around $14.1 to $14.75.
Considering the weakening of the upward trend of this currency and macroeconomic data such as the determination of the interest rate by the Federal Reserve in the remaining hours of the day, I expect the price to rise to around $14.3 and then drop to around $12.5

Atom analysisWhat Is Cosmos (ATOM)?
In a nutshell, Cosmos bills itself as a project that solves some of the “hardest problems” facing the blockchain industry. It aims to offer an antidote to “slow, expensive, unscalable and environmentally harmful” proof-of-work protocols, like those used by Bitcoin, by offering an ecosystem of connected blockchains.

Atomusdt: Buy TIMEHello Traders!
Welcome back to another trade with analyst Aadil1000x.
On Monday, the market was strongly bearish and failed to reverse from the True reversal point multiple times. Today market looks bullish and we are ready to buy atom from the key reversal area.
Atom Buy limit 13.388
Stoploss 13.126(-1.96%)
Target 1, 13.82(+3.2%)
Final Target 14.349(+7.18%)
Don't forget to hit the like button and follow to stay connected.

$ATOM - Cosmos Layer 1 - 50% Potential$ATOM - Cosmos Layer 1 Blockchain - 50% Gains Potential
Developers have built hundreds of blockchain projects on Cosmos, including Binance Chain (BNB), Terra (LUNA), Crypto.com Coin (CRO), Cosmos Hub (ATOM), and more.
On a successful break out of $17, $ATOM has a potenital of 48% Gains,
Aggressive entries only here, will be adding on a clean break out above.
Support Levels - $10.5 ,$12.2
Next resistance - $16.5,$21.3,$25.5
Invalidation clean break below $9.5

If the supports are maintained, we can expect further growth upIf the current strong support of $12.534 is broken, the decline could continue to the $10.485 range. But if the supports are maintained, we can expect further growth up to the resistance range of $15.814.


ATOM: Approaching ResistanceCosmos (ATOM) technical analysis:
Trade setup : Price has bounced off of $8.50 support and broke back above $10 and $12 resistance as well as 200-day moving average. It also made a Higher High, which are all signs of bullish trend reversal. If it breaks above the down trendline, it could revisit $16.
Trend : Uptrend on Short- and Medium-Term basis and Neutral on Long-Term basis.
Momentum is Mixed as MACD Line is below MACD Signal Line (Bearish) but RSI > 55 (Bullish).
Support and Resistance : Nearest Support Zone is $12.00 (previous resistance), then $10.00. The nearest Resistance Zone is $16.00.

ATOMUSDT Elliott Waves AnalysisHello friends.
Please support my work by clicking the LIKE button👍(If you liked). Also i will appreciate for ur activity. Thank you!
Everything on the chart. (update)
Nothing has changed from my last idea, setup is valid, waiting my targets.
Entry: market and lower
Target: 15 - 19 - 22 and maybe even ~25
after first target reached move ur stop to breakeven
Stop: (depending of ur risk). ALWAYS follow ur RM .
cancellation of setup - consolidation under 6
risk is justified
Good luck everyone!
Follow me on TRADINGView, if you don't want to miss my next analysis or signals.
It's not financial advice.
Dont Forget, always make your own research before to trade my ideas!
Open to any questions and suggestions.

Atom is bearishIf we look at 4 hours and 1-day chart we have two opportunities. It can be bullish if it holds its value above 13.414 which seems impossible right now. The triangle pattern even if it's 4 hr or 1 day we see it bearish. Atom will accumulate its value between 8.46-9.6.

ATOM USDT SHORT POSITIONas you can see price is in rising wedge pattern and also we have divergence in RSI & MACD
