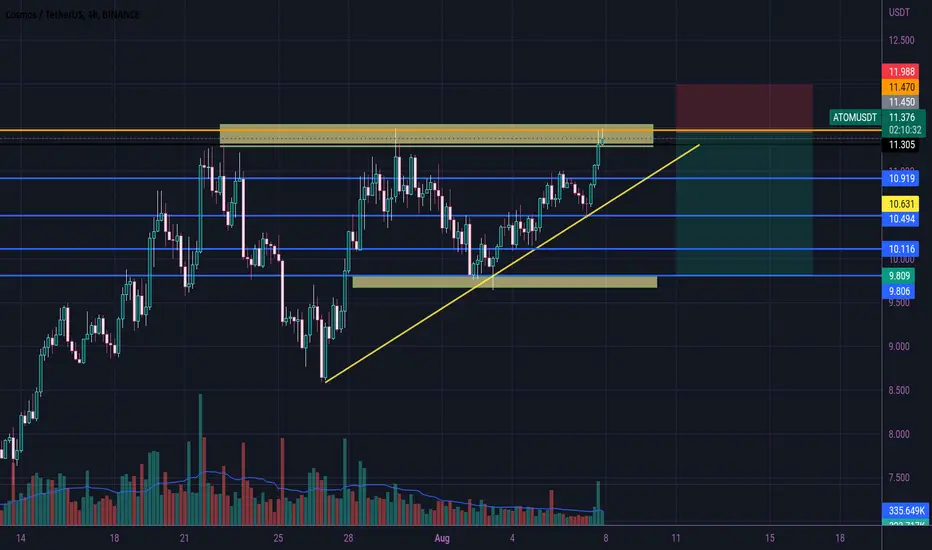
Atom Ascending triangle 🤔⏰🤔⏰🤔Hi dear traders
Ascending Triangle forming, if 11.470 resistance not breakout then we can open short position.
Wait ✋for confirmation.
Let's see what happens
Otherwise price can rise to near 14.35 area.
This is not financial advice ( DYOR )
Good luck
ATOMUSDT
ATOMATOM/BTC is prepared for a new ATH IMO
Atom Whitepaper 2.0
⚛️ Atom Monetary Policy
⚛️ Public Goods
⚛️ Interchain Services
Cosmoshub is an Interchain Service Provider.

Atom flight to the moon?The atom has drawn a "Triangle" pattern, the price is moving in it, I think we will break it up soon!
Subscribe and stay tuned for new ideas. Every day I post 10 profitable ideas a day.

Atom about to reach the end of the ascending lineMaybe we gonna see a COSMOS breakout in the following days / weeks ,
Its for entertainement only , no financial advice

Cosmos longCosmos broke trough the descending trendline. Asset broke trough the resistance level. Bullish movement to resistance level at 11.15 is expected to happen.

ATOMUSDT Two optimized short trades
I only risk 0.5% per transaction
Downward trend, so we only focus on short trades. The previous floor was broken and two supply areas were formed.
I place an order on each of these areas, these orders are optimized in 15 minutes.
< Saeed Akbari >

ATOM pattern "double top" Forecast!#ATOM
▪️The "Double Top" pattern has formed. A correction to the lower border of the channel begins, they can go lower to support lline!
In order not to miss a buy signal, subscribe and stay tuned for new ideas. Every day I post 10 profitable ideas a day.


ATOMUSD Short Target 7.90Accumulation phase is done as crypto needs a pull back before the next leg up, price target 7.90

💎 ATOMUSDT : 358.06% Profit Potential in Next 5 Months💣💣💣💣Last 2-3 weeks we seen huge buying in ATOM coin, in upcoming months its to going pump very hard.
entry and targets are given on the chart. Treat this idea as long-term investment
please Like and comment if there are any queries.
#bitcoin #altcoinseason #altcoin #altnews

Cosmos ATOM long Entry Range, Take Profit and Stop LossATOM/USDT
Entry Range: $10.90 - 12.00
Price Target 1: $13.70
Price Target 2: $15.50
Price Target 3: $17.00
Stop Loss: $8.60
short signal

ATOMUSDTA scalp deal
This trade is based on a 5-minute time frame
In order to be publicly displayed, it shows the higher time in the chart.
I only risk 0.5%

Cosmos (ATOM) - July 30Hello?
Welcome, traders.
By "following", you can always get new information quickly.
Please also click "Like".
Have a good day.
-------------------------------------
(ATOMUSDT 1W Chart)
The 12.282-15.837 interval is the interval that determines the trend.
Therefore, it is important to be able to rise above the 12.282-15.837 section.
(1D chart)
Resistance: 12.282-15.837
1st support: 9.603-10.878
Second support: 6.809
If it rises to the 12.282-15.837 section and falls without support, it is likely to lead to further declines.
Therefore, if resistance is found below 10.878, Stop Loss is required to preserve profit and loss.
This Stop Loss does not mean 100% sell.
It means a Stop Loss to free up cash to buy at a lower price when it leads to a further decline.
The range of further declines is up to -47%.
------------------------------------------------------------ -------------------------------------------
** All indicators are lagging indicators.
Therefore, it is important to be aware that the indicator moves accordingly as price and volume move.
However, for the sake of convenience, we are talking in reverse for the interpretation of the indicator.
** The MRHAB-T indicator used in the chart is an indicator of our channel that has not been released yet.
** The OBV indicator was re-created by applying a formula to the DepthHouse Trading indicator, an indicator disclosed by oh92. (Thanks for this.)
** Support or resistance is based on the closing price of the 1D chart.
** All descriptions are for reference only and do not guarantee a profit or loss in investment.
(Short-term Stop Loss can be said to be a point where profit and loss can be preserved or additional entry can be made through split trading. It is a short-term investment perspective.)
---------------------------------


Atomic motion of the atomNext, the price of $9.5 is considered a support level in the upward trend. If the price continues at this level, it can reach the price of $12

ATOMUSDT | In orbit?hello trader Today I prepared a new idea for you. Like and subscribe to the channel there is a lot of useful information✅
After a strong strait, the asset rebounded from the zone of the lower zone of the channel, I think there is potential for growth, Cue ball will give life to the alts!

ATOM GOING UP TO return down....many bad trades last few days
I hope this one not going up down and loss this good position
Don’t forget SL

ATOMUSDT 1hA limited short trade
I only risk 1%
The general trend is downward, so I only focus on short trades. There is a price gap and the price wants to fill that gap.

ATOM\USDT 📈Pressure Under The Level📈Hello friends👋
📈Long for 5-10% of the deposit
On the chart, we see the price tightening, there was a breakdown of the horizontal resistance level, followed by a retest, a good point for a long.


ATOM - $5 Long TargetI've been tracking ATOM since Sept 2020 with this loose support/resistance structure. Only exited and didn't short in Nov 2021 and waiting a long time to find a reasonable place to buy. I'm expecting it will return to the $5 mark for long entries the coming couple of days in line with my BTC long targets.
- Atom/BTC entry target is estimated at 0.0002100.
- No rush on this drop as it will occur over a few days - Will ladder in on the bounce.
- Long target - Initial $10, expected is $20.
Best, HF
Capitulation targets

ATOM/USD - Path to $14! 💪ATOM is found in a strong rally and has been making higher highs every day. Whenever the price dipped, buyers came in rushing, like today.
Should this buy momentum last, then the next key target is found at $14.
As you can see on the chart, the buy volume on the last 3-day candle was significant and higher than any since such candle since January 2022. That has to count for something right?
Buyers are in and bulls seem to be on holiday.
All indicators are bullish as well. Unlikely we reverse here. But keep an eye on Bitcoin as that likes to spoil the fun sometimes for alts. :)
Bias is bullish on this chart.
Like and follow if you liked this idea!

BTCPERP fundamental analysis.hello everyone
I have prepared a new signal for you, I write every day 10 profitable trades for the Russian and English audience, I think it will not be difficult to like and comment on the idea, your feedback is very important to me Go to the channel there is a lot of useful information.
The price tested the channel borders with a shadow up and bounced down!
What do I expect next, while the asset is steadily gaining momentum in the short and will continue to fall to about the 0.2 Fibonacci zone.
The market is overheated and needs to cool down!
